Review Article
The Use of Spatiotemporal Gait Analysis in Diagnosing Pathologies: A Review
1Faculty of Medicine, University of New South Wales, Sydney, Australia.
2NeuroSpine Surgery Research Group (NSURG), Sydney, Australia.
3Wearables and Gait Analysis Research Group (WAGAR), Sydney, Australia.
4Department of Neurosurgery, Prince of Wales Hospital, Sydney, Australia.
*Corresponding Author: Lianne Koinis, Wearables and Gait Analysis Research Group (WAGAR), Sydney, Australia.
Citation: Fernando V., Monish M Maharaj, Koinis L., Ralph J. Mobbs. (2023). The Use of Spatiotemporal Gait Analysis in Diagnosing Pathologies: A Review. Clinical Case Reports and Studies, BioRes Scientia Publishers. 3(2):1-14. DOI: 10.59657/2837-2565.brs.23.067
Copyright: © 2023 Lianne Koinis, this is an open-access article distributed under the terms of the Creative Commons Attribution License, which permits unrestricted use, distribution, and reproduction in any medium, provided the original author and source are credited.
Received: September 01, 2023 | Accepted: September 15, 2023 | Published: September 22, 2023
Abstract
Background: Gait, particularly walking speed (WS), has emerged as an essential indicator of health. WS is indicative of current health and predicts future health trends, especially in older adults. Notably, a 0.1 m/s WS increase corresponds to a 12% rise in survival among this demographic, establishing WS as a powerful prognostic tool. This has resulted in the designation of WS as the "6th vital sign", which is applicable to a broad spectrum of medical conditions. Additionally, computerized gait analysis reveals nuanced differences in movement patterns across age groups. This review provides a detailed insight into the multifaceted nature of gait and its health implications.
Purpose: This review's primary objective is to underscore the significance of gait and WS as pivotal health markers. By framing WS as the "6th vital sign" and delving into gait's complexities using digital analysis, the review aims to elucidate how gait metrics inform health trajectories in diverse medical scenarios.
Methods: Our analysis employed laboratory-based three-dimensional gait techniques. Kinematic data were obtained using infrared markers on the body and triangulated with multiple cameras. Concurrently, force plates within electronic pathways captured kinetic data, such as ground reaction forces. Data collection was guided by a pre-established checklist encompassing specific conditions (including Parkinson’s Disease, Lumbar disk herniation, Chronic Mechanical Lower back pain, Lumbar Spinal Stenosis, Depression, Hip Osteoarthritis, COPD), analysis tools (e.g., type of cameras, force plates), kinematic and kinetic parameters (e.g., support moments, momentum), and potential psychological impacts on participants (e.g., Hawthorne and “white-coat” effects). The clinical significance of our data was validated against existing research on gait pattern variations in mentioned conditions, ensuring quality through stringent research standards.
Conclusion: Spatiotemporal gait analysis, especially with machine learning application, is nascent. Although there's potential in its diagnostic capability, extensive research is needed for clinical use. Our focus was primarily on Parkinson’s Disease, aiming to gauge machine learning's role in discerning pathological from normal gait using spatiotemporal metrics. Future investigations should explore this approach for different gait-related conditions.
Keywords: gait; walking speed; health status; ageing demographics; computerized gait analysis; 6th vital sign; kinematic data; spatiotemporal metrics
Introduction
Gait as a measure of health
Gait refers to the way a person or animal walks or runs and is a simple yet informative measure of overall health. Most patterns of movement inevitably slow and deteriorate with age not only for humans, but across various species [1]. Deteriorations in gait, and in particular walking speed (WS), have been associated with a plethora of ageing-associated conditions such as cognitive impairment, arthritis, cardiovascular disease and sarcopenia, and has emerged as an important measure of overall health in ageing human populations [1]. According to a meta-analysis by Studenski et al, WS is positively associated with survival in older adults. For each increment of 0.1 m/s, a 12% increase in survival was observed (HR 0.88, 95% CI, 0.87- 0.90; P<0>
Importantly, other studies have led WS, to be dubbed as the “6th vital sign” [3] as it has proven to be a valid, reliable and sensitive [4,5] measure of health outcomes restricted not only to the context of ageing, but also various pathology groups including neurological, cardiovascular, orthopedic and psychiatric conditions [6-10]. Gait, however, is remarkably complex and is not restricted to the metric of walking speed. Computerized gait analysis with kinematic and kinetic parameters (for example cadence, reaction forces) can highlight more interesting and robust differences [1] between normative and pathological gait in the young and old [11]. This in turn, has sparked great interest in the computerized analysis of gait with the gait metrics explored below.
Types of gait analysis
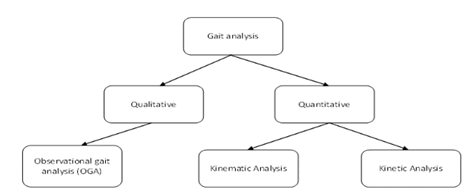
Under quantitative and qualitative gait analysis, three broad categories exist, including observational gait analysis, kinematic analysis, and kinetic analysis (see Figure 1).
Figure 1: Types of gait analysis
Gait analysis can be categorized into qualitative methods, which refers to observation by clinicians, and quantitative methods which can be further categorized into kinematic and kinetic analysis.
Observational gait analysis
Observational gait analysis methods are qualitative and are useful in the differentiation of pathological gait patterns in clinical practice. For example, a clinician may distinguish Parkinsonian gait from myopathic gait (for example positive Trendelenburg sign) or neuropathic gait (for example foot drop) [12]. However, observational methods are highly subjective, and their accuracy depends on the skill of the clinician and their knowledge of both normal and pathological gait. A study measuring the gait disturbances after stroke found poor correlation between validated foot-force sensors and clinician measurements (mean r=0.55) [13].
Kinematic Data
Kinematics describes the way in which objects move without regard for the forces which cause them to move. In contrast to observational methods, data is quantitative and includes both spatiotemporal metrics such as gait velocity, cadence, step time, step length etc. as well as descriptive components of gait such as angles of joint rotation, pronation and supination as well as range of motion [14].
Kinetic Data
Kinetic data is also quantitative in nature, but rather aims to understand why objects move the way they move i.e., regarding the forces behind the actions. As such, it includes metrics such as ground reaction force, support moment, power and energy [14].
Laboratory methods
Laboratory-based three-dimensional gait analysis has long been regarded as the “gold standard” in measuring quantitative gait parameters in both clinical and non-clinical (sport) applications [14]. The use of infrared markers placed at points around the body allow researchers to use cameras to triangulate the body in 3D space and gather highly accurate kinematic data [14]. In addition, force plates in electronic walkways can reveal kinetic data such as ground reaction forces, support moments and momentum [15]. The literature strongly suggests the clinical relevance of both kinematic and kinetic data as statistically significant differences in gait patterns have been observed in patients with lumbar spinal stenosis [16], recovering from total knee arthroplasty (TKA) [17], Parkinson’s disease [18] and obesity [19]. However, there are several drawbacks with laboratory-based analysis. Firstly, it requires expensive equipment and technicians which are not feasible in the clinical setting [20]. Secondly, these methods are susceptible to the psychological Hawthorne and “white-coat” effects as individuals are more likely to be conscious of their gait when observed by a clinician and fail to capture ‘free-living gait’ which refers to the way people walk in everyday life [20]. One study by Brodie et al. highlights this well, finding that lab-based technologies tend to overestimate parameters such as cadence (8.91%, p less than 0.001) whilst underestimating the variability in gait (81.55%, p<0>
Wearable sensors
In contrast, inertial measurement units (IMU’s) are wearable single-point devices with an accelerometer, magnetometer, and a gyroscope. Measurements made with IMU’s have shown to be largely consistent with that of the laboratory analysis techniques (r >0.83). These are very promising as they can capture free-living gait in community and home environments as they are small, portable, and unobtrusive to the activities of daily living [22-24]. The potential of IMU’s to gather kinematic data is well established in the literature with a many papers documenting the accurate measurement of spatiotemporal metrics and overall agreement with that obtained from laboratory-based techniques [25-30]. Other descriptive kinematic data such as joint angles are also possible with IMU’s, yet they often require multiple sensors and extensive calibration [31]. which again, is not feasible in the fast-paced clinical environment. However, the literature is relatively scarce when it comes to gathering clinically relevant kinetic data using IMU’s. A possible reason for this is that it is difficult to measure forces accurately without expensive electronic walkways [32]. A select few studies seek to validate use of IMU’s in the form of smart-insoles and tendon-tensiometry devices which measure kinetic parameters such as ground reaction forces and muscle work and power output respectively [32,33]. These, however, not only have limited reliability due to minimal repetition, but are also more popular in the realm of high-performance sports and rehabilitation where the real focus of gait analysis is not to identify disease states but rather to maximize the efficiency of locomotion [34]. For example, several studies have explored how GRF relates to the optimal cadence, stride length and gait velocity values for runners to minimize energy expenditure and maximize efficiency [35-37].
Whilst several studies have shown that there are clinically significant differences in kinetic metrics between various pathology groups [16-19], the literature is undecided regarding its clinical utility and indicates that kinematic parameters such as spatiotemporal data are sufficient whilst having the additional benefit of being efficiently obtained using single-point wearable IMU’s. In addition, models created by Verghese et al. and Lord et al. which used spatiotemporal data alone were able to explain up to 80% of gait variance between healthy and pathological gait using only five factors: pace, rhythm, variability, asymmetry and postural control [38,39] showing that spatiotemporal parameters are more than adequate in clinical gait analysis. Whilst the above arguments strengthen the case for the use of wearable IMU’s, they suffer from drift errors and noise due to interference with the magnetic fields of other electronic devices. According to one study, these errors can render up to 20% of data unusable. Fortunately, these entries can be manually identified and removed in data processing stages [40,41].
Spatiotemporal gait metrics
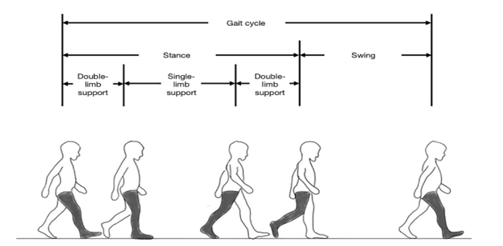
A normal gait cycle for each leg involves a stance and a swing phase. Stance (also known as support) phase describes the entire period during which a foot is on the ground, and swing describes the time this same foot is in the air as the limb advances in space. When one limb is instance, the contralateral limb is in swing, except for an overlapping period where both feet are on the ground, known as the double support time, as seen in Figure 2.
Figure 2: Gait cycle for right leg (shaded).
The figure shows that the gait cycle for any one leg is comprised of a stance and a swing phase. The right-leg is shaded and used as an example. Figure taken [83], The single support time is the period during which only one limb is on the ground. Several other spatiotemporal gait metrics exist and are shown below in Figure 3.
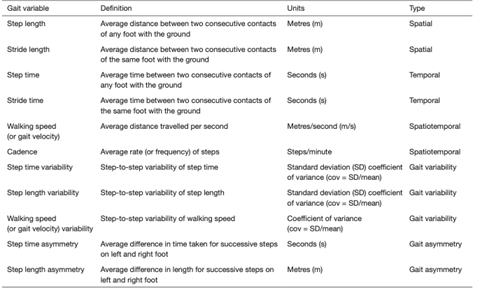
Figure 3: Common spatiotemporal gait metrics.
The figure above summarizes the most common spatiotemporal metrics. Spatial parameters such as step and stride length can be considered alongside temporal metrics of step and stride time to calculate spatiotemporal data pertaining to gait velocity and cadence. Furthermore, more complex ‘derived’ metrics such as variability and asymmetry in step time, step length and gait velocity can also be calculated. Figure taken from Natarajan et al. [83].
Using gait to distinguish pathologies
As aforementioned, several studies have demonstrated the potential for spatiotemporal gait metrics to differentiate healthy and pathological gait sig-natures. A comprehensive literature search of four databases (Medline, Embase, PubMed, Web of Science) was conducted, after which 1476 records were identified and 21 articles included after screening. These studies investigated the spatiotemporal gait metrics in various conditions and compared them to healthy age-matched controls. Findings from these articles are summarized in Table 1.
Table 1: Summary of gait alteration in various conditions.
| Gait Velocity | Cadence | Stride Length | Stride Time | Stride time variability | Double support time |
| Parkinson’s Disease [43-49,84] | |||||
| -(8-11) % | -6% | -(7-17) % | +(6-8) % | +76% | +24% |
| Lumbar Disc Herniation50 | |||||
| -76% | -66% |  |  |  | +53% |
| Chronic Mechanical Lower Back Pain [50,55,56] | |||||
| -(13-26) % | -19% |  |  |  | +(14-16) % |
| Lumbar Spinal Stenosis [51-53,85,86] | |||||
| -(12-37) % | -(10-14) % |  |  |  |  |
| Depression [87] | |||||
| -3% |  |  |  |  | +0.03% |
| Hip Osteoarthritis [88] | |||||
| -14% | -5% | -10% |  |  | +13% |
| COPD [89,90] | |||||
| -7% | -(7-13) % |  | +15% |  | +(16-17) % |
Studies included in this summary tables reported mean values of gait parameters in patients with relevant pathologies as well as their age-matched controls. The percentage difference was calculated and reported above. A range was included where results were derived from multiple studies. Table 1 is merely a snapshot of the unique gait ‘signatures’ of various pathologies which illuminates the diagnostic potential of spatiotemporal gait metrics. For example, appreciable differences can be noted between Parkinson’s disease [42-49] and Lumbar disc herniation [50] in terms of cadence (-6% vs -66%) and double support time (+24% vs +53%) whilst those with Lumbar spinal stenosis [20,51-54] present with a more modest decrease in cadence (10-14%). Moreover, the large ranges observed in the decrease in gait velocity in chronic mechanical back pain [50,55,56] (13-26%) and Lumbar spinal stenosis (12-37%) may indicate that gait metrics can diagnose the severity of a condition, or that methods used to measure gait velocity are simply imprecise. Additionally, there are many blank cells in Table 1, showing that the literature has not comprehensively addressed spatiotemporal gait changes in all gait-altering pathologies. Parkinson’s disease [42-49] is the most studied gait pattern in the literature, with studies on other pathologies being relatively scarce. Certainly, this field is still largely in its infancy and a many more research papers comparing the gait metrics of pathological and normative gait of age-matched controls of various pathologies are necessary before the diagnostic utility of gait metrics can be considered.
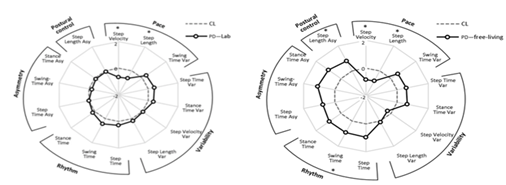
There is a single meta-analysis of spatiotemporal gait changes associated with Parkinson’s disease (PD) [57]. Its findings have very low external validity as only two studies screened in the review contained data gathered from “free-living contexts” and even these were excluded from the final meta-analysis as they were found to be largely heterogenous with laboratory data. A 2016 study by Del Din et al. [58] found statistically significant differences between laboratory and free-living gait in PD patients as can be seen in Figure 4 which demonstrates the overwhelming need for studies documenting ‘free-living’ gait and strengthens the case for the use of wearable IMU’s.
Figure 4: Radar plot illustrating 14 spatiotemporal gait metrics for patients with Parkinson’s Disease (PD) and controls (CL) as evaluated in the laboratory (left) and in free-living contexts (right). Central dotted line represents CL data and bolded line represents PD data measured in standard deviations from CL values (range  ). Figure taken from Del Din et al. [58]
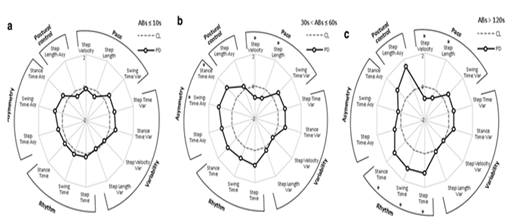
The same study also found that gait signatures varied significantly with the duration of the ambulatory bout as shown in Figure 5. Longer ambulatory bouts (ABs) were more discriminative of pathological gait in PD. This calls into question a large portion of the current literature and the short (<10>
Figure 5: Radar plot illustrating 14 spatiotemporal gait metrics for patients with Parkinson’s Disease (PD) and controls (CL) as evaluated ambulatory bouts (ABs) in free-living contexts. Central dotted line represents CL data and bolded line represents PD data measured in standard deviations from CL values (range  ). (a) represents Abs<10s>120s. Figure taken from Del Din et al. [58].
Table 2: Summary of ambulatory bouts used to measure spatiotemporal gait metrics in patients with Parkinson’s disease. Certain studies provided the ambulatory bout in the methods section. Others specified the distance of the walkway only. When the average walking speed of patients was also given, an average ambulatory bout was calculated and reported in this table.
| Study | Methods | Ambulatory bout (s) |
| Geroin et al. [47] | Use of GAITrite® electronic walkway | 7.92 |
| Muro-de-la-Herran et al. [46] | Timed 25-foot walk test | 7.50 |
| Hass et al. [91] | Use of a 5.8m x 0.9m pressure sensitive walkway | 5.10 |
| Din et al. [92] | Use of GAITrite® electronic walkway and Body worn monitory (BWM) concurrently. | 7.0 |
| Hausdorff [93] | Patients walking on level ground in the hallway outside a clinic | 120-360 |
| Schlachetzki et al. [43] | Self-selected speed on a 4x10m walkway. Patients asked to walk 10m, turn 180 degrees and repeat until a total of 40 meters were covered. | 41.03 |
Therefore, it is evident that a large proportion of the current literature would struggle to present valid and accurate gait parameters for PD patients due to heterogeneity in ABs and the large proportion of shorter ABs. There is a need for research studies measuring gait parameters over longer ABs in free-living contexts. In summary, the field of spatiotemporal gait analysis requires a great deal of optimization with standardized testing methods. For example, studies which define minimum walking length or duration and a great volume of research studies which adhere to these regulations before data can be pooled and meta-analyzed.
Feature determination and normalization
Feature determination involves the extraction of gait ‘features’ such as gait velocity, cadence, step-time, and other spatiotemporal metrics. Variations in gait data due to patient height and weight can largely be corrected via normalization and has been shown to improve the classification accuracy in some ML models [67-69]. Normalization has been investigated as a function of height, stride time and body weight as seen in Table 3. However, there is no clear consensus in the literature regarding the most beneficial approach as the use of normalization is not necessarily correlated with greater classification accuracy. The highest accuracy with normalization is 97.9% whilst an accuracy of 100% was achieved without normalization (see Table 3). This could be because numerous factors are changing between models. For example, cross-validation, feature selection and machine learning techniques have changed. Further research where all other factors other than normalization methods are controlled variables, will allow researchers to determine its utility.
Table 3: Summary of the application of ML to clinical conditions in the current literature. PCA=Principal Component Analysis, LOO= Leave one out, SVM=Support vector machine, ANN = Artificial Neural Network, NB=Naïve Bayes. ‘X’ represents studies where normalization was not applied.
| Study | Distinguishing Condition | Normalization | Feature selection | Cross-validation | Classification model | Model accuracy |
| Eskofier et al.75 | Balance impairment | Stride time | PCA | LOO | SVM | 95.8% |
| Khandoker et al.80 | Falls |  | HC | LOO | SVM | 100% |
| Begg et al.81 | Young vs Old |  | HC | 3-fold CV | SVM, ANN | 83.3%, and 75% respectively |
| Begg and Kamruzzaman69 | Young vs Old | Body weight | HC | 6-fold CV | SVM | 91% |
| Pogorelc at al.82 | Back pain | Height | PCA | 10-fold CV | SVM, NB | 97.9% and 97.2% respectively |
| Study | Distinguishing Condition | Normalization | Feature selection | Cross-validation | Classification model | Model accuracy |
| Eskofier et al.75 | Balance impairment | Stride time | PCA | LOO | SVM | 95.80% |
| Khandoker et al.80 | Falls | HC | LOO | SVM | 100% | |
| Begg et al.81 | Young vs Old | HC | 3-fold CV | SVM, ANN | 83.3%, and 75% respectively | |
| Begg and Kamruzzaman69 | Young vs Old | Body weight | HC | 6-fold CV | SVM | 91% |
| Pogorelc at al.82 | Back pain | Height | PCA | 10-fold CV | SVM, NB | 97.9% and 97.2% respectively |
Feature selection
Spatiotemporal gait analysis involves many features and produces a multitude of data. Feature selection aims to optimize the performance of the ML model by selecting the most relevant features with maximal separation between classes to ensure the model is both time and cost-efficient [70,71]. Methodologies fall under three main categories: filter, wrapper, and embedded methods. Filter methods are the least computationally intensive as they evaluate the dataset without evaluating the performance of the ML classification model [70]. Wrapper methods are the most computationally intensive as they evaluate the dataset and select features tailored to the performance of the ML model [70]. Embedded methods consider both the dataset and the performance of the model with the advantage of being much less compu-tationally intensive than wrapper methods [70].
The most common feature selection methods used in gait analysis are Principal Component Analysis (PCA) a filter method, Genetic Algorithm (GA) a wrapper method, and Hill-climbing (HC) an embedded method [72-74]. Upon analysis of the literature, PCA which is the most basic and computationally simple technique, provides the most reliable results [75] (model accuracy >95%) (see Table 3). Theoretically speaking, HC is expected to be quite promising as an embedded method and has been highly successful (>96
Cross-validation
Cross-validation (CV) is used to evaluate the generalizability and external validity of findings by ML models by splitting data into training subsets used to train the ML model and a validation subset which seeks to validate the model [69,74,77]. Proper implementation of CV techniques is known to evaluate overfitting by measuring a quantity known as the root mean-squared-error in as it pertains to predictions made [73]. Most common CV techniques include the k-fold and leave one out (LOO) method. K-fold techniques randomly partition data into k subsets and k-1 subsets are used as training subsets, whilst the remaining one is used to validate the model [69]. LOO methodology uses the same concept as k-fold except that it is not random as data in each subset belongs to an individual participant.
Classification
Support vector machine (SVM), Naïve-Bayes (NB), and Artificial Neural networks (ANN) were by far the most common ML models used for classification purposes in the literature. SVM utilizes supervised learning methods to compute a hyperplane with greatest separability between the analyzed classes [69] whilst NB utilizes the Bayes theorem and assumes that all features are independent to create a probabilistic model [78]. Finally, ANN’s feature a feed-forward networks where multiple nodes ‘synapse’ upon each other in a layered system, and rely on a ‘transfer-function’ for forward propagation and classification of pathological gait [79]. Clearly, SVM has shown the greatest success with model accuracies as high as 100% [75] (see Table 3). It is also the most used ML model [75,80-82]. NB has been featured sparingly in the literature, and more papers featuring this model are required before its utility can be determined.
Model evaluation
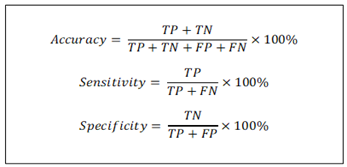
The literature has consistently used some or all of three metrics: accuracy, sensitivity, and specificity to evaluate the ML models and these are summarized in Figure 7.
Figure 7: Overview of metrics used to analyze machine learning models. TN = true negative, TP=true positive, FN=false negative, FP=false positive.
In summary, the combination of Principle Component Analysis and Support Vector Machine are the most reliable feature selection methods and ML models respectively when evaluated in terms of classification accuracy. Currently, k-fold CV is the most valid, with higher ‘k’ numbers indicating more iterations, culminating in greater accuracy [82].
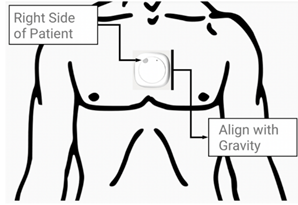
Figure 8: Metaemotion the MetaemotionC© (MMC) inertial measurement unit (IMU) developed by Mbientlab Inc. pictured as it will be fitted on the sternal angle of patients. Figure taken from Betteridge et al [94].
Conclusion and rationale
The field of spatiotemporal gait analysis is very much in its early days, and the application of ML models is even further in its infancy. Whilst the literature has shown that the combination of the two can produce a very powerful diagnostic tool, it requires significant further research so that it may be optimized for day-to-day clinical use. Current research is greatly heterogenous amongst the various pathologies explored and data-analysis techniques applied and lacks the repetitions required to make reliable conclusions. Furthermore, the use of ML models has not been optimized for any one pathology. As such, study aims to focus on a single pathology, Parkinson’s Disease, and comprehensively explore the utility of machine learning in distinguishing healthy and pathological gait based on spatiotemporal gait metrics. Further studies should systematically repeat this type of investigation not only for Parkinson’s disease but for other gait altering pathologies.
Declarations
Ethics approval and consent to participate
Not applicable
Consent for publication
Not applicable
Availability of data and materials
Not applicable
Competing interests
The authors declare that they have no competing interests.
Funding
The authors declare that they have no funding.
Author contributions
(I): Conception and design: VF. RJM.
(II): Administrative support: VF. MM. LK.
(III): Provision of study materials or patients: VF. MM. RJM.
(IV): Collection and assembly of data: VF. RJM.
(V): Data analysis and interpretation: VF. MM. RJM.
(VI): Manuscript writing: All Authors
(VII): Final approval of manuscript: All authors
References
- LeBrasseur, N.K. (2019). Gait as an Integrative Measure and Predictor of Health Across Species. J. Gerontol. A Biol. Sci. Med. Sci, 74:1411-1412.
Publisher | Google Scholor - Studenski S, et al. (2011). Gait Speed and Survival in Older Adults. JAMA, 305:50-58.
Publisher | Google Scholor - Middleton A, Fritz, S.L & Lusardi M. (2015). Walking speed: the functional vital sign. J Aging Phys Act, 23:314-322.
Publisher | Google Scholor - Rydwik E, Bergland A, Forsén L & Frändin K. (2012). Investigation into the reliability and validity of the measurement of elderly people's clinical walking speed: a systematic review. Physiother Theory Pract, 28:238-256.
Publisher | Google Scholor - van Iersel M.B, Munneke M, Esselink R.A, Benraad C.E & Olde Rikkert M.G. (2008). Gait velocity and the Timed-Up-and-Go test were sensitive to changes in mobility in frail elderly patients. J Clin Epidemiol, 61:186-191.
Publisher | Google Scholor - Brandler T.C, Wang C, Oh-Park M, Holtzer R & Verghese J. (2012). Depressive symptoms and gait dysfunction in the elderly. Am J Geriatr Psychiatry, 20:425-432.
Publisher | Google Scholor - Dumurgier J, et al. (2009). Slow walking speed and cardiovascular death in well functioning older adults: prospective cohort study. Bmj, 339:4460.
Publisher | Google Scholor - Perry J, Garrett M, Gronley J.K & Mulroy S.J. (1995). Classification of walking handicap in the stroke population. Stroke, 26:982-989.
Publisher | Google Scholor - Hollman J.H, et al. (2008). Minimum detectable change in gait velocity during acute rehabilitation following hip fracture. J Geriatr Phys Ther, 31:53-56.
Publisher | Google Scholor - Motyl J.M, Driban J.B, McAdams E, Price L.L & McAlindon T.E. (2013). Test-retest reliability and sensitivity of the 20-meter walk test among patients with knee osteoarthritis. BMC Musculoskelet Disord, 14:166.
Publisher | Google Scholor - Zhou Y, et al. (2020). The detection of age groups by dynamic gait outcomes using machine learning approaches. Scientific Reports, 10:4426.
Publisher | Google Scholor - Toro B, Nester C & Farren P. (2003). A review of observational gait assessment in clinical practice. Physiotherapy Theory and Practice, 19:137-149.
Publisher | Google Scholor - McGinley J.L, Goldie P.A, Greenwood K.M & Olney S.J. (2003). Accuracy and Reliability of Observational Gait Analysis Data: Judgments of Push-off in Gait After Stroke. Phys Ther, 83:146-160.
Publisher | Google Scholor - Dicharry J. (2010). Kinematics and kinetics of gait: from lab to clinic. Clin Sports Med, 29:347-364.
Publisher | Google Scholor - Schniepp R, Möhwald K & Wuehr M. (2019). Clinical and automated gait analysis in patients with vestibular, cerebellar, and functional gait disorders: perspectives and limitations. J Neurol, 266:118-122.
Publisher | Google Scholor - Wang J, et al. (2022). Changes in kinematics, kinetics, and muscle activity in patients with lumbar spinal stenosis during gait: systematic review. Spine J, 22:157-167.
Publisher | Google Scholor - Christensen J.C, et al. (2021). Longitudinal study of knee load avoidant movement behavior after total knee arthroplasty with recommendations for future retraining interventions. Knee, 30:90-99.
Publisher | Google Scholor - Oh J, Eltoukhy M, Kuenze C, Andersen M.S & Signorile J.F. (2020). Comparison of predicted kinetic variables between Parkinson's disease patients and healthy age-matched control using a depth sensor-driven full-body musculoskeletal model. Gait Posture, 76:151-156.
Publisher | Google Scholor - Vakula M.N, Garcia S.A, Holmes S.C & Pamukoff D.N. (2022). Association between quadriceps function, joint kinetics, and spatiotemporal gait parameters in young adults with and without obesity. Gait & Posture, 92:421-427.
Publisher | Google Scholor - Perring J, Mobbs R & Betteridge C. (2020). Analysis of Patterns of Gait Deterioration in Patients with Lumbar Spinal Stenosis. World Neurosurg, 141:55-59.
Publisher | Google Scholor - Brodie M.A, et al. (2016). Wearable pendant device monitoring using new wavelet-based methods shows daily life and laboratory gaits are different. Med Biol Eng Comput, 54:663-674.
Publisher | Google Scholor - Washabaugh E.P, Kalyanaraman T, Adamczyk P.G, Claflin E.S & Krishnan C. (2017). Validity and repeatability of inertial measurement units for measuring gait parameters. Gait & Posture, 55:87-93.
Publisher | Google Scholor - Kluge F, et al. (2017). Towards Mobile Gait Analysis: Concurrent Validity and Test-Retest Reliability of an Inertial Measurement System for the Assessment of Spatio-Temporal Gait Parameters. Sensors (Basel, Switzerland), 17:1522.
Publisher | Google Scholor - Rantalainen T, Pirkola H, Karavirta L, Rantanen T & Linnamo V. (2019). Reliability and concurrent validity of spatiotemporal stride characteristics measured with an ankle-worn sensor among older individuals. Gait Posture, 74:33-39.
Publisher | Google Scholor - Boekesteijn R.J, Smolders J.M.H, Busch V, Geurts A.C.H & Smulders K. (2021). Independent and sensitive gait parameters for objective evaluation in knee and hip osteoarthritis using wearable sensors. BMC Musculoskeletal Disorders, 22:242.
Publisher | Google Scholor - Brognara L, Mazzotti A, Di Martino A, Faldini C & Cauli O. (2021). Wearable Sensor for Assessing Gait and Postural Alterations in Patients with Diabetes: A Scoping Review. Medicina, 57:22.
Publisher | Google Scholor - DeJong Lempke A.F, Hart J.M, Hryvniak D.J, Rodu J.S & Hertel J. (2021). Use of wearable sensors to identify biomechanical alterations in runners with Exercise-Related lower leg pain. Journal of Biomechanics, 126:110646.
Publisher | Google Scholor - Hauth J, et al. (2021). Automated Loss-of-Balance Event Identification in Older Adults at Risk of Falls during Real-World Walking Using Wearable Inertial Measurement Units. Sensors, 21.
Publisher | Google Scholor - Motti Ader L.G, Greene B.R, McManus K & Caulfield B. (2021). Reliability of inertial sensor based spatiotemporal gait parameters for short walking bouts in community dwelling older adults. Gait & Posture, 85:1-6.
Publisher | Google Scholor - Ismailidis P, et al. (2020). Measuring gait kinematics in patients with severe hip osteoarthritis using wearable sensors. Gait & Posture, 81:49-55.
Publisher | Google Scholor - Huang Z, Li J & Lian J. (2022). Wearable Sensors for Detecting and Measuring Kinetic Characteristics. Journal of Physics: Conference Series, 2174:012007.
Publisher | Google Scholor - Carroll K, Kennedy R.A, Koutoulas V, Bui M & Kraan C.M. (2022), Validation of shoe-worn Gait Up Physilog R5 wearable inertial sensors in adolescents. Gait & Posture, 91:19-25.
Publisher | Google Scholor - Abdelhady M, Bogert A.J.v.d & Simon D. (2019). A High-Fidelity Wearable System for Measuring Lower-Limb Kinetics and Kinematics. IEEE Sensors Journal, 19:12482-12493.
Publisher | Google Scholor - Hollis C.R, Koldenhoven R.M, Resch J.E & Hertel J. (2021). Running biomechanics as measured by wearable sensors: effects of speed and surface. Sports Biomech, 20:521-531.
Publisher | Google Scholor - Seshadri D.R, et al. (2019). Wearable sensors for monitoring the physiological and biochemical profile of the athlete. npj Digital Medicine, 2:72.
Publisher | Google Scholor - Bus S.A. (2003). Ground reaction forces and kinematics in distance running in older-aged men. Med Sci Sports Exerc, 35:1167-1175.
Publisher | Google Scholor - Yu L, et al. (2021). Principal Component Analysis of the Running Ground Reaction Forces With Different Speeds. Front Bioeng Biotechnol, 9:629809.
Publisher | Google Scholor - Verghese J, et al. (2008). Gait dysfunction in mild cognitive impairment syndromes. J Am Geriatr Soc, 56:1244-1251.
Publisher | Google Scholor - Lord S, et al. (2013). Independent domains of gait in older adults and associated motor and nonmotor attributes: validation of a factor analysis approach. J Gerontol A Biol Sci Med Sci, 68:820-827.
Publisher | Google Scholor - Felisberto F, Fdez.-Riverola F & Pereira A. (2014). A Ubiquitous and Low-Cost Solution for Movement Monitoring and Accident Detection Based on Sensor Fusion. Sensors, 14:8961-8983.
Publisher | Google Scholor - Merilahti J, et al. (2009). Compliance and technical feasibility of long-term health monitoring with wearable and ambient technologies. J Telemed Telecare, 15:302-309.
Publisher | Google Scholor - Godi M, Arcolin I, Giardini M, Corna S & Schieppati M. (2021). A pathophysiological model of gait captures the details of the impairment of pace/rhythm, variability and asymmetry in Parkinsonian patients at distinct stages of the disease. Scientific Reports, 11.
Publisher | Google Scholor - Schlachetzki J.C.M, et al. (2017). Wearable sensors objectively measure gait parameters in Parkinson's disease. PloS one, 12:0183989.
Publisher | Google Scholor - Morris R, et al. (2017). A model of free-living gait: A factor analysis in Parkinson's disease. Gait Posture, 52:68-71.
Publisher | Google Scholor - Espay A.J, et al. (2016). Technology in Parkinson's disease: Challenges and opportunities. Mov Disord, 31:1272-1282.
Publisher | Google Scholor - Muro-de-la-Herran A, Garcia-Zapirain B & Mendez-Zorrilla A. (2014). Gait analysis methods: an overview of wearable and non-wearable systems, highlighting clinical applications. Sensors (Basel, Switzerland), 14:3362-3394.
Publisher | Google Scholor - Geroin C, et al. (2018). Does dual-task training improve spatiotemporal gait parameters in Parkinson's disease? Parkinsonism Relat Disord, 55:86-91.
Publisher | Google Scholor - Zhang S, et al. (2016). Age- and Parkinson’s disease-related evaluation of gait by General Tau Theory. Experimental Brain Research, 234:2829-2840.
Publisher | Google Scholor - Maetzler W, Klucken J & Horne M. (2016). A clinical view on the development of technology-based tools in managing Parkinson's disease. Mov Disord, 31:1263-1271.
Publisher | Google Scholor - Bonab M, Colak T.K, Toktas Z.O & Konya D. (2020). Assessment of Spatiotemporal Gait Parameters in Patients with Lumbar Disc Herniation and Patients with Chronic Mechanical Low Back Pain. Turkish neurosurgery, 30:277-284.
Publisher | Google Scholor - Loske S, et al. (2018). Decompression surgery improves gait quality in patients with symptomatic lumbar spinal stenosis. Spine J, 18:2195-2204.
Publisher | Google Scholor - Sun J, et al. (2018). Clinical Gait Evaluation of Patients with Lumbar Spine Stenosis. Orthopaedic Surgery, 10:32-39.
Publisher | Google Scholor - Papadakis N.C, et al. (2009). Gait variability measurements in lumbar spinal stenosis patients: part A. Comparison with healthy subjects. Physiol Meas, 30:1171-1186.
Publisher | Google Scholor - Odonkor C, et al. (2020). Gait features for discriminating between mobility-limiting musculoskeletal disorders: Lumbar spinal stenosis and knee osteoarthritis. Gait Posture, 80:96-100.
Publisher | Google Scholor - Demirel A, Onan D, Oz M, Ozel Asliyuce Y & Ulger O. (2020). Moderate disability has negative effect on spatiotemporal parameters in patients with chronic low back pain. Gait & posture, 79:251-255.
Publisher | Google Scholor - Hicks G.E, Sions J.M, Coyle P.C & Pohlig R.T. (2017). Altered spatiotemporal characteristics of gait in older adults with chronic low back pain. Gait & Posture, 55:172-176.
Publisher | Google Scholor - Bouca-Machado R, et al. (2020). Gait Kinematic Parameters in Parkinson's Disease: A Systematic Review. Journal of Parkinson's disease, 10:843-853.
Publisher | Google Scholor - Del Din S, Godfrey A, Galna B Lord S & Rochester L. (2016). Free-living gait characteristics in ageing and Parkinson’s disease: impact of environment and ambulatory bout length. Journal of NeuroEngineering and Rehabilitation, 13:46.
Publisher | Google Scholor - Ismail A.R & Asfour S.S. (1999). Discrete wavelet transform: a tool in smoothing kinematic data. J Biomech, 32:317-321.
Publisher | Google Scholor - Mezghani N, et al. (2008). Automatic classification of asymptomatic and osteoarthritis knee gait patterns using kinematic data features and the nearest neighbor classifier. IEEE Trans Biomed Eng, 55:1230-1232.
Publisher | Google Scholor - Jones L, Beynon M.J, Holt C.A & Roy S. (2006). An application of the Dempster-Shafer theory of evidence to the classification of knee function and detection of improvement due to total knee replacement surgery. J Biomech, 39:2512-2520.
Publisher | Google Scholor - Takahashi T, et al. (2005). Trunk deformity is associated with a reduction in outdoor activities of daily living and life satisfaction in community-dwelling older people. Osteoporos Int, 16:273-279.
Publisher | Google Scholor - Chau T. (2001). A review of analytical techniques for gait data. Part 2: neural network and wavelet methods. Gait Posture, 13:102-120.
Publisher | Google Scholor - Su F.C & Wu W.L. (2000). Design and testing of a genetic algorithm neural network in the assessment of gait patterns. Med Eng Phys, 22:67-74.
Publisher | Google Scholor - Abujrida H, Agu E. & Pahlavan K. (2020). Machine learning-based motor assessment of Parkinson's disease using postural sway, gait and lifestyle features on crowdsourced smartphone data. Biomed Phys Eng Express, 6:035005.
Publisher | Google Scholor - Aich S, et al. (2020). Design of a Machine Learning-Assisted Wearable Accelerometer-Based Automated System for Studying the Effect of Dopaminergic Medicine on Gait Characteristics of Parkinson's Patients. Journal of Healthcare Engineering, 2020.
Publisher | Google Scholor - Wu J, Wang J & Liu L. (2007). Feature extraction via KPCA for classification of gait patterns. Human Movement Science, 26:393-411.
Publisher | Google Scholor - Hanson M.A, H. C. Powell J, Barth A.T, Lach J & Brandt-Pearce M. (2009). Neural Network Gait Classification for On-Body Inertial Sensors. in 2009 Sixth International Workshop on Wearable and Implantable Body Sensor Networks, 181-186.
Publisher | Google Scholor - Begg R & Kamruzzaman J. (2005). A machine learning approach for automated recognition of movement patterns using basic, kinetic and kinematic gait data. Journal of Biomechanics, 38:401-408.
Publisher | Google Scholor - Saeys Y, Inza I & Larrañaga P. (2007). A review of feature selection techniques in bioinformatics. Bioinformatics, 23:2507-2517.
Publisher | Google Scholor - Zhang J, Lockhart T.E & Soangra R. (2014). Classifying Lower Extremity Muscle Fatigue During Walking Using Machine Learning and Inertial Sensors. Annals of Biomedical Engineering, 42:600-612.
Publisher | Google Scholor - Lu Y, Boukharouba K, Boonært J, Fleury A & Lecœuche S. (2014). Application of an incremental SVM algorithm for on-line human recognition from video surveillance using texture and color features. Neurocomputing, 126:132-140.
Publisher | Google Scholor - Martins M, Santos C, Costa L & Frizera A. (2015). Feature reduction with PCA/KPCA for gait classification with different assistive devices. INTERNATIONAL JOURNAL OF INTELLIGENT COMPUTING AND CYBERNETICS, 8:363-382.
Publisher | Google Scholor - Martins M, Costa L, Frizera A, Ceres R & Santos C. (2014). Hybridization between multi-objective genetic algorithm and support vector machine for feature selection in walker-assisted gait. Computer Methods and Programs in Biomedicine, 113:736-748.
Publisher | Google Scholor - Eskofier B.M, Federolf P, Kugler P.F & Nigg B.M. (2013). Marker-based classification of young–elderly gait pattern differences via direct PCA feature extraction and SVMs. Computer Methods in Biomechanics and Biomedical Engineering, 16:435-442.
Publisher | Google Scholor - Ashfaq Z, et al. (2022). Embedded AI-Based Digi-Healthcare. Applied Sciences, 12.
Publisher | Google Scholor - López V, Fernández A & Herrera F. (2014). On the importance of the validation technique for classification with imbalanced datasets: Addressing covariate shift when data is skewed. Information Sciences, 257:1-13.
Publisher | Google Scholor - Badesa F.J, et al. (2014). Auto-adaptive robot-aided therapy using machine learning techniques. Computer Methods and Programs in Biomedicine, 116:123-130.
Publisher | Google Scholor - Ardestani M.M, Moazen M & Jin Z. (2014). Gait modification and optimization using neural network–genetic algorithm approach: Application to knee rehabilitation. Expert Systems with Applications, 41:7466-7477.
Publisher | Google Scholor - Khandoker A.H, Lai D.T.H, Begg R.K & Palaniswami M. (2007). Wavelet-Based Feature Extraction for Support Vector Machines for Screening Balance Impairments in the Elderly. IEEE Transactions on Neural Systems and Rehabilitation Engineering, 15:587-597.
Publisher | Google Scholor - Begg R, Palaniswami M & Owen B. (2005). Support Vector Machines for Automated Gait Classification. IEEE transactions on bio-medical engineering, 52:828-838.
Publisher | Google Scholor - Pogorelc B, Bosnić Z & Gams M. (2012). Automatic recognition of gait-related health problems in the elderly using machine learning. Multimedia Tools and Applications, 58:333-354.
Publisher | Google Scholor - Natarajan P, et al. (2022). Analysing gait patterns in degenerative lumbar spine diseases: a literature review. Journal of Spine Surgery.
Publisher | Google Scholor - Godi M, Arcolin I, Giardini M, Corna S & Schieppati M. (2021). A pathophysiological model of gait captures the details of the impairment of pace/rhythm, variability and asymmetry in Parkinsonian patients at distinct stages of the disease. Scientific reports, 11:21143.
Publisher | Google Scholor - Perring J, Mobbs R & Betteridge C. (2020). Analysis of Patterns of Gait Deterioration in Patients with Lumbar Spinal Stenosis. World neurosurgery, 141:55-59.
Publisher | Google Scholor - Odonkor C, et al. (2020). Gait features for discriminating between mobility-limiting musculoskeletal disorders: Lumbar spinal stenosis and knee osteoarthritis. Gait & posture, 80:96-100.
Publisher | Google Scholor - Briggs R, et al. (2019). Do Differences in Spatiotemporal Gait Parameters Predict the Risk of Developing Depression in Later Life? Journal of the American Geriatrics Society 67:1050-1056.
Publisher | Google Scholor - Khashan M, et al. (2014). Gait metric profile and gender differences in hip osteoarthritis patients. A case-controlled study. Hip international : the journal of clinical and experimental research on hip pathology and therapy, 24:270-276.
Publisher | Google Scholor - Nantsupawat N, Lane P, Siangpraipunt O, Gadwala S & Nugent K. (2015). Gait Characteristics in Patients With Chronic Obstructive Pulmonary Disease. Journal of primary care & community health, 6:222-226.
Publisher | Google Scholor - Liu W Y, et al. (2017). Spatiotemporal gait characteristics in patients with COPD during the Gait Real-time Analysis Interactive Lab-based 6-minute walk test. PloS one, 12:0190099.
Publisher | Google Scholor - Hass C.J, et al. (2012). Quantitative normative gait data in a large cohort of ambulatory persons with Parkinson's disease. PloS one, 7:42337-42337.
Publisher | Google Scholor - Din S.D, Godfrey A & Rochester L. (2016). Validation of an Accelerometer to Quantify a Comprehensive Battery of Gait Characteristics in Healthy Older Adults and Parkinson's Disease: Toward Clinical and at Home Use. IEEE Journal of Biomedical and Health Informatics, 20:838-847.
Publisher | Google Scholor - Hausdorff J.M. (2009). Gait dynamics in Parkinson's disease: common and distinct behavior among stride length, gait variability, and fractal-like scaling. Chaos, 19:026113-026113.
Publisher | Google Scholor - Betteridge C, et al. (2021). Objectifying clinical gait assessment: using a single-point wearable sensor to quantify the spatiotemporal gait metrics of people with lumbar spinal stenosis. J Spine Surg, 7:254-268.
Publisher | Google Scholor

