Research Article
An Improved and Efficient Content-Based Medical Image Retrieval Technique vs State-of-Art Texture Feature Extraction Techniques
1Department of Computer Science, University of Energy & Natural Resources, Ghana.
2University of Energy & Natural Resources, Ghana.
3 Department of Computer Science & Informatics, University of Energy & Natural Resources, Ghana.
*Corresponding Author: ty of Energy & Natural Resources, Ghana.
Citation: Samuel K. Duah, Appiah O., Appiahene P. (2023). An Improved and Efficient Content-Based Medical Image Retrieval Technique Vs. State-Of-Art Texture Feature Extraction Techniques, Journal of BioMed Research and Reports, BRS Publishers. 2(4); DOI: 10.59657/2837-4681.brs.23.016
Copyright: © 2023 Samuel Kusi-Duah, this is an open-access article distributed under the terms of the Creative Commons Attribution License, which permits unrestricted use, distribution, and reproduction in any medium, provided the original author and source are credited.
Received: February 24, 2023 | Accepted: May 25, 2023 | Published: June 01, 2023
Abstract
Areas in the health sector such as X-rays, Dermatology, High-resolution Computed Tomography – HRCT, Endoscopy, Radiology, Cardiology and Magnetic Resonance Imaging – MRI heavily depend on medical images for their activities hence it has become complex for managing and accessing these images from their repositories. As a matter of concern content-based medical image retrieval-CBMIR has been the system proposed by many researchers for handling access to similar medical image(s) as the input image, yet there is a caveat that has to be addressed with respect to which technique best suits CBMIR system with respect to a given performance metric. Medical images are mostly of grayscale and therefore color feature extraction techniques may not work effectively on them. Since there is no clear indication of which of the various texture feature extraction techniques is best suited for a given performance metric, this work seeks to comparatively evaluate the performance of the following state-of-the-art texture feature extraction techniques; Local Binary Pattern (LBP), Gabor Filter, Gray-Level Co-occurrence Matrix (GLCM), Haralick Descriptor, Features from Accelerated Segment Test (FAST) and a Proposed Technique using the metrics; Precision, Recall, F1-score, Mean Squared Error (MSE), Accuracy and Time. The results showed that the proposed technique is best suited for systems focusing on precision with an average precision score of 100% over 10.5k of raw medical images (dataset) using an appreciable minimum time with time complexity of .
Keywords: content-based image retrieval; medical image retrieval; content-based medical image retrieval; texture feature extraction; evaluation metrics; similarity measurement
Introduction
The branch of biological science that deals with the visual representation of the function of the organs or tissues in the human body is known as physiology. The technique for undergoing the physiological processing is the medical imaging. Medical imaging refers to the technique that seeks to make visible the internal structures that are hidden by the skin and bones for medical diagnosis. Medical imaging is considered as part of pathology (branch of medical sciences that studies the deviation of a body from a healthy or normal condition) since it is capable of establishing a database of normal anatomy to make it possible to identify any abnormalities. Medical imaging is therefore perceived to include a set of techniques that noninvasively produce captured images of the internal aspect of a body, as in the case of medical ultrasound that uses the ultrasonic pressure waves and echoes in capturing internal tissues of a body as well as the radiography projection that uses X-ray radiation.
In medicine, tissues are expected to have consistent and homogenous texture. Therefore, in the medical domain, researchers usually use texture features because organs and tissue anomalies are well characterized by texture properties [1, 2]. In that texture features have been used for brain tumor diagnosis [3] and mass lesion detection in mammogram images [4]. Thus texture-based feature is the best feature descriptor option to select to discriminate among organ tissues in CBIR system [5]. However, some of these works compared few textures feature extraction approaches usually two texture feature extraction techniques on limited dataset such as in [6], [7] and [8] making it difficult for practitioners to make informed choice on which of the various texture-based feature extraction approach to select at some point in time on condition to select the best performing technique with the highest precision irrespective of the dataset used. Interpreting medical images is certainly a complex task which requires extensive knowledge [5]. According to [9] Computer Aided Diagnosis (CAD) serves as a second opinion that will help radiologists in diagnosis and on the other hand Content-based Image Retrieval uses visual content to help users browse, search and retrieve similar medical images from a database based on the user’s interest [10, 11]. The competency of CBMIR system depends on feature extraction methods [12]. The textural features are very important to determine the content of a medical image.
Therefore, this study seeks to compare and evaluate some of the hand-crafted texture feature extraction techniques in CBMIR. This is to help those concerned in enhancing CBIR systems to make informed decisions concerning the selection of the best textural feature extraction techniques. The paper is in six (8) sections; section (1) introduces the content together with the background study which conclusively indicates the objective of the research. Section (2) talks about the related works. Section (3) talks about the methodology carried out to achieve the said results in section (5). Section (4) provides the code and data source. Section (5) provides the results, analysis and discussion. Section (6) provides summary points of this study. Section (7) discloses any conflict of interests towards carrying out this research. Section (8) acknowledges the bodies that provided support to completing this research successfully together with the referencing materials and their source.
Related Works
The issue of sorting through images in search of a particular image of interest is not new. Since the early 1990’s there have been numerous studies carried out into content-based image retrieval – CBIR systems. Some of these studies includes; Query-By-Image-Content – QBIC (Niblack et al, 1993), the VIR Image Engine (Bach, et al, 1996), the AltaVista Photo finder, Multimedia Analysis and Retrieval System – MARS (Huang et al, 1996), Photobook (Pentland et al, 1994), Netra (Ma and Majunath 1999), Retrieval Ware (Dowe, 1993) etc.
Of late, there are two known common image search methods namely; Text-based Image Retrieval and the Content-based Image Retrieval. Text-based Image Retrieval is based on keywords which are used in annotating images [13] whiles Content-based Image Retrieval is based on querying images to return similar visual content image(s) [14] [15]. It is recommended to use content-based image retrieval search method to overcome the following disadvantages of text-based image retrieval; Feasibility challenge in manually annotating images in large databases
It is subject to human perception when end user is to make the annotation.
The annotations are applicable for only one language, Basically, the aim of CBIR is to search for similar images by analyzing their visual contents. In order to overcome the concept of human perception in text-based image retrieval, content-based image retrieval search method should be able to bridge the gap between low-level feature and high-level feature to increase accuracy [16]. Due to the necessity for this bridge, numerous studies have focused their concern on the issue of making up in bridging this semantic gap. These numerous studies have resulted in methods for converting the problematic high-level concept to feature extraction [17]. Therefore, it means that feature extraction (image representation) is the crux of CBIR [18, 19, 20].
Texture is considered as the pivotal feature in computer vision (CV) due to its existence in many real images which is why it is usually used in image retrieval and pattern recognition. Drawbacks of texture-based image retrieval are noise sensitivity and computational complexity [21]. Some of the algorithms used for texture-based image analysis includes: Gabor filter [22], gray-level co-occurrence matrix (GLCM) [23], Features from Accelerated Segment Test–FAST [24], Haralick Descriptor [25], Local Binary Pattern–LBP [26], Markov random field [27], edge histogram descriptor (EHD) [28] etc. Content-based Image Retrieval process begins with the feature extraction that aims at converting human perception into numerical description that can be understood and manipulated by machines. This basically influences the accuracy of the queried image [29]. Feeding machine learning algorithms whether supervised or unsupervised with the extracted features can improve the performance of CBIR [30].
Consequently, another important process in the Content-based Image Retrieval system is the similarity measurement or feature matching. The similarity measure is another vital process that has an impact on the performance of CBIR. Since this measurement is determined by the layout of the feature vector, choosing an inappropriate measure would result in less identical images been returned hence lowering the system’s CBIR accuracy.
Also, certain metrics such as precision, recall and run time are used in determining the effectiveness of CBIR based on the type of datasets chosen or selected [31].
Currently, computer-aided diagnostic schemes are under development in several research institutions to assist physicians in improving diagnostic accuracy by minimizing the rate of missed diagnosis. These computer-aided diagnostic applications make use of pattern recognition and feature extraction techniques to develop systems such as; computerized detection of pulmonary nodules and mammography micro calcifications [32], automated analysis of heart sizes [33], system for characterization and detection of interstitial disease [34]. The implementation of these tools as well as new knowledge-based tools to be developed over the next few years will definitely need to interface with medical imaging databases hence, the need to improve on its image retrieval system now. The increasing amount of medical imagery data has resulted in widespread dissemination of Picture Archiving and Communication Systems (PACS) in hospitals which requires a more efficient and effective retrieval methods for better management of such data. The integration of content-based image retrieval system into the PACS system has been proposed [35] [36]. However, an efficient and robust medical image retrieval still remains problem and recent researches aim at developing techniques that will overcome this problem. This why this study seeks to conduct a comparative analysis on a proposed texture feature extraction technique against some of the state-of-the-art texture features extraction techniques on medical image retrieval.
Methodology
Proposed Method
The proposed technique combines the idea of extracting features of individual images and computing their similarities (Similarity Measurement), the measurement is reinforced with Euclidean distance measurement. The pseudocode below interprets the Extracting and similarity process:
Step 1. The input image is converted to an array containing its colour codes in 3-dimension (feature vector). Using the code snippet: image = cv2.imread (image); mat = image [: 0].
Step 2. Step 1 is repeated for individual images in the database and compared for similar values. Though the dataset is prepared to attain uniform dimension, the technique begins the comparison by checking the dimension of both images (queried image and target image). The number of similar values or matched codes obtained is compared to those of different values. If the number of similar values is greater than those of different values, then we have a similar target image, else we move to Step 3.
Step 3. Measure the similarity between the queried image to that of the target image using the Euclidean distance measurement. Target image(s) is/are retrieved based on the threshold value given. To ensure maximum precision, the algorithm is taking the least distance obtained plus 5 subsequent values.
One of the most popular ways to evaluate the complexity of an algorithm is using Big O notation [37]. The Big O notation is a mathematical property which is used for describing the behavior of functions. Since the algorithm loops through the images in the dataset to compare the features one after the other against the query image, then the big O notation for the algorithm is of O(n), i.e., the time taken for execution grows linearly with n which represents the amount of data in the dataset.
Conceptual Framework of the Proposed Method
Content-based medical image retrieval is a kind of content-based image retrieval system that focuses on medical image dataset. Considering how image retrieval should be done, a representation of the entire image is to be identified – global features of the medical images. Since the textural aspect is been identified as the best in terms of representing the entirety of a medical image, the proposed method together with the techniques used in this research sort to extract the textural features of the images.
The conceptual framework is important for the researcher to clearly present and explain ideas and consequently potential relationships pertaining to the study [38]. One way of presenting such concepts is by a visual model that can assists readers by illustrating how the processes or constructs in the research work. This is known as a graphical conceptual framework. The diagram below represents the graphical conceptual framework of the proposed method.
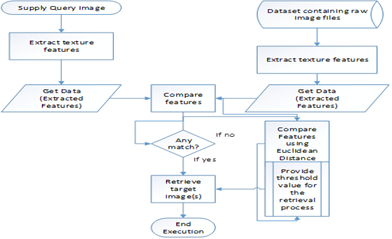
Figure 1: Graphical Conceptual Framework of Proposed Method.
Dataset Validation
The implementation activities involve data pre-processing. Data pre-processing is a technique that ensures the cleansing and organization of data. In order words, data pre-processing refers to the technique of preparing data in order to make it suitable for training and building a machine learning model. Data pre-processing is a data mining technique that transforms raw data into an understandable and readable format for the learning model. This process helps enhance the quality of data to promote the extraction of meaningful insights from the data. The following includes the steps taken in pre-processing the data for the various learning model:
- Acquisition of dataset
- Uniformity of dataset (i.e., Resizing the data to a specific dimension and converting the dataset to grayscale channel if dataset contains data of different color channel).
Acquisition of Dataset
The dataset used for this study consist of 10.5K (10,500) images with class: Abdomen CT, Breast MRI, Chest CT, CXR, Hand and Head CT. The information below represents the metadata of the dataset used for the study.
Dataset Source:
https://www.kaggle.com/datasets/andrewmvd/medical-mnist?resource=download
Dataset Name: MNIST Medical Dataset
Dataset License: Public Domain.
A ratio of 30:70 is used in grouping the dataset into test data items (Test Folder) and a Data repository Folder. A total of 525 images from each class is put together in the Test Folder whiles 1225 images from each class is put together in the Data repository folder. This data repository folder becomes our database. Below represents sample image of each class of the dataset.
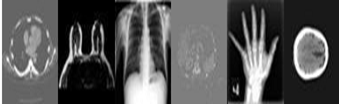
Figure 2: Dataset Sample Class: Abdomen CT, Breast MRI, Chest CT, CXR, Hand and Head CT.
Dataset Uniformity
Python libraries such as "PIL" and cv2 contain functions for resizing images to a preferred dimension. Notwithstanding, the cv2 library also supports the conversion of image color between channels such as RGB, Grayscale, HSV, and Hue.
Similarity Measurement and Threshold Values
The similarity measurement is same as the feature matching or comparing both features from the query image and that of individual images from the database for some sort of similarities. This stage is as important as feature selection because the wrong choice of similarity measurement may yield poor results as of selecting a wrong feature for the retrieval process. The point where each algorithm is to decide which image to retrieve as the target image is when the threshold value provided is satisfied. Predicting a class label has always been the main aim for classification predictive modelling. It therefore means that before such model is able to map to a crisp class label, the machine algorithm has to sort to predict a probabilistic scoring of a class membership. It is as identifying the best threshold for mapping.
According to [39] a threshold value of 0.5 can serve as a mapping scheme where all values equal or greater than the threshold are mapped to one class and all other values are mapped to another class. He further stated that this default value (0.5) can create a severe classification problem which can result in poor performance using an imbalanced dataset. He suggested that either the researcher manually tunes the threshold value to an optimal value or sort to use the Receiver Operating Characteristic (ROC) curve and the Precision-Recall Curves. Therefore, in order not to be bias, the least measurement value plus 5 is provided as the threshold value to all the algorithms. The measurement model for each of the techniques together with their threshold value is illustrated in the table below:
Table 1: Method, Measurement Model and their Threshold Values.
| Method/Techniques | Similarity Measurement | Threshold values |
| LBP | Euclidean Distance Measure | Least distance + 5 |
| Gabor Filter | Chi-Squared | Least distance + 5 |
| Gray-Level Co-occurrence Matrix | Euclidean Distance Measure | Least distance + 5 |
| Haralick Descriptor | Euclidean Distance Measure | Least distance + 5 |
| Fast | Euclidean Distance Measure | Least distance + 5 |
| Proposed Method | Euclidean Distance Measure | Least distance + 5 |
An online version of this study is created using flask as the rendering platform for the online pages supporting html5, css, bootstrap, jQuery languages for the frontend and python for both front and the backend. This online system is a free live version and therefore is limited with certain resources such as space. Therefore, the dataset used for the online system is 360 images which is at least higher than [6] who used 100 images for their study. The uniform resource locator (URL) for this online system is:
https://samuelkusiduah.pythonanywhere.com/
It works more efficiently with images of purely grayscale preferably from Kaggle.
Results and Analysis
The following includes the metrics for measuring the performance for the various techniques identified in this study; Precision, Recall, F1-Score, Mean Squared Error, Accuracy and Time. The reason behind the selection of the above metrics is due to the imbalance nature of our dataset. That is, the dataset consisting of 6 different class of images or data. More specifically the precision and recall are as a result of the concept of what is known as the Confusion matrix. A confusion matrix conforms to the standard of representing the performance of a typical supervised learning algorithm. It is also known as Matching Matrix for an unsupervised learning algorithm.
With regards to the time, there are two metrics with respect to the measurement of execution time of a process. They are the Wall Execution Time and CPU Execution Time. The Wall Execution Time refers to the total time elapsed during the measurement which includes the waiting time for needed resources by the given process whiles the CPU Execution Time refers to the time the CPU begins processing of a given program till it finishes which excludes waiting time for the needed resources by the said process. The resulting time recorded in this research used the Wall Execution Time. Both times are executed using the code snippet:
elapsed = time. time ()-start time
result = timeit.timeit (stmt='run_lbp()', globals=globals(), number=1). print ('CPU Execution time:', time.strftime ("%H:%M:%S", time.gmtime (elapsed))). print ('WALL Execution time:', time.strftime ("%H:%M:%S", time.gmtime (result))).
The results recorded below were taken from the output of the algorithms. Each algorithm is run at a time using the various class of the dataset. In order to achieve a summative result per metric, the average is computed using the basic arithmetic formula:
Equation 1: Average Score
Therefore, for each algorithmic results, there will be a record for each class of the dataset as illustrated below:
Table 2: Results from Proposed Technique/Method.
| Proposed Technique | |||||||
| Abdomen CT | Breast MRI | Chest | CXR | Hand | Head CT | Average | |
| Precision | 1 | 1 | 1 | 1 | 1 | 1 | 1.00 |
| Recall | 0.001 | 0.001 | 0.001 | 0.005 | 0.001 | 0.091 | 0.02 |
| F1-score | 0.002 | 0.002 | 0.002 | 0.001 | 0.002 | 0.166 | 0.03 |
| MSE | 0.167 | 0.167 | 0.167 | 0.166 | 0.167 | 0.152 | 0.16 |
| Accuracy | 0.833 | 0.833 | 0.833 | 0.834 | 0.833 | 0.848 | 0.84 |
| Wall Execution Time/s | 0:22 | 0:21 | 0:22 | 0:21 | 0:21 | 0:23 | 0:21 |
Table 3: Results from LBP.
| Local Binary Pattern-Lbp | |||||||
| Abdomen CT | Breast MRI | Chest | CXR | Hand | Head CT | Average | |
| Precision | 0.167 | 0.167 | 0.167 | 0.167 | 0.167 | 0.167 | 0.17 |
| Recall | 1 | 1 | 1 | 1 | 0.999 | 1 | 1.00 |
| F1-score | 0.286 | 0.286 | 0.286 | 0.286 | 0.286 | 0.286 | 0.29 |
| MSE | 0.833 | 0.833 | 0.833 | 0.833 | 0.833 | 0.833 | 0.83 |
| Accuracy | 0.167 | 0.167 | 0.167 | 0.167 | 0.167 | 0.167 | 0.17 |
| Wall Execution Time/s | 3:00 | 2:54 | 2:51 | 2:52 | 2:52 | 2:56 | 2:54 |
Table 4: Results from GLCM.
| Gray-Level Co-Occurrence Matrix - Glcm | |||||||
| Abdomen CT | Breast MRI | Chest | CXR | Hand | Head CT | Average | |
| Precision | 1 | 0.786 | 0.451 | 0.793 | 0.417 | 0.54 | 0.66 |
| Recall | 0.004 | 0.066 | 0.99 | 0.109 | 0.931 | 0.17 | 0.38 |
| F1-score | 0.008 | 0.122 | 0.62 | 0.192 | 0.576 | 0.258 | 0.30 |
| MSE | 0.166 | 0.159 | 0.203 | 0.153 | 0.229 | 0.162 | 0.18 |
| Accuracy | 0.834 | 0.841 | 0.797 | 0.847 | 0.771 | 0.838 | 0.82 |
| Wall Execution Time/s | 9:45 | 9:26 | 10:40 | 9:39 | 10:59 | 9:46 | 10:02 |
Table 5: Results from Gabor filter.
| Gabor Filter | |||||||
| Abdomen CT | Breast MRI | Chest | CXR | Hand | Head CT | Average | |
| Precision | 1 | 0 | 1 | 1 | 0 | 0 | 0.50 |
| Recall | 0.041 | 0 | 0.041 | 0.041 | 0 | 0 | 0.02 |
| F1-score | 0.078 | 0 | 0.078 | 0.078 | 0 | 0 | 0.04 |
| MSE | 0.16 | 0.173 | 0.16 | 0.16 | 0.173 | 0.173 | 0.17 |
| Accuracy | 0.84 | 0.827 | 0.84 | 0.84 | 0.827 | 0.827 | 0.83 |
| Wall Execution Time/s | 0:04 | 0:04 | 0:03 | 0:04 | 0:04 | 0:04 | 0:03 |
Table 6: Results from Haralick Descriptor.
| Haralick Descriptor | |||||||
| Abdomen CT | Breast MRI | Chest | CXR | Hand | Head CT | Average | |
| Precision | 0.168 | 0.168 | 0.165 | 0.168 | 0.166 | 0.166 | 0.17 |
| Recall | 1 | 1 | 0.986 | 1 | 0.989 | 0.989 | 0.99 |
| F1-score | 0.287 | 0.287 | 0.283 | 0.287 | 0.284 | 0.284 | 0.29 |
| MSE | 0.828 | 0.827 | 0.834 | 0.828 | 0.833 | 0.831 | 0.83 |
| Accuracy | 0.172 | 0.173 | 0.166 | 0.172 | 0.167 | 0.169 | 0.17 |
| Wall Execution Time/s | 2:53 | 2:46 | 2:45 | 2:44 | 2:44 | 2:43 | 2:45 |
Table 7: Results from FAST.
| Features From Accelerated Segment Test - Fast | |||||||
| Abdomen CT | Breast MRI | Chest | CXR | Hand | Head CT | Average | |
| Precision | 1 | 0 | 0 | 1 | 0.115 | 1 | 0.52 |
| Recall | 0.023 | 0 | 0 | 0.001 | 0.002 | 0.04 | 0.01 |
| F1-score | 0.045 | 0 | 0 | 0.015 | 0.005 | 0.077 | 0.02 |
| MSE | 0.163 | 0.167 | 0.173 | 0.165 | 0.169 | 0.16 | 0.17 |
| Accuracy | 0.837 | 0.833 | 0.827 | 0.835 | 0.831 | 0.84 | 0.83 |
| Wall Execution Time/s | 0:00 | 0:00 | 0:00 | 0:00 | 0:00 | 0:01 | 0:00 |
Table 8: Overall Average Score.
| Overall Average Score | ||||||
| Proposed Technique | LBP | GLCM | Gabor Filter | Haralick | FAST | |
| Precision | 1.00 | 0.17 | 0.66 | 0.50 | 0.17 | 0.52 |
| Recall | 0.02 | 1.00 | 0.38 | 0.02 | 0.99 | 0.01 |
| F1-score | 0.03 | 0.29 | 0.30 | 0.04 | 0.29 | 0.02 |
| MSE | 0.16 | 0.83 | 0.18 | 0.17 | 0.83 | 0.17 |
| Accuracy | 0.84 | 0.17 | 0.82 | 0.83 | 0.17 | 0.83 |
| Wall Execution Time/s | 0:21 | 2:54 | 10:02 | 0:03 | 2:45 | 0:00 |
The chart below represents the results from Table 8.
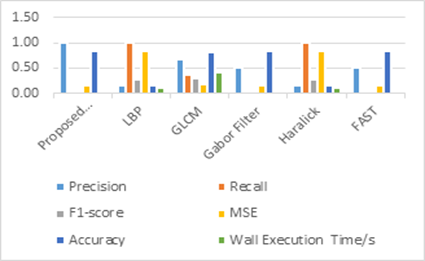
Figure 3: Graphical Representation of the Overall Average Score
Analysis
From figure 3, it is observed that the proposed technique had 100% precision score which confirms [40] assertion that if the focus is to minimize false positives, since the needs of every healthcare facility is to minimize falsehood or false predictions in order to minimize deaths. The algorithm took lesser time to execute using a dataset of 10.5k which makes a good impression. LBP and Haralick illustrates low precision, this does not entirely mean that these models are poor but they rather predicted all the true positives which was excellent together with most of the false positives thinking it is part of the true positives. They rather performed better in terms of minimizing false negatives thus increasing recall. GLCM and Gabor performed appreciably well in almost all areas except for time where GLCM performed poorly and Gabor had second to low recall count to the proposed method. FAST performed best in terms of execution time. It somewhat did fine in precision. The chart below represents the precision score from the overall outcome for each algorithm.
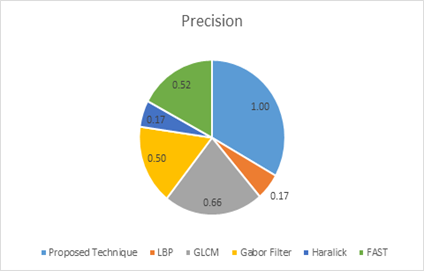
Figure 4: Graphical Representation of Precision Scores.
Conclusion & Recommendation
According to [41] and [42] asserts that the use of images tends to be related to the “role” of the user such as being a clinician, educator or a researcher. Therefore, it is important to understand user needs as well as provide a system that meet those needs. According to [35, 36] though content-based image retrieval system had already been passed into PACS, the problem still remains an efficient and robust medical image retrieval technique. From the results taken, it is observed that the proposed technique or method is efficient but cannot say for its robustness since the dataset tested against is of only 6 classes. It cannot be said that the proposed technique is not robust also because, from the live system, the proposed method is able to retrieve correctly target images as the input image downloaded from google which is of different version of what was used during the offline retrieval process.
Recommendation
One can boast of both efficiency and robustness for the proposed technique if an efficient relevance feedback of some sort is added to it. Generally, focus should also be placed on the best or finding a generic standard threshold value for all CBIR or CBMIR systems.
Summary
The study compares the performance of the six selected texture feature extraction techniques on the medical dataset. Specifically, the performance metrics we are comparing are on the basis of Precision, Recall, F1-Score, Mean Squared Error, Accuracy, and Time.
The Dataset used is of raw medical image data, therefore there isn't much to do with dealing with outliers and the rest as if the dataset were in the form of an excel file but we rather catered for having a uniform dimension for the image data. Each Technique had its own way of transforming or using the extracted features or reducing the dimensionality of the extracted features. There were a few cases where we encountered a (Not a Number) NaN value for the most apparent dark image(s).
The techniques identified in this study did well as well as having their strength and weaknesses. Though they were run separately but each algorithm was executed in same favorable conditions such as during the execution for each algorithm, the researcher made sure no other user programs were running alongside the execution of the algorithmic process. This is to ensure fair share of system resources, hence no bias in the time recording.
Disclosure
- The Authors declare No conflicts of interest, financial or otherwise for this research.
- The authors declare that they have no known competing financial interests or personal relationships that could have appeared to influence the work reported in this paper.
- The authors declare the following financial interests/personal relationships which may be considered as potential competing interests:
Acknowledgement
First of all, I will like to use this opportunity to thank the Almighty God, the creator of the universe for giving me the strength and ability to accomplish this task. I will like to also express my profound gratitude to my supervisor–Dr. Obed Appiah and Co-Supervisor–Dr. Peter Appiahene (HoD Computer Science) for their immense contribution towards the completion of this study. I truly appreciate the time and guidelines they offered towards achieving a successful novel project. I say God bless them.
References
- C. H. Wei, Y. Li and P. J. Huang. (2011). Mammogram retrieval through machine learning within BI-RADS standards. Journal of biomedical informatics., 607-614.
Publisher | Google Scholor - S. A. Lashari, R. Ibrahim, N. Senan, I. T. R. Yanto and T. Herawan. (2016). Application of Wavelet De-noising Filters in Mammogram Images Classification Using Fuzzy Soft Set. In International Conference on Soft Computing and Data Mining.
Publisher | Google Scholor - S. F. Da Silva, M. X. Ribeiro, J. D. E. B. Neto, C. Traina-Jr and A. J. Traina. (2011). Improving the ranking quality of medical image retrieval using a genetic feature selection method., Decision Support Systems, 810-820.
Publisher | Google Scholor - B. Zhang. (2009). Computer-aided diagnosis in mammography using content-based image retrieval approaches: current status and future perspectives. Algorithms, 828-849.
Publisher | Google Scholor - M. Z. Nor Asma, Y. Rozianiwati, A. L. Saima, M. Aida, S. Norhalina and I. Rosziati. (2018). Content-Based Image Retrieval in Medical Domain: A Review. Journal of Physics: Conference Series, 13.
Publisher | Google Scholor - C. F. Joaquim, J. M. T. Agma and T. J. Caetano. (2003). Retrieval by Content of Medical Images Using Texture for Tissue Identification. Proceedings of the 16th IEEE Symposium on Comuter-Based Medical Systems (CBMS '03).
Publisher | Google Scholor - G. Nagarajan, R. I. Minu, B. Muthukumar, V. Vedanarayanan and S. D. Sundarsingh. (2016). Hybrid Genetic Algorithm for Medical Image Feature Extraction and Selection. International Conference on Computational Modeling and Security (CMS 2016).
Publisher | Google Scholor - X. Sun, N. Zhang, H. Wu, X. Yu, X. Wu and S. Yu. (2018). Medical Image Retrieval Approach by Texture Features Fusion Based on Hausdorff Distance. Hindawi: Mathematical Problems in Engineering, 12.
Publisher | Google Scholor - K. Belattar, S. Mostefai and A. Draa. (2017). Intelligent Content-Based Dermoscopic Image Retrieval with Relevance Feedback for Computer-Aided Melanoma Diagnosis. Journal of Information Technology Research (JITR), 85-108.
Publisher | Google Scholor - C. B. Akgul, D. L. Rubin, S. Napel, C. F. Beaulieu, H. Greenspan and B. Acar. (2011). Content-based image retrieval in radiology: current status and future directions. Journal of Digital Imaging, 208-222.
Publisher | Google Scholor - K. Bunte, M. Biehl, M. F. Jonkman and N. Petkov. (2011). Learning effective color features for content-based image retrieval in dermatology. Pattern Recognition, 1892-1902.
Publisher | Google Scholor - S. Amita, R. Amol and P. Chetankumar. (2019). Content based medical image retrieval based on new efficient local neighbourhood wavelet feature descriptor. Biomedical Engineering Letters, 8.
Publisher | Google Scholor - Y. Liu, D. Zhang, G. Lu and W. Y. Ma. (2007). A Survey of content-based image retrieval with high-level semantics. Pattern Recognition, pp. 262-282.
Publisher | Google Scholor - K. Jenni, S. Mandala and M. S. Sunar. (2015). Content based image retrieval using colour strings comparison. Procedia Computer Science, 374-379.
Publisher | Google Scholor - F. All and A. Hashem. (2020). Content Based Image Retrieval (CBIR) by statistical methods. Baghdad Science Journal, 694.
Publisher | Google Scholor - C. Bal, J. Chen, L. Huang, K. Kpalma and S. Chen. (2018). Sallency-based multi-feature modelling for semantic image retrieval. Journal of Visual Communication and Image Representation, 199-204.
Publisher | Google Scholor - N. Shrivastava and V. Tyagi. (2017). Corrigendum to Content based Image retrieval based on relative locations of multiple regions of interest using selective regions matching., [Information Sciences 259 (2014) 212-224] Information Sciences, 421:273.
Publisher | Google Scholor - Z. Dengsheng, L. Guojun and L. Ying. (2008). Region-based image retrieval with high-level semantics using decision tree learning. Pattern Recognition, 41(8):2554-2570.
Publisher | Google Scholor - Z. Dengsheng, M. I. Md, L. Guojun and H. Jin. (2009). Semantic image retrieval using region based inverted file. In Proceedings of the 2009 Digital Image Computing: techniques and Applications, Washington DC, USA.
Publisher | Google Scholor - K. Alex, S. Ilya and E. H. Geoffery. (2012). Imagenet classification with deep convolutional neural networks. In Advances in neural information processing systems, 1097-1105.
Publisher | Google Scholor - D. P. Tian. (2013). A review on Image feature extraction and representation techniques. International Journal Multimedia Ubiquitous Engineering, 385-395.
Publisher | Google Scholor - B. S. Manjunath, J.-R. Ohm, V. V. Vasudevan and A. Yamada. (2001). Color and Texture descriptors. IEEE Transactions on circuits and systems for video technology, 703-715.
Publisher | Google Scholor - R. M. Hawlick. (2017). Statistical and Structural Approaches to Texture. Advances in Intelligent Systems and Computing, 459(5):1-644.
Publisher | Google Scholor - E. Rosten and T. Drummond. (2006). Machine learning for high-speed corner detection. in 9th European Conference on Computer Vision, 1.
Publisher | Google Scholor - H. M. Robert, K. Shanmugam and I. Distein. (1973). Textural Features for Image Classification. IEEE Transactions on Systems, MAN and Cybernetics, 610-621.
Publisher | Google Scholor - T. Ojala, M. Pietikainen and T. Maenpaa. (2002). Multiresolution gray-scale and rotation invariant texture classification with local binary patterns., IEEE Transactions on Pattern Analysis and Machine Intelligence, 24(7):971-987.
Publisher | Google Scholor - G. R. Cross and A. K. Jain. (1983). Markov random field texture models. IEEE Transactions on Pattern Analysis and machine Intelligence, PAMI-5(1):25-39.
Publisher | Google Scholor - C. S. W. Won, D. K. P. Park and S.-J. P. (2002). Park Efficient use of MPEG-7 edge histogram descriptor. ETRI Journal, 24(1):23-30.
Publisher | Google Scholor - L. Piras and G. Glacinto. (2017). Information fusion in content-based image retrieval: A Comprehensive overview. Information Fusion, 37:50-60.
Publisher | Google Scholor - D. Zhong, M. M. Islam and G. Lu. (2012). A review on automatic Image annotation techniques. Pattern Recognition, 45(11):346-362.
Publisher | Google Scholor - J. Z. Wong, J. Li and G. Wlederholdy. (2000). Simplicity: Semantics-sensitive Integrated Matching for picture libraries. Lecture Notes in Artificial Intelligence and Lecture Notes in BioInformatics, 360-371.
Publisher | Google Scholor - H. P. Chan, C. Vyborny, R. A. (1990). Schmidt and e. al., Improvements in radiologists’ detection of clustered microcalcifications on mammograms., Invest. Radiol., 25:1102-1110.
Publisher | Google Scholor - F. Pinciroli and g. Pozzi. (1995). ARCADIA: a system for the integration of Angiographic Data and images by Object-Oriented DBMS, Computer and Biomedical Research vol. 28:5-23.
Publisher | Google Scholor - H. MacMahon, H.-P. Chan and a. et. (1990). Computer-aided diagnosis in chest radiology. J. Thoracic Imaging vol. 5:67-74.
Publisher | Google Scholor - E. El-Kwae, H. Xu and M. Kabuka. (2000). Content-based retrieval in picture archiving and communication systems. j Digit Imaging, 13:70-81.
Publisher | Google Scholor - H. Qi and W. Snyder. (1999). Content-based image retrieval in picture archiving and communications systems. J Digit Imaging, 12: 81-83.
Publisher | Google Scholor - (2021). Lidia, Time Complexity.
Publisher | Google Scholor - D. Waller. (2022). how to develop graphical framework chart your research.
Publisher | Google Scholor - J. Brownlee. (2020). Machine Learning Mastery.
Publisher | Google Scholor - S. Jaiswal. (2021). performance metrics in machine learning.
Publisher | Google Scholor - W. R. Hersh and a. et. (2005). A qualitative task analysis of biomedical image use and retrieval. In: MUSCLE/ImageCLEF Workshop on Image and Video Retrieval Evaluation., Vienna, Austria.
Publisher | Google Scholor - H. Müller and e. al. (2006). Health care professionals' image use and search behaviour, in: Proceedings of Medical Informatics, Maastricht, The Netherlands.
Publisher | Google Scholor