
Research Article
A Correlational Predictive Study of Core Self-Evaluations, Grit, and Success Expectancy
Grand Canyon University, Phoenix, United States.
*Corresponding Author: Crystal Maria Scott Grand Canyon University, Phoenix, United States.
Citation: Crystal M Scott. (2024). A Correlational Predictive Study of Core Self-Evaluations, Grit, and Success Expectancy. Journal of Clinical Psychology and Mental Health, BioRes Scientia Publishers. 3(4), 1-24. DOI: 10.59657/2993-0227.brs.24.033
Copyright: © 2024 Crystal Maria scott, this is an open-access article distributed under the terms of the Creative Commons Attribution License, which permits unrestricted use, distribution, and reproduction in any medium, provided the original author and source are credited.
Received: March 17, 2024 | Accepted: April 10, 2024 | Published: September 10, 2024
Abstract
This quantitative correlational predictive study aims to determine if and to what extent core self-evaluations (CSE), grit, and age, combined and individually predict generalized expectancy for success (GES) in adults ages 18-65 in the United States. The sample size was 115. The theoretical foundation was the CSE Theory and the Grit Model. The instruments used for the study were CSE, Grit-S, and GESS-R Scales. The Grit-S and GESS-R had a high level of reliability with Cronbach’s alpha of .72 and .89, respectively. CSE showed a Cronbach’s alpha of .68. Multiple linear regression analysis was performed to measure the predictive relationship between CSE, grit, and age combined and individually, and generalized expectancy for success (GES). The results for CSE, grit, and age combined showed statistically significant results F(3,111) = 27.56, p < .001, CSE showed a direct predictive relationship with GES (ß = .404, t = 4.940, p < .001), and grit showed an inverse predictive relationship with GES (β = -.360, t = -4.366, p < .001). The relationship was negative because GES decreased as grit increased. Age did not show statistically significant results (ß = -.063, t = -.866, p = .388), and the null hypothesis was maintained. The results of this study contribute to the literature on CSE, grit, and generalized expectancy for success.
Keywords: core self-evaluations; grit; generalized expectancy for success; non-cognitive factors; success
Introduction
Core self-evaluation (CSE) refers to the fundamental ways individuals think about themselves. CSE includes individuals’ self-worth, general self-efficacy, ability to manage emotions, and locus of control, which researchers maintain contributes to success [Usman et al., 2021]. Duckworth et al. [2019] argued that grit contributes to success when individuals have passion for goals and work on their goals over a long time. Bowman [2015] found that grit might have an impact on academic success. Both CSE and grit are non-cognitive factors identified in the literature as important to success. If grit is the vehicle that gets individuals to succeed in their goals, CSE is the fuel. Research maintains that CSE is also important to overall well-being. However, most CSE and grit research has focused on education and business. Also, most CSE and grit research has focused on tangible success and not on a generalized expectancy for success. Research also suggests that issues in education [Duckworth & Quinn, 2009] and the workforce [Judge et al., 1998] are long-studied common concerns which demonstrates a need to further study CSE and grit together with a generalized expectancy for success. This correlational predictive study is designed to examine the relationship between CSE and grit, and to determine if CSE, grit, and age predict generalized expectancy for success in adults ages 18-65 in the United States. Studying a broad age range addresses the concern in the literature that a diverse population in terms of age should be included [Kim et al., 2021; Rhodes & Giovannetti, 2021]. Also, studying generalized expectancy for success is needed because research has focused on specific areas rather than general expectancy for success in general life experiences.
Research has shown that core self-evaluations [CSE] and grit are long-studied concepts. These concepts are non-cognitive factors, and researchers maintain they predict success in goal attainment and address the issues of education attrition [Kamer & Ishitani, 2021], employee high turnover rates [Booth et al., 2020; Jeong et al., 2019], and overall well-being [Datu et al., 2022]. Success in goal attainment begins with an expectancy of success and success expectancy is fueled by a belief in one’s abilities. Doubt in one’s abilities is antithetical to a mindset of success expectancy [Muenk et al., 2018]. When individuals doubt, they are less likely to hold a core belief in their ability to succeed, and consequently, have a greater likelihood of experiencing challenges in the areas of CSE [Bandura, 1993]. Much of the debate in the literature concerning CSE and grit has revolved around these variables as predictors of success. However, measuring success is different from measuring the generalized expectancy for success. The generalized expectancy for success has not been sufficiently studied in relation to the CSE and grit non-cognitive factors to determine if CSE and grit predict the generalized expectancy for success. The review of the literature has focused on achieving success in physical ability [Duckworth et al., 2019], spelling bee competitions [Duckworth et al., 2011], thriving in academics during the pandemic [Montano, 2021], and workplace thriving [Usman et al., 2021]. Therefore, there is a need to examine the relationship between CSE and grit and determine if they predict generalized expectancy for success.
Empirical studies have shown a need for future research about CSE and grit and success. Across six studies, gritty individuals showed more progress than less gritty individuals [Duckworth & Quinn, 2009]. The claim from those who study grit is that individuals who never give up demonstrate grit and are successful [Duckworth et al., 2011]. Montano [2021] conducted a study of students thriving during the pandemic and found that students who thrive and experience academic success possessed grit. Other research suggested that grit is not a better predictor of success [Usher et al., 2019]. Scelfo [2016], as cited in Credé [2018], maintained that grit is a better predictor of success than other factors. Credé [2018] posited that innate qualities and skills other than grit should be studied to address opposing views and determine what factors predict the generalized expectancy for success. Although grit has been identified as a factor in success, some researchers maintain that grit is not enough [Bonfiglio, 2017; Kannangara et al., 2018]. Grit researchers have recommended studying grit along with other factors [Duckworth et al., 2019; Montano, 2021]. Because human experiences related to success are variegated, this proposed research study is not only important to academicians and educational institutions [Montano, 2021] and professionals, and the workforce [Fabelico & Afalla, 2020] to address education attrition [Kamer & Ishitani, 2021] and employee turnover rates [Booth et al., 2020], as commonly studied in previous research. This study is also important to policies, decision-makers, and other professionals in providing resources, better serving individuals, and addressing societal issues in a variety of human experiences in which individuals seek success. This proposed study’s results can also contribute to continued quantitative studies and underpin qualitative studies on this topic.
Research Questions
RQ1: If and to what extent do CSE, grit, and age combined, predict generalized expectancy for success in adults ages 18-65 in the United States?
H01: CSE, grit, and age combined do not predict generalized expectancy for success in adults ages 18-65.
H1a: CSE, grit, and age combined do not predict generalized expectancy for success in adults ages 18-65.
RQ2: If and to what extent does CSE predict generalized expectancy for success while controlling for grit and age in adults ages 18-65 in the United States?
H02: CSE does not predict generalized expectancy for success while controlling for grit and age in adults ages 18-65.
H2a: CSE does predict generalized expectancy for success while controlling for grit and age in adults ages 18-65.
RQ3: If and to what extent does grit predict generalized expectancy for success while controlling for CSE and age in adults ages 18-65 in the United States?
H03: Grit does not significantly predict grit and generalized expectancy for success while controlling for CSE and age in adults ages 18-65.
H3a: Grit does significantly predict generalized expectancy for success while controlling for CSE and age in adults ages 18-65.
RQ4: If and to what extent does age predict generalized expectancy for success while controlling for CSE and grit in adults ages 18-65 in the United States?
H04: Age does not significantly predict generalized expectancy for success while controlling for CSE and grit in adults ages 18-65.
H4a: Age does significantly predict generalized expectancy for success while controlling for CSE and grit in adults ages 18-65.
Literature Review
This section focuses on a review of the literature concerning non-cognitive factors of CSE and grit, and success factors in goal attainment. The literature review examines the origin of CSE and grit and discusses these variables as commonly studied to address issues of academic attrition, workplace high turnover rates, and success in goal attainment. Themes that have emerged from the literature include success in goal attainment, and other non-cognitive factors such as the five-factor model of personality, motivation, and mindset. The literature review also focuses on CSE and grit in education, sports, the workforce, and well-being. Finally, the literature review process provides a basis for examining CSE, grit, and success expectancy in goal attainment. The literature review also identifies the problem space and illustrates how this study can advance scientific knowledge on this topic.
Success and Goal Attainment
Goals are inevitable in life. Much of human functioning and behavior is goal-oriented [Locke & Latham, 2013]. From the beginning stages of psychosocial development to the end of life, there is always a crisis to master for healthy development [Erikson, 1994], which equates to goal attainment. Success in goal attainment is relevant in various areas of life [Colomeischi, 2015; Kim et al., 2019]. In the literature, the issue of success in goal attainment is associated with education attrition [Kamer & Ishitani, 2021] and workplace turnover rates [Peltokorpi & Michel, 2021]. Though historically most of the literature has focused on non-cognitive factors and success in academics and business, recent research includes other factors such as well-being [Dóci et al. 2021] and overall quality of life [Kim & Lee, 2022], and indicates the significance of CSE and grit in success. Goals require persistence and effort. Long-term goals such as excelling in academics and the workplace require work and grit over periods of time [Duckworth et al., 2007]. Identification of resources needed to accomplish goals is required [Atad & Grant, 2021]. In goal attainment, individuals consider the cost of the commitment and what will be required such as passion, perseverance, and consistency over periods of time [Duckworth et al., 2019]. Individuals also need self-belief and confidence that regardless of how much work and how much time is needed, they will achieve their desired set goal [Bandura, 1993], this describes locus of control, which involves individuals’ thoughts about their role in how their behaviors are guided [Muenks et al., 2018]. This means that individuals who believe in their locus of control, believe their decisions and behaviors are part and parcel of the process and successful outcome, and they are not leaving their experience and results to chance. Finally, deliberate action, according to Duckworth, is key to goal attainment. Individuals in a spelling bee study who performed well and were successful did so because of deliberate action, which involved a plan of how much practice was needed over a course of time to improve at spelling [Duckworth et al., 2011]. The results of this spelling bee study also showed the role of consistency in goal attainment. Deliberate practice also validates the grit variable component of perseverance of effort in the success of goal attainment.
Non-Cognitive Factors and Success
Non-cognitive factors are individuals’ socially determined attitudes and behaviors. They include individuals’ mindset, learning strategies, social and behavioral skills, and ability to persevere for performance and success [Duckworth et al., 2019]. Researchers identify non-cognitive factors such as grit and passion [Duckworth & Quinn, 2009], general self-efficacy and motivation just to name a few [Schunk, 1991]. As well, non-cognitive measurements include academic skills [Montano, 2021], workplace performance [Usman et al., 2021], and persistence in effort [Duckworth et al., 2019]. Non-cognitive factors such as grit have been shown to predict meaningfulness and happiness through task engagement in participants who were gritty [Von Culin et al., 2014]. It was identified from the research literature that grit is positively associated with well-being and beneficial to relationship building in a study of medical students and is conducive to increased effort to achieve professional goals as a physician beyond academics [Isenberg et al., 2020]. This is important because Weisskirch [2019] recommended consideration for various aspects of life experiences individuals face throughout development.
With extensive research conducted on this topic that confirms the validity of noncognitive factors in the success of goal attainment, debate still exists relative to the role and distinction of certain cognitive skills and non-cognitive factors. Therefore, it is important to distinguish between cognitive and non-cognitive factors. Cognitive factors engage cognitive skills and functioning. Cognitive factors include conscious intellect, thinking, reasoning, and memory [Duckworth et al., 2019]. On the other hand, non-cognitive factors, which are also considered soft skills, are personality qualities such as motivation, grit, passion, and general self-efficacy [Smedema et al., 2022] just to name a few. Research maintains that non-cognitive skills enhance cognitive development [Smithers et al., 2018]. That is, employing non-cognitive skills promotes the development of cognitive ability.
Though non-cognitive factors have been shown to predict success, Anderson et al. [2016] maintained that results between non-cognitive factors, such as grit and self-control, vary at the individual student level versus the school level in academic studies, which places individuals at a disadvantage when grit alone is used to determine success in goal attainment.
CSE Components [Self-Esteem, General Self-Efficacy, Neuroticism, Locus of Control]: CSE is comprised of four personality dimensions. The components of CSE are self-esteem, self-efficacy, neuroticism, and locus of control [Erez & Judge, 2001]. These components have been studied together and separately in the context of success and goal attainment.
Self-esteem. Self-esteem is identified as the extent to which individuals perceive themselves as capable, significant, and worthy [Judge et al., 2003]. Self-esteem is one of the most essential parts of CSE because it identifies the overall fundamental value individuals place on themselves as human beings [Judge, 2009]. Self-esteem is also indicative of how productive individuals perceive themselves [Schmitt & Allik, 2005]. Low self-esteem can affect how individuals perform [Arabmomeni, 2020]. If they make mistakes and believe that they look bad for making a mistake, these individuals might devalue themselves and are more likely to suffer in their performance and experience a perpetual cycle of frustration.
General Self-efficacy. The concept of general self-efficacy has been long-studied in research [Judge, 2009]. General self-efficacy is a general belief that one holds about the ability to problem-solve and obtain goals [Usher et al., 2019]. According to Luszczynska et al. [2005], general self-efficacy is related to a broad range of experiences. Luszczynska and colleagues maintained that general self-efficacy is a domain-general construct. That is, general self-efficacy is a universal construct in a variety of domains in human functioning. General self-efficacy is the ability to demonstrate self-regulation and manage motivation and behavior across a span of experiences [Bandura, 1993]. Judge et al. [1997] identified that general self-efficacy is a component of CSE that is associated with goal setting, motivation, and performance, and is involved in how individuals appraise self, others, and events [Erez & Judge, 2001].
Neuroticism. Studying factors together such as grit and neuroticism revealed compelling results in the literature. Vazsonyi et al. [2019] conducted a grit study and compared grit items to neuroticism. The researchers uncovered that the grit component of consistency of interest was a better fit with conscientiousness and perseverance of effort was a better fit for predicting success. Neuroticism is the ability to manage emotions and is critical to CSE. According to Piepiora and Piepiora [2021], individuals with low neuroticism show emotional stability in challenging situations. Conversely, emotionally unstable individuals are more likely to react rather than respond to situations that evoke unpleasant emotions [Klein & Robinson, 2019]. When individuals become stressed by unpleasant emotions, they adopt a very negative attitude and their thinking becomes clouded. Consequently, their judgment or ability to make sound judgments becomes impaired and they are unable to make effective decisions [Farfán et al., 2020]. In this process, individuals with low emotional intelligence experience high neuroticism. Because they are prone to low emotional intelligence, Piepiora and Piepiora [2021] claimed such individuals are less stable and far more prone to other challenging emotions such as anxiety, depression, and despair.
Locus of control. Success is derived from a locus of control. There are two kinds of control factors: internal and external [Johnson et al., 2016]. Individuals who believe they are the source of their success are those who possess an internal locus of control, and an external locus of control suggests that individuals believe factors outside of their control determine success. Sciarra and Whitson [2007] found that the internal locus of control is a predictor of school performance and successful outcomes. Individuals with an internal locus of control believe they have control over their futures and so they are more likely to be satisfied with their work and generally perform better and succeed [Al Mulhim, 2021]. According to Al Mulhim [2021], external locus of control is experienced by those who believe in fate or destiny and such individuals are less likely to believe in their self-efficacy.
Grit and Goal Attainment
Over the past decade, grit has been identified as an important factor in success. Angela Duckworth maintained that gritty individuals demonstrate passion, perseverance, and consistency over long periods of time for success [Duckworth et al., 2007]. This means that gritty individuals are more likely to consistently work toward their goals to completion, regardless of challenges along the way [Duckworth & Quinn, 2009]. In this study of cadets at the U.S. Military Academy, Duckworth and Quinn [2009] found that gritter participants performed better in spelling because they had practiced, over-spelling more than participants who did not do as well. Previous research studies have shown a relationship between grit and success. Robertson-Kraft and Duckworth [2014] conducted a study on novice teachers’ retention rate and discovered that teachers possessing more grit were more likely to persevere in their teaching and demonstrate effectiveness in their role compared to less gritty teachers. Further, researchers maintained that grittier individuals practice more and perform better than those who do not. Duckworth et al. [2011] found that increasing deliberate practice incrementally, by 2
Theoretical Framework

Ideologies, philosophies, and beliefs are developed over time; individuals are not born with them. They are established and shaped throughout life in individuals’ respective learning environments [Bandura, 1993]. Since the beginning of scientific psychology, psychologists have been interested in the issues of self-concepts [Judge, 2009]. Judge et al. [2001] maintained that self-beliefs are CSE and they include self-esteem, general self-efficacy, neuroticism, and locus of control [Erez & Judge, 2001]. This theory was established more than twenty years ago and has been influential in the study of the overall quality of life including academics and workplace success [Montano, 2021]. From CSE Theory Judge and colleagues created the CSE scale [Judge et al., 1998]. The scale measures individuals’ behavioral attitudes and evaluates their core self in relation to performance, goals, and satisfaction.
This widely-known construct entails supportive, key components that continue to be relevant in research [Booth et al., 2020; Datu et al., 2022]. CSE is important to overall life experiences. CSE is a theory of self-appraisal that provides a basis for understanding the role of individuals’ fundamental self-evaluation in the success of goal attainment in various life experiences [Judge et al., 1998]. CSE theory defines, quantifies, and constitutes components of general self-efficacy, self-esteem, neuroticism, and locus of control that contribute to success in goal attainment [Sharma & Misra, 2017]. Erez and Judge [2001] showed that the specific components of core self-evaluations theory are variables that define and guide the approach to understanding behavioral attitudes related to well-being and success [Datu et al., 2022], justifying CSE theory as an appropriate framework for the proposed study.
In a study conducted by Erez and Judge [2001], three separate studies were performed. The researchers conducted this study based on the need for studies to include all components of CSE because although more than 48,000 studies had been conducted, most of the studies only studied a single component of CSE. The goal was to determine the role of CSE in goal-setting, motivation, and performance. Study 1 examined the relationship between the four components of CSE. Study 2 examined the relationship between CSE, motivation, and performance. Study 3 examined the study’s replicability and determined if the relationship between CSE and performance is mediated by goal-setting behavior. Using confirmatory factor analyses, researchers found a correlation between all components of CSE: self-esteem, general self-efficacy, neuroticism, and locus of control. Results indicated individuals’ CSE on a whole was related to their goal setting, motivation, and performance, as well as individuals’ separate components of CSE. Because this study was the first to study all four components of CSE, Erez and Judge et al. [2001] recommended that future research conduct more research on this construct.
Grit Model
In the past two decades, a substantial amount of research has been conducted using Angela Duckworth’s Grit Model [Duckworth et al., 2007]. Grit is a non-cognitive factor that includes passion and perseverance of effort over long periods of time toward goal attainment [Duckworth, 2016; Duckworth & Quinn, 2009]. Angela Duckworth created the grit model which focuses on factors of consistency of interest and perseverance in obtaining long-term goals [Duckworth & Quinn, 2009]. Duckworth and Quinn [2009] claimed the grit model is validated in explaining factors that contribute to success in goal attainment. Grit defines, quantifies, and constitutes elements of passion, perseverance, and consistency to succeed [Duckworth et al., 2011]. Duckworth et al. [2011] argued that success in goal attainment is explained through grit’s components of consistency of interest and perseverance of effort, which help individuals to persist in goal attainment. Suzuki et al. [2015] conducted a study underpinned by the grit model and found grit to have predictive validity for work engagement.
Grit is operationalized by individuals’ exercise of self-control, consistency, perseverance, and prioritization of goals over long periods of time. Grit has been found to be positively associated with other factors. Isenberg and colleagues developed a study on the foundation of the grit model. The researchers found that grit is positively associated with self-esteem, sociability, and empathy [Isenberg et al., 2020]. Rhodes and Giovannetti [2021] conducted a study based on the grit model and found that grit plays a role in successful aging. From the Grit Model, the Grit-S Scale was developed and is used to measure and provide data on behavioral attitudes related to goals and performance [Duckworth & Quinn, 2009]. The grit scale is an eight-item, five-point scale where one is not gritty at all and five is very gritty. According to Duckworth et al. [2007], understanding these factors that influence individuals’ ability to establish goals and persevere with consistency is critical for achievement and success.
Method
The methodology chosen for this study is quantitative. The rationale for using quantitative methodology is that it is suitable for measuring variables and uses research instruments to measure variables. These scales have been empirically validated in previous research [Duckworth & Quinn, 2009]. The quantitative approach allows for analysis using inferential statistics. A survey instrument is used to quantify the variables [Duckworth et al., 2019]. The quantitative method is used for the mathematical analysis of numerical data [Raphiphatthana et al., 2018].
Research Design and Sample: The research design is correlational predictive. The population for this study is adults ages 18-65 in the United States. The sample size of 115. A large sample size also addresses any possibility of failing to reject a false null hypothesis (Type II error). An increased sample size causes the Type II error to decrease. A small sample size causes the level of significance to decrease.
Recruitment and Sampling Strategy
Volunteer sampling, a form of convenience sampling, was used in this study (Stratton, 2021) to recruit participants through three Facebook groups. According to Elfil and Negida, 2017), this sampling approach is a non-random or non-probability sampling strategy and provides easy access to participants. Participants were required to complete an informed consent that was created per the Belmont Report Principles.
Compliance with Ethical Standards: Approval to conduct this research was obtained from the Grand Canyon University Institutional Review Board (IRB) at Grand Canyon University, USA.
Informed Consent: Participants were required to complete an informed consent that was created per the Belmont Report Principles. The informed consent was submitted to social media sites via SurveyMonkey. Participants gave written confidential consent to participate.
Data Collection Instruments
In this study, research instruments CSE, Grit-S, and GESS-R were used to measure the following variables: CSE, grit, and generalized expectancy for success. No permission was required to use the CSE and Grit-S Scales and permission has been obtained to use the GESS-R Scale. The instruments used in this study have also been successfully administered in previous research [Erez & Judge, 2001; Duckworth & Quinn, 2009; Fibel & Hale, 1978]. The instruments are Likert scale surveys which, according to Norman [2010], are appropriate and effective in measuring participants’ responses to a set of survey items and the ordinal data can be approximated to interval.
Research Data
Surveys were used to assess the study variables CSE, grit, and generalized expectancy for success. The scales to measure the variables are CSE, Grit-S, and GESS-R. These are Likert scales that are appropriate for using as interval data [Wu & Leung, 2017]. Regression analysis will use the value of CSE, grit, and age to predict the value of generalized expectancy for success.
CSE Scale
Core self-evaluations wereassessed using the CSE Scale. The CSE scale is a 12-item, five-point, interval scale [Erez & Judge, 2001; Judge et al., 2003]. This scale has been designed by Judge et al. [1998]. This instrument aligns with CSE theory and is focused on measuring components of self-esteem, neuroticism, general self-efficacy, and locus of control. This scale includes items such as: “Overall I am satisfied with the proposed life” and “I do not feel in control of the proposed success in the proposed career.”
Grit-S Scale. Grit was assessed using the Grit-S Scale. The Grit-S which is a short grit scale was created and validated by Duckworth and Quinn [2009]. Grit-S is a five-point, 8 items scale. This measure includes two factors: consistency of interest and perseverance of effort demonstrated by individuals’ passion and perseverance for goals over long periods of time. The maximum score on this scale is 5 (extremely gritty), and the lowest score is 1 (not at all gritty). Item examples include the following: “I finish whatever I begin.” The response range for items 2, 4, 7, and 8 would be from 5 (“very much like me”) to 1 (“Not like me at all”).
GESS-R Scale. Generalized expectancy for success was assessed using the GESS-R Scale (Hale et al., 1992). The original Generalized Expectancy Success Scale (GESS) is a 30-item instrument developed by Fibel and Hale [1978] to assess individuals’ expectations of being successful in various situations. The higher the score, the greater the expectancy of success. Schutte et al. [1996] maintained that the GESS is less susceptible to confounding variables than other scales such as the life orientation scale. The scale rating ranges from 1 (highly improbable) to 5 (highly probable). The score is reversed for items 9, 13, 17, 20, and 23. For example, if (highly probable) 5 is selected the score is 1. For all other items if (highly probable) 5 is selected the score is 5, and so on. The GESS-R is scored by summing all items, obtaining a composite score, with a high score indicating high generalized expectancy for success [Hale et a., 1992]. Necessary approval has been obtained to use the GESS-Scale.
Demographic Survey
Demographic data was collected via a demographic survey. This data was collected online. The survey included demographic questions participants will be asked. Participants were asked to identify their actual age which must be between the ages of 18-65. Participants were asked to answer yes or no as to whether they reside in the United States. The age data was used as a predictor variable in the study. Participants were also asked the following optional demographic questions to describe to population: gender (male, female, non-binary, other, wish not to say), marital status (married, separated, divorced, widow/widower, other, wish not to say), special skills (sports, arts, leadership, military, politics), ethnicity (White/Caucasian, Black/African American, Hispanic, Asian, American Indian, Alaskan Native, other), parental status, and employment and student status (employed, self-employed, or student).
Validity
Measurements and procedures that are valid are important to research. A valid instrument measures what it intends to measure [Duckworth & Quinn, 2009; Judge et al., 2003]. The three types of validity are content, construct, and criterion validity [Duckworth et al., 2021]. Construct validity focuses on the extent to which the instrument is capable of accurately measuring and testing the hypothesis or theory [Judge et al., 2003]; that is, do the scores predict the theoretical traits that it claims? According to Schmidt et al. [2017], criterion validity refers to the instrument measuring up to standards in comparison to other constructs that measure the same variable.
CSE Scale
Support for the CSE instrument is identified in the research literature. Judge et al. [2001] found that certain traits are indicators of a common core of self-evaluations. In validating this scale of measurement, Judge et al. [2003] found that the CSE measures a single factor and is comprised of self-esteem, locus of control, generalized self-efficacy, and emotional stability. The four components of CSE were measured bylooking at their commonalities and how they converge and predict outcomes with fewer errors than when components are measured individually.
Grit-S Scale. The Grit-S Scale has been examined in research to determine its validity. In a study of 1,554 adults’ career and academic success, Duckworth and Quinn [2009] validated the Grit-S scale. Sulla et al. [2018] conducted a study to validate the Grit-S scale with Italian students and content validity was obtained with forward-backward semantic translation. Equivalence was achieved with the original Grit scale. The results showed discriminant validity for both scales [r’s > .30].
GESS-R Scale. Research that confirms the validity of the GESS-R Scale has been demonstrated. Based on predictive validity, researchers maintained that the scale was valid and reliable with a correlation of .45 for the total score [Hale et al., 1992]. The researchers claim the instrument was valid when studying expectancy for success with undergraduate university students. Schutte et al. [1996] maintained that the GESS-R measure is less susceptible to confounding variables. According to Ward [2001], GESS-R is more of a multidimensional construct that includes general, failure, career, and personal life expectations based on exploratory factor analysis.
Reliability
Reliability refers to how stable and consistent an instrument is over periods of time in research. Just like validity, the reliability of research instruments is also important to research studies. Reliability shows that the instrument is capable of repeatedly producing the same results. A Cronbach's alpha will be used to test the internal consistency reliability of the Grit-S, CSE, and GESS-R. Cronbach's alpha is effective for measuring the reliability of rating scales [Duckworth and Quinn, 2009].
CSE Scale. The CSE Scale measures individuals’ core evaluation of self, such as belief about their abilities, their self-worth, and their role in exerting control over goals and outcomes [Judge et al., 2003]. The Core Self-Evaluations [CSE] scale is a 12-item, five-point scale [Erez & Judge, 2001; Judge et al., 2003]. This scale was designed by Judge et al. [1998].
Grit-S Scale. The Grit-S is an 8-item, five-point Likert scale for measuring grit [Duckworth and Quinn, 2009]. This measure aligns with the theory of grit and focuses on consistency of interest and perseverance of effort in performance and success. This scale includes items such as “I am a hard worker,” I finish what I begin,” and “New ideas and projects sometimes distract me from previous ones.” The Grit-S Scale’s reliability has been tested in research using four separate samples by Duckworth & Quinn [2009].
GESS-R Scale. Reliability of the GESS-R is also identified in the research. The original Generalized Expectancy Success Scale [GESS] is a 30-item instrument developed by Fibel and Hale [1978], to assess individuals’ expectations of being successful in various situations. The higher the score, the greater the expectancy of success. Colomeischi [2015] argued that the GESS scale was reliable in determining that individuals experience well-being when they expect to succeed withthe internal consistency of .87. Hale et al. [1992] revised the GESS to GESS-R, which is a 25-item scale that is shorter, and less controversial than the original scale and found a split-half reliability of .92.
Results and Discussion
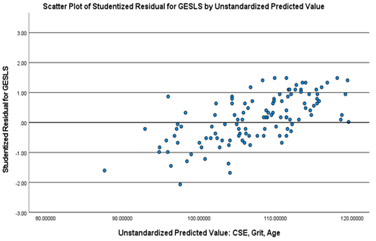
The scatterplots showed no funnel or fan shape, and a partial regression plot of the aggregate mean scores for the criterion variable and each predictor variable indicates a linear relationship between the individual variables (Figures 1-3). The final scatter plot indicates a linear relationship between the aggregate mean score of the criterion variable and all three predictor variables combined (Figure 4). Grit showed a statistically significant inverse relationship, which that means as grit increased GES decreased. CSE showed a statistically significant relationship, and the age variable did not show a statistically significant relationship.
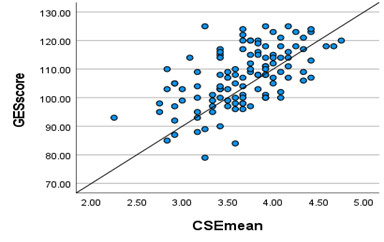
Figure 1: CSE and GES Scatterplot
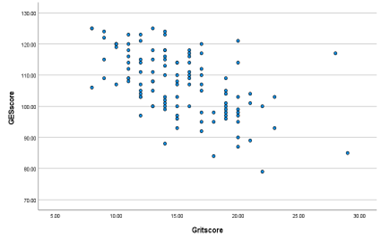
Figure 2: Grit and GES Scatterplot
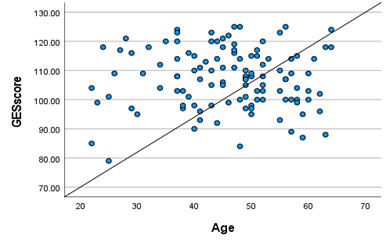
Figure 3: Age and GES Scatterplot
The results of this study are based on the investigation of variables using a correlational predictive research design. The predictive relationship between CSE, grit, age, and generalized expectancy for success for adults ages 18-65 in the United States was examined. Four research questions were addressed.
Research Question 1. The results of RQ1 determined the extent to which CSE, grit, and age combined predict generalized expectancy for success in adults ages 18-65 in the United States. The results were determined by the multiple linear regression analysis. The research question, hypotheses, and analysis were:
RQ1: If and to what extent do CSE, grit, and age combined, predict generalized expectancy for success in adults ages 18-65 in the United States?
H01: CSE, grit, and age combined do not predict generalized expectancy for
success in adults ages 18-65.
H1a: CSE, grit, and age combined do not predict generalized expectancy for success in adults ages 18-65.
Multiple linear regression was used to determine if the predictor variables CSE, grit, and age combined predict generalized expectancy for success in adults ages 18-65. Multiple linear regression was the appropriate statistical test as indicated by meeting the assumptions for this test. When all three predictors of CSE, grit, and age were added to the regression model, this accounts for 42.7% of the variance of GES. Laerd Statistics (2020) maintains that the coefficient of determination (R2) represents the variance of the predictor variables on the criterion variable. The R2 value is a positively biased estimate of the proportion of the variance of the criterion variable. The adjusted R2 provides a value that is expected in the population by correcting this positive bias. For the overall model, the result of R2 adjusted was 41.1% (Table 1). As evidenced in Table 1, the multiple correlation coefficient for this research question was R = .653, which shows the strength and direction of the relationship between the predictor variables and the criterion variable. This means there was a strong, positive relationship among the variables (Table 1). The R2 for RQ1 was .427 (42.7%), with an adjusted R2 of .411 (41.1%), showing how CSE, grit, and age together, accounted for 41.1% of the total variance in the criterion variable, generalized expectancy for success (Table 1).
Table 1: Model Summary
| Model | R | R Square | Adjusted R Square | Std. Error of the Estimate | Durbin Watson |
| 1 | .653a | .427 | .411 | 7.806 | 1.96 |
To determine the statistical significance the ANOVA of the multiple regression output was assessed. A p < .05 showed a statistically significant result. The results of the ANOVA verified the CSE, grit, and ages combined statistically, significantly predicted generalized expectancy for success, F (3, 111)=27.56, p<.001 (Table 2). The null hypothesis was rejected with CSE, grit, and age combined statistically, significantly predicting generalized expectancy for success.
Table 2: Regression Output-ANOVA
| Model | Sum of Squares | df | Mean Square | F | Sig | |
| 1 | Regression | 50.38 | 3 | 1679.38 | 27.56 | <.001 |
| Residual | 6762.56 | 111 | 60.924 | |||
| Total | 1180.730 | 114 |
Note: Predictor Variables: CSE, Grit, Age; Criterion Variable: GES
To determine the statistical significance the ANOVA of the multiple regression output was assessed. A p < .05 showed a statistically significant result. The results of the ANOVA verified the CSE, grit, and ages combined statistically, significantly predicted generalized expectancy for success, F(3, 111) = 27.56, p < .001 (Table 2). The null hypothesis was rejected with CSE, grit, and age combined statistically, significantly predicting generalized expectancy for success.
Research Question 2. The results of RQ2 determined the extent to which CSE predicts generalized expectancy for success while controlling for grit and age in adults ages 18-65 in the United States. The results were determined by the multiple linear regression analysis used to answer RQ1. The research question, hypotheses, and analysis were:
RQ2: If and to what extent does CSE predict generalized expectancy for success while controlling for grit and age in adults ages 18-65 in the United States?
H02: CSE does not predict generalized expectancy for success while controlling
for grit and age in adults ages 18-65.
H2a: CSE does predict generalized expectancy for success while controlling for grit and age in adults ages 18-65.
Multiple linear regression was used to determine if CSE predicts GES while controlling for grit and age. CSE statistically significantly predicted GES for the sample in the target population with a p = < .001 (β = .404, t = 4.940, p < 0>
Table 3: Regression Output Coefficients
| Model 1 | Unstandardized Coefficients | Standardized Coefficients | 95.0% Confidence Interval for B | Correlations | |||||
| Variable | B | Std. Error | Beta | t | Sig. | Lower Bound | Upper Bound | Partial | Part |
| Constant | 91.554 | 9.473 | 9.665 | <.001 | 72.783 | 110.324 | |||
| CSE | 8.822 | 1.786 | .404 | 4.940 | <.001 | 5.283 | 12.360 | .425 | .355 |
| Grit | -.909 | .208 | -.360 | -4.366 | <.001 | -1.322 | -.497 | -.383 | -.314 |
| Age | -.062 | .072 | -.063 | -.866 | .388 | -.204 | .080 | -.082 | -.062 |
Note: Criterion Variable: GES
Research Question 3. The results of RQ3 determined the extent to which grit predicts generalized expectancy for success while controlling for CSE and age in adults ages 18-65 in the United States. The results were determined by the multiple linear regression analysis used to answer RQ1. The research question, hypotheses, and analysis were:
RQ3: If and to what extent does grit predict generalized expectancy for success while controlling for CSE and age in adults ages 18-65 in the United States?
H03: Grit does not significantly predict grit and generalized expectancy for success while controlling for CSE and age in adults ages 18-65.
H3a: Grit does significantly predict generalized expectancy for success while controlling for CSE and age in adults ages 18-65.
Multiple regression was used to determine to what extent grit predicts GES for adults ages 18-65 while controlling for CSE and age. The results were a statistically significant, correlational relationship, but it is a negative relationship because as grit increased, generalized expectancy for success decreased (β = -.360, t = -4.366, p < 0>
Research Question 4. The results of RQ4 determined the extent to which age
predicts generalized expectancy for success while controlling for CSE and grit in adults ages 18-65 in the United States. The results were determined by the multiple linear regression analysis used to answer RQ1. The research question, hypotheses, and analysis were:
RQ4: If and to what extent does age predict generalized expectancy for success while controlling for CSE and grit in adults ages 18-65 in the United States?
H04: Age does not significantly predict generalized expectancy for success while controlling for CSE and grit in adults ages 18-65.
H4a: Age does significantly predict generalized expectancy for success while
controlling for CSE and grit in adults ages 18-65.
Multiple regression was used to show to what extent age predicts GES for adults
ages 18-65 while controlling for CSE and grit. There was not a statistically significant relationship, as evidenced by (β = -.063, t = -.866, p = .388) (Table 3). Since the result was not less than .05 statistical significance was not met. The null hypothesis failed to be rejected.
In summary, multiple regression demonstrated that the null hypotheses for research questions 1, 2, and 3 were rejected. CSE, grit, and age combined predicted generalized expectancy for success (GES) for adults ages 18-65. Individually, CSE and grit predicted GES. The null hypothesis for the age variable in research question 4 failed to be rejected because age showed no statistically significant result (Table 3). The next section presents limitations.
The following section defines the terms used for the demographic questions used in this study. A narrative summary and tables are provided for each of the eight demographic questions (Table 4, Table 5). The sample was comprised of 115 adults ages 18-65 in the United States. The demographic questionnaire was optional and placed after informed consent in the survey. Participants were not required to complete the questionnaire as part of the study. The demographic questions provided information on gender, age, ethnicity, marital status, special skills, parenting, student, employment, and self-employment status. The demographic statistics listed below provide insight into the characteristics of the participants.
Gender
The demographic questionnaire showed the participants’ gender. The options were male, female, bi-nary, other, or wish not to say.
Age: The participants reported their ages. The sample for the study included adults between the ages of 18-65.
Ethnicity: Participants were asked to identify their ethnicity. The sample for the study included White/Caucasian, Black/African American, Hispanic/Latino, American Indian, Alaskan Native, and others.
Marital Status: Participants identified their marital status by answering married, separated, divorced, widow/widower, other, or wish not to say.
Special Skills: Special skills included military, sports, arts, leadership, and politics.
Parent: Participants answered yes or no to the question: are you a parent?
Student: This demographic asked if the participants were students.
Employment Status: The seventh demographic question referred to participants’ employment status. Participants were asked if they were employed and/or self-employed.
Self-Employment Status: The final demographic question asked if participants were self-employed.
The data were obtained through convenience sampling to secure a large enough sample from thousands of adults with a variety of life experiences. The target population for this study was adults ages 18-65 in the United States. A sample of 130 total participants was recruited through multiple social media groups. A total of 4 were removed for starting but not completing the survey and 1 was removed for being outside of the age range, for a total of 5. An additional 10 were removed as outliers resulting in a final sample size of N = 115.
The demographic data are outlined in Table 4. The ethnicity demographic showed the largest was 57.4%, Black/African American. The largest percentage for the marital status demographic was 49.6% were married. The parent demographic showed that 78.3% were parents. The majority of participants were female, 83.5% and 69.6% indicated having special skills as defined in the demographic descriptive definitions. The student demographic showed 40.9%, 89.6% were employed, and 26.1% were self-employed. The age range for the sample was between 22 and 64 years old (Table 5). The number of participants was a total count of 11 for ages 22 to 29 years old, 30 to 39 years old, 18 counts, 40 to 49 years old, 40 counts, 50 to 59 years old, 36 counts, and 60 to 64 years old, 10 counts. Age is the only factor that is also a predictor variable in this study, the other demographics in this study are not predictors, they add to the knowledge of current literature on populations.
Details of the demographic statistics are described in Table 4. The descriptive statistic was used to summarize and describe the data for the study participants and provide an overview of their characteristics by gender (male, female, non-binary, other, wish not to say), marital status (married, separated, divorced, widow/widower, other, wish not to say), special skills (sports, arts, leadership, military, politics), ethnicity (White/Caucasian, Black/African American, Hispanic, Asian, American Indian, Alaskan Native, other), parental status, and employment and student status (employed, self-employed, or student). Each demographic was assigned a number from 1-5 for gender, 1-6 for marital status, and 1-7 for ethnicity. The other demographics were assigned 1 for yes and 2 for no (Table 4).
Table 4: Demographic Statistics
| Demographics | n | % |
| Marital married | 57 | 49.6% |
| separated | 1 | 0.9% |
| divorced | 19 | 16.5% |
| widow/er | 2 | 1.7% |
| other | 32 | 27.8% |
| *wns | 4 | 3.5% |
| Ethnicity White | 34 | 29.6% |
| Blk/A.A | 66 | 57.4% |
| Hispanic | 11 | 9.6% |
| Amer/Ind | 1 | 0.9% |
| other | 3 | 2.6% |
| Gender male | 18 | 15.7% |
| female | 96 | 83.5% |
| *wns | 1 | 0.9% |
| SS yes | 80 | 69.6% |
| no | 35 | 30.4% |
| Student yes | 47 | 40.9% |
| no | 68 | 59.1% |
| Emp- yes | 103 | 89.6% |
| loyed no | 12 | 10.4% |
| SE yes | 30 | 26.1% |
| no | 85 | 73.9% |
| Parent yes | 90 | 78.3% |
| no | 25 | 21.7% |
*Wish not to say (WNS), Special skills (SS), Self-employed (SE).
Table 5: Age Demographic
| Age | n |
| 22-29 | 11 |
| 30-39 | 18 |
| 40-49 | 40 |
| 50-59 | 36 |
| 60-64 | 10 |
N =115
Limitations
Limitations occur in research. Limitations indicate there are factors in the research study that are beyond the researcher’s control. In this respect, the researcher indicated transparency and a full understanding of the study and clarified limitations to help the reader understand the conditions under which the study would be examined. In this study the following limitations were present:
1. Because the surveys were based on self-report this was a limitation, and although it was assumed that participants understood the questions and answered honestly, this cannot be known. This study’s findings might also be limited in scope and generalizability because participants were limited to social media sites. Also, the majority of the participants were females (83.5%) and African American (57.4%).
2. This study was quantitative and used a Likert Scale to obtain participant responses. This limited participants’ ability to explain their responses. The survey anticipated completion time of 20-25 minutes could have been a barrier to participation, although the sample size achieved for the study exceeded the G*power calculated sample size needed.
3. A third limitation concerns the design. Correlational predictive research does not imply causation. It only shows whether one variable has a predictive effect on another. Also, this study does not show comparisons between different groups.
Future Research Implications
This study added to the existing scholarly literature by revealing how CSE, grit, and age combined predict generalized expectancy for success in adults ages 18-65. Future implications for research include an examination of other factors that may significantly predict variance in the generalized expectancy for success in adults. Therefore, other variables should be examined to obtain a fuller understanding of factors contributing to generalized expectancy for success. Additional variables explored to explain variance in generalized expectancy for success should include demographic information not included in this study, especially in light of the inverse relationship of grit to generalized expectancy.
Such factors should include hope, resilience, purpose, caring, appraisal, and a sense of belonging. These factors have been studied in previous grit research and were better predictors of success than grit (Buskirk-Cohen & Plants, 2019; Steed, 2002). However, these factors were studied with actual success and not generalized expectancy for success. Shanahan (2020) also conducted a study on hope, optimism, and affect as predictors of success and maintained that hope might be more accurately demonstrated by individuals’ ability to control and accomplish personal goals; whereas, optimism or expectation might be more accurately demonstrated by individuals’ expectation of good things happening independent of personal control. Also, since the participants in this study were mostly African Americans and females, these demographics should be studied further.
Other implications stemming from the significance of resilience include an examination of whether CSE, grit, and age in individuals under the age of 18 and over the age of 65. This could provide more insight into a younger and older age range that was not accounted for in this study, to better the knowledge and understanding of educators, school counselors and staff, policymakers, coaches, and parents as to the most beneficial time to begin working on the development of CSE and grit and specific ways to best implement resources geared toward the development of these qualities. The age factor is also critical since this variable did not show statistically significant results with the population of this study. Also, Kannangara et al. (2018) conducted a study and found high levels of grit and resilience were associated with older females. Future research with different age populations and demographics might provide further insight or support the findings of this study.
Additionally, combining CSE and grit principles may be beneficial to individuals of all ages in various areas of life, since both CSE and grit have been identified as predictors of success (Duckworth et al., 2019; Peltokorpi & Michel, 2021) in previous research and this study showed that CSE and grit combined predicted generalized expectancy for success. As a result, understanding the factors that contribute to low levels of CSE and grit among a broad age range would help in identifying ways to improve CSE and grit, and success expectancy.
Theoretical Implications
Before this research study, it was not known if and to what extent CSE, grit, and age predicted generalized expectancy for success among adults ages 18-65. The current study was designed based on CSE Theory and the Grit Model. CSE Theory and the Grit Model were used to better understand the predictor variables of CSE, grit, and age, and the criterion variable of generalized expectancy for success. The current study attempted to better understand behavioral attitudes that affect generalized expectancy for success through the use of these theories.
CSE theory considers four dimensions of personality (self-esteem, general self-efficacy, neuroticism, and locus of control). This theory proposes that individuals with high CSE think positively of themselves, and confidently about their abilities and their control over success outcomes (Judge et al., 2003). This occurs through an appraisal process. Conversely, when CSE is low, individuals’ behavioral attitudes toward self-esteem and general self-efficacy is not positive and confident. This trait, considered a non-cognitive factor, remains consistent over time (Judge et al., 1997). The components of CSE are ways in which individuals appraise themselves and have the ability to predict positive outcomes in job performance and satisfaction and life satisfaction.
The Grit Model is a two-factor model of consistency of interest and perseverance of effort related to individuals’ behavioral attitudes toward goals and success outcomes. Grit is a non-cognitive factor that assesses individuals’ appraisal of their behavioral attitudes about their passion, consistency, perseverance, and deliberate practice of goals over long periods of time to achieve success (Duckworth et al., 2007). Individuals with high grit levels are considered gritty. Conversely, low grit levels indicate individuals are less gritty, noting that grit predicts happy individuals, well-being, and success. This current study was framed by CSE Theory and the Grit Model to better understand the behavioral attitudes of CSE and grit and the use of CSE and grit as predictors of generalized expectancy for success. The design of this study and the research questions aligned with CSE Theory and the Grit Model to quantitatively examine the relationship among all the variables.
This study supported the tenets of CSE Theory and the Grit Model by determining the collective influence of CSE, grit, and age on generalized expectancy for success in answering the first research question. Research questions 2-4 were answered by looking at each of the predictor variables separately. As each predictor variable was measured, the other two were controlled. The results from research question 1 showed a statistically significant predictive relationship between CSE, grit, and age in predicting generalized expectancy for success. Research questions two, three, and four examined the unique individual predictive relationship of CSE, grit, age, and generalized expectancy for success. The results from an examination of research question two revealed CSE as having a statistically significant predictive relationship with generalized expectancy for success while controlling for grit and age among adults ages 18-65. This predictive relationship revealed how higher levels of CSE have the potential to predict high levels of generalized expectancy for success. The results from the examination of research question three revealed that grit has a statistically significant predictive relationship with generalized expectancy for success while controlling for CSE and age among adults ages 18-65. Finally, the results from research question four indicated that age does not have a statistically significant predictive relationship with generalized expectancy for success while controlling for CSE and age.
Conclusion
This quantitative correlational predictive study used multiple linear regression analysis to analyze data from 115 adult participants aged 18-65 in the United States. Though prior research had examined various combinations of these variables, the gap in the literature was identified because no previous studies examined the variables simultaneously among adults in a broad age range. Additionally, researchers have identified the need for further research to examine grit and other non-cognitive factors (Duckworth et al., 2019). Furthermore, Peltokorpi and Michel (2021) recommended further research to examine a more diverse population and Fabelico and Afalla (2020) suggested examining grit and other variables on a wider scale to determine predictors of success. This study addressed the gap in the literature by examining the relationship between the predictor variables CSE, grit, age, and generalized expectancy for success, the criterion variable.
Additionally, each predictor variable was examined for its unique predictive relationship with generalized expectancy for success, which was the criterion variable. The following section includes the results of this study and how these results compare to prior research. When comparing this study’s results to prior research, attention is given to the relationship among and between the variables established in the literature. The correlational predictive design of the current study requires a relationship between variables that meet the assumptions to conduct predictive analysis (Kwon, 2021). This predictive analysis is a multiple linear regression analysis, and the variables’ relationship is integral for examining the predictive relationship of the predictor variables with the criterion variable, generalized expectancy for success. The significance of the current study could only be established by examining the correlation between the variables of this study and predicting the variance in the criterion variable (Duckworth et al., 2019). The analysis of these relationships in predicting generalized expectancy for success was accomplished by answering the four research questions.
Declarations
Acknowledgments
This research is part of Ph.D. research work under the title of “A Correlational Predictive Study of Core Self-Evaluations, Grit, and Success Expectancy”, and this research was not funded by any organization.
Competing Interests
Not Applicable
Funding
The author of this research declares no support, financial or otherwise, has been received from any organization that may have interest in the submitted work, and there are no other relationships or activities that could appear to have influenced the submitted work. This is fourth prize.
Data Availability
The data that support the findings of this study are available upon request from the corresponding author (C.S.)
References
- Akbag, M., & Ümmet, D. (2017). Predictive role of grit and basic psychological needs satisfaction on subjective well-being for young adults. Online Submission, 8(26), 127–135.
Publisher | Google Scholor - Akos, P., Kretchmar, J. (2017). Investigating grit as a non-cognitive predictor of college success. The Review of Higher Education, 40(2), 163-186.
Publisher | Google Scholor - Alhadabi, A., & Karpinski, A. C. (2020). Grit, self-efficacy, achievement orientation goals, and academic performance in university students, International Journal of Adolescence and Youth, 25(1), 519-535.
Publisher | Google Scholor - Allen, M. S., Mison, E. A., Robson, D. A., & Laborde, S. (2021). Extraversion in sport: A scoping review. International Review of Sport and Exercise Psychology, 14(1), 229-259.
Publisher | Google Scholor - Al Mulhim, E. N. (2021). Flipped learning, self-regulated learning and learning retention of students with internal/external locus of control. International Journal of Instruction, 14(1), 827-846.
Publisher | Google Scholor - Almeida D. J., Byrne A. M., Smith, R. M., & Ruiz S. (2021). How relevant is grit? The importance of social capital in first-generation college students’ academic success. Journal of College Student Retention: Research, Theory & Practice, 23(3), 539-559.
Publisher | Google Scholor - Anderson, C., Turner, A. C., Heath, R. D., & Payne, C. M. (2016). On the meaning of grit… and hope… and fate control… and alienation… and locus of control… and… self-efficacy… and… effort optimism… and…. The Urban Review, 48(2), 198-219.
Publisher | Google Scholor - Andersen, T. S., Scott, D. A. I., Boehme, H. M., King, S., & Mikell, T. (2020). What matters to formerly incarcerated men? Looking beyond recidivism as a measure of successful reintegration. The Prison Journal, 100(4), 488-509.
Publisher | Google Scholor - Anestis, M. D., & Selby, E. A. (2015). Grit and perseverance in suicidal behavior and non-suicidal self-injury. Death Studies, 39(4), 211-218.
Publisher | Google Scholor - Ansah & Apaak (2019). Safety behaviour and grit in sports performance among Ghanian university athletes. African Journal of Physical Activity and Health Sciences, 25(3), 418-432.
Publisher | Google Scholor - Arabmomeni, A. (2020). Effects of motivational self-talk on self-esteem and competitive anxiety in elite swimmer players. Medical Journal of Mashhad University of Medical Sciences, 63(1), 2177-2186.
Publisher | Google Scholor - Arnett, J. J., Žukauskienė, R., & Sugimura, K. (2014). The new life stage of emerging adulthood at ages 18–29 years: Implications for mental health. The Lancet Psychiatry, 1(7), 569-576.
Publisher | Google Scholor - Atad, O. I., & Grant, A. M. (2021). Evidence-based coaching as a supplement to traditional lectures: Impact on undergraduates' goal attainment and measures of mental well-being. International Journal of Mentoring and Coaching in Education, 10(3), 249-266.
Publisher | Google Scholor - Bandura, A. (1977). Self-efficacy: toward a unifying theory of behavioral change. Psychological Review, 84(2), 191-215.
Publisher | Google Scholor - Bandura, A. (1978). Reflections on self-efficacy. Advances in Behaviour Research and Therapy, 1(4), 237-269.
Publisher | Google Scholor - Bandura, A. (1993). Perceived self-efficacy in cognitive development and functioning. Educational Psychologist, 28(2), 117-148.
Publisher | Google Scholor - Bloomfield, J., & Fisher, M. J. (2019). Quantitative research design. Journal of the Australasian Rehabilitation Nurses Association, 22(2), 27-30.
Publisher | Google Scholor - Boone, H. N. & Boone, D. A. (2012). Analyzing Likert data. Journal of Extension, 50(2), 1-5.
Publisher | Google Scholor - Booth, J. E., Shantz, A., Glomb, T. M., Duffy, M. K., et al. (2020). Bad bosses and self‐verification: The moderating role of core self‐evaluations with trust in workplace management. Human Resource Management, 59(2), 135-152.
Publisher | Google Scholor - Borae, J., & Joohan, K. (2017). Grit, basic needs satisfaction, and subjective well-being. Journal of Individual Differences, 38(1), 29–35.
Publisher | Google Scholor - Bowie, S. L., Hall, J. C., & Moss, J. W. (2021).
Publisher | Google Scholor - Bowman, N. A., Hill, P. L., Denson, N., & Bronkema, R. (2015). Keep on truckin’ or stay the course? Exploring grit dimensions as differential predictors of educational achievement, satisfaction and intentions. Social Psychological and Personality Science, 6(6), 639-645.
Publisher | Google Scholor - Bradley, R., & Corwyn, R. (2001). Home environment and behavioral development during early adolescence: The mediating and moderating roles of self-efficacy beliefs. Merrill-Palmer Quarterly-Journal of Developmental Psychology, 47(2), 165–187.
Publisher | Google Scholor - Brannock, R. G., Litten, M. J., & Smith, J. (2000). The impact of doctoral study on marital satisfaction. Journal of College Counseling, 3(2), 123-130.
Publisher | Google Scholor - Buskirk-Cohen, A. A., & Plants, A. (2019). Caring about Success: Students' perceptions of professors' caring matters more than grit. International Journal of Teaching and Learning in Higher Education, 31(1), 108-114.
Publisher | Google Scholor - Butz, N. T., Hanson, S., Schultz, P. L., & Warzynski, M. M. (2018). Beyond the Big Five: Does grit influence the entrepreneurial intent of university students in the US? Journal of Global Entrepreneurship Research, 8(1), 1-16.
Publisher | Google Scholor - Chu, Y. S., Oh, W. O., Park, I. T., Lee, A., & Jung, M. J. (2021). Pediatric nurses grit and nursing intention during the COVID-19 pandemic: Mediating and moderating effects of mindset and psychological collectivism. Child Health Nursing Research, 27(4), 395-403.
Publisher | Google Scholor - Clark, R. S., & Plano Clark, V. L. (2019). Grit within the context of career success: A mixed methods study. International Journal of Applied Positive Psychology, 4, 91-111.
Publisher | Google Scholor - Colomeischi, A. A. (2015). Predictors for wellbeing: Emotional factors and expectancy for success. Procedia-Social and Behavioral Sciences, 190, 48-53.
Publisher | Google Scholor - Corbu, A., Peláez Zuberbühler, M. J., & Salanova, M. (2021). Positive psychology micro-coaching intervention: Effects on psychological capital and goal-related self-efficacy. Frontiers in Psychology, 12(566293), 1-14.
Publisher | Google Scholor - Cormier, D. L., Dunn, J. G., & Dunn, J. C. (2019). Examining the domain specificity of grit. Personality and Individual Differences, 139, 349-354.
Publisher | Google Scholor - Credé, M., Tynan, M. C., & Harms, P. D. (2017). Much ado about grit: A meta-analytic synthesis of the grit literature. Journal of Personality and Social Psychology, 113(3), 492–511.
Publisher | Google Scholor - Credé, M. (2018). What shall we do about grit? A critical review of what we know and what we don’t know. Educational Researcher, 47(9), 606-611.
Publisher | Google Scholor - Damon, W., & Hart, D. (1982). The development of self-understanding from infancy through adolescence. Child Development, 53(4), 841-864.
Publisher | Google Scholor - Datu, J. A. D., Rosopa, P. J., & Fynes, J. M. (2022). How does core self-evaluations relate to psychological well-being in the Philippines and United States? The moderating role of relational mobility. Current Psychology, 42(16), 13927-13937.
Publisher | Google Scholor - Datu, J. A. D., Valdez, J. P. M., & King, R. B. (2016). Perseverance counts but consistency does not! Validating the short grit scale in a collectivist setting. Current Psychology, 35(1), 121-130.
Publisher | Google Scholor - Datu, J.A.D., Yuen, M. & Chen, G. (2018). The triarchic model of grit is linked to academic success and well-being among Filipino high school students. School Psychology Quarterly, 33(3), 428-438.
Publisher | Google Scholor - Datu, J. A. D., Yuen, M., Fung, E., Zhang, J., Chan, S., & Wu, F. (2022). The satisfied lives of gifted and gritty adolescents: Linking grit to career self-efficacy and life satisfaction. The Journal of Early Adolescence, 42(8), 1-21.
Publisher | Google Scholor - Deci, E. L., & Ryan, R. M. (1991). A motivational approach to self: Integration in personality. In R. A. Dienstbier (Ed.), Nebraska Symposium on Motivation, 1990: Perspectives on motivation (pp. 237–288). University of Nebraska Press.
Publisher | Google Scholor - Ding, H., & Lin, X. (2020). Individual-focused transformational leadership and employee strengths use: The roles of positive affect and core self-evaluation. Personnel Review, 50(3),1022-1037.
Publisher | Google Scholor - Dóci, E., Hofmans, J., & Judge, T. A. (2021). Personalities in sync: The covariation of psychological resources in leader–follower dyads. European Journal of Personality, 35(4), 466-479.
Publisher | Google Scholor - Duckworth, A. (2016). Grit: The power of passion and perseverance. First Scribner hardcover edition. Scribner.
Publisher | Google Scholor - Duckworth, A., & Gross, J. J. (2014). Self-control and grit: Related but separable determinants of success. Current Directions in Psychological Science, 23(5), 319-325.
Publisher | Google Scholor - Duckworth, A. L., Kirby, T. A., Tsukayama, E., Berstein, H., & Ericsson, K. A. (2011). Deliberate practice spells success: Why grittier competitors triumph at the National Spelling Bee. Social Psychological and Personality Science, 2(2), 174-181.
Publisher | Google Scholor - Duckworth, A., & Quinn, P. D. (2009). Development and validation of the short grit scale (Grit-S). Journal of Personality Assessment, 91(2), 166-174.
Publisher | Google Scholor - Duckworth, A. L., Quinn, P. D., & Tsukayama, E. (2021). Revisiting the factor structure of grit: A commentary on Duckworth and Quinn (2009). Journal of Personality Assessment, 103(5), 573-575.
Publisher | Google Scholor - Duckworth, A. L., Quirk, A., Gallop, R., Hoyle, R. H., Kelly, D. R., & Matthews, M. (2019). Cognitive and non-cognitive predictors of success. Proceedings of the National Academy of Sciences, 116(47), 23499-23505.
Publisher | Google Scholor - Duckworth, A. L., Peterson, C., Matthews, M. D., & Kelly, D. R. (2007). Grit: Perseverance and passion for long-term goals. Journal of Personality and Social Psychology, 92(6), 1087-1101.
Publisher | Google Scholor - Duckworth, A. L., & Yeager, D. S. (2015). Measurement matters: Assessing ersonal qualities other than cognitive ability for educational purposes. Educational Researcher, 44(4), 237-251.
Publisher | Google Scholor - Dweck, C. S. (2008). Mindset: The new psychology of success. Random House Digital, Inc.
Publisher | Google Scholor - Elfil, M., & Negida, A. (2017). Sampling methods in clinical research: An educational review. Emergency (Tehran, Iran), 5(1), 1-3. emerg-5-e52.pdf (nih.gov)
Publisher | Google Scholor - Ellis, T., & Levy, Y. (2009). Towards a guide for novice researchers on research methodology: Review and proposed methods. Issues in Informing Science and Information Technology, 6, 323-337.
Publisher | Google Scholor - Elwahab, S. M. A., Cosgrave, J., Doherty, E., & Lowery, A. (2022). Grit personality trait of doctors and medical students in level 4 acute hospital. The Surgeon, 20(4), 216-224.
Publisher | Google Scholor - Erba, J., Ternes, B., Bobkowski, P., Logan, T., & Liu, Y. (2018). Sampling methods and sample populations in quantitative mass communication research studies: A 15-year census of six journals. Communication Research Reports, 35(1), 42-47.
Publisher | Google Scholor - Erez, A., & Judge, T. A. (2001). Relationship of core self-evaluations to goal setting, motivation, and performance. Journal of Applied Psychology, 86(6), 1270-1279.
Publisher | Google Scholor - Ericsson, K. A., & Harwell, K. W. (2019). Deliberate practice and proposed limits on the effects of practice on the acquisition of expert performance: Why the original definition matters and recommendations for future research. Frontiers in Psychology, 10(2396), 1-19.
Publisher | Google Scholor - Erikson, E. H. (1994). Identity and the life cycle. W. W. Norton & Company.
Publisher | Google Scholor - Eskreis-Winkler, L., Duckworth, A. L., Shulman, E. P., & Beal, S. (2014). The grit effect: Predicting retention in the military, the workplace, school and marriage. Frontiers in Psychology, 5(36), 1-12.
Publisher | Google Scholor - Fabelico, F., & Afalla, B. (2020). Perseverance and passion in the teaching profession: Teachers' grit, self-efficacy, burnout, and performance. Journal of Critical Reviews, 7(11), 108-119.
Publisher | Google Scholor - Farčić, N., Barać, I., Plužarić, J., Ilakovac, V., Pačarić, S., Gvozdanović, Z., & Lovrić, R. (2020). Personality traits of core self-evaluation as predictors on clinical decision-making in nursing profession. Plos One, 15(5), 1-12.
Publisher | Google Scholor - Farfán, J., Peña, M., Fernández-Salinero, S., & Topa, G. (2020). The moderating role of extroversion and neuroticism in the relationship between autonomy at work, burnout, and job satisfaction. International Journal of Environmental Research and Public Health, 17(21), 8166-8178.
Publisher | Google Scholor - Fibel, B., & Hale, W. D. (1978). The Generalized Expectancy for Success Scale: A new measure. Journal of Consulting and Clinical Psychology, 46(5), 924-931.
Publisher | Google Scholor - Firouznia, M., Hosseini, S. H., & Karamabad, M. M. M. (2021). Affective-cognitive nature of engagement: correlating psychological capital and core-self-evaluations to work engagement via positive affects. International Journal of Procurement Management, 14(2), 213-229.
Publisher | Google Scholor - Gandhi, S., Thomas, L., & Desai, G. (2017). Effect of VAPE about mother and infant health on knowledge among primary caregivers of patients with postpartum psychiatric illness: A pre-experimental study. Asian Journal of Psychiatry, 28, 21-25.
Publisher | Google Scholor - Ghaljaie, F., Naderifar, M., Goli, H. (2017). Snowball sampling: A purposeful method of sampling in qualitative research. Strides in Development of Medical Education, 14(3), 1-4.
Publisher | Google Scholor - Gillison, F. B., Rouse, P., Standage, M., Sebire, S. J., & Ryan, R. M. (2019). A meta-analysis of techniques to promote motivation for health behaviour change from a self-determination theory perspective. Health Psychology Review, 13(1), 110-130.
Publisher | Google Scholor - Gilmore-Bykovskyi, A., Jackson, J. D., & Wilkins, C. H. (2021). The urgency of justice in research: Beyond COVID-19. Trends in Molecular Medicine, 27(2), 97-100.
Publisher | Google Scholor - Giuffre, M. (1997). Designing research: Ex post facto designs. Journal of Peri Anesthesia Nursing, 12(3), 191-195.
Publisher | Google Scholor - Gravetter, F. J., & Foranzo, A. B. (2012). Research methods for the behavioral sciences. Wadsworth.
Publisher | Google Scholor - Hale, W. D., Fiedler, L. R., & Cochran, C. D. (1992). The revised generalized expectancy for success scale: A validity and reliability study. Journal of Clinical Psychology, 48(4), 517-521.
Publisher | Google Scholor - He, X., Wang, H., Chang, F., Dill, S. E., Liu, H., et al. (2021). IQ, grit, and academic achievement: Evidence from rural China. International Journal of Educational Development, 80(102306), 1-11.
Publisher | Google Scholor - Hunter A. J. (2001). A cross-cultural comparison of resilience in adolescents. Journal of Pediatric Nursing, 16(3), 172–179.
Publisher | Google Scholor - Ion, A., Mindu, A., & Gorbănescu, A. (2017). Grit in the workplace: Hype or ripe? Personality and Individual Differences, 111, 163-168.
Publisher | Google Scholor - Isenberg, G., Brown, A., DeSantis, J., Veloski, J., & Hojat, M. (2020). The relationship between grit and selected personality measures in medical students. International Journal of Medical Education, 11, 25–30.
Publisher | Google Scholor - Ivcevic, Z., & Brackett, M. (2014). Predicting school success: Comparing conscientiousness, grit, and emotion regulation ability. Journal of Research in Personality, 52, 29–36.
Publisher | Google Scholor - Jachimowicz, J. M., Wihler, A., Bailey, E. R., & Galinsky, A. D. (2018). Why grit requires perseverance and passion to positively predict performance. Proceedings of the National Academy of Sciences, 115(40), 9980-9985.
Publisher | Google Scholor - Jaeger, J., Chang, C. L., & Stupnisky, R. (2022). How does counseling psychology faculty members’ grit relate to their emotions and success in teaching and research? Innovative Higher Education, 47(3), 1-18.
Publisher | Google Scholor - Jeong, J. Y., Seo, Y. S., Choi, J. H., Kim, S. H., Lee, M. S., Hong, S. H., ... & Park, D. E. (2019). The influence of grit on turnover intention of university hospital nurses: the mediating effect of job involvement. Journal of Korean academy of nursing, 49(2), 181-190.
Publisher | Google Scholor - Johnson, R. E., Rosen, C. C., & Lin, S. H. J. (2016). Assessing the status of locus of control as an indicator of core self-evaluations. Personality and Individual Differences, 90, 155-162.
Publisher | Google Scholor - Judge, T. A. (2009). Core self-evaluations and work success. Current Directions in Psychological Science, 18(1), 58-62.
Publisher | Google Scholor - Judge, T.A. & Bono, J.E. (2000). Five-factor model of personality and transformational leadership. Journal of Applied Psychology, 85, 751–65.
Publisher | Google Scholor - Judge, T. A., Erez, A., Bono, J. E., Thoresen, C. J. (2003). Core self-evaluations scale: Development of a measure. Personnel Psychology, 56(2), 303-331.
Publisher | Google Scholor - Judge, T. A., & Hurst, C. (2007). Capitalizing on one's advantages: role of core self-evaluations. Journal of Applied Psychology, 92(5), 1212-1227.
Publisher | Google Scholor - Judge, T. A., Locke, E. A., & Durham, C. C. (1997). The dispositional causes of job satisfaction: A core evaluations approach. Research in Organizational Behavior, 19, 151-188. ROB.pdf (timothy-judge.com)
Publisher | Google Scholor - Judge, T.A., Locke, E.A., Durham, C.C., & Kluger, A.N. (1998). Dispositional effects on job and life satisfaction: The role of core evaluations. Journal of Applied Psychology, 83(1), 17-34.
Publisher | Google Scholor - Judge, T. A., Thoresen, C. J., Bono, J. E., & Patton, G. K. (2001). The job satisfaction–job performance relationship: A qualitative and quantitative review. Psychological Bulletin, 127(3), 376-407.
Publisher | Google Scholor - Kabigting Jr, F. J. (2021). The discovery and evolution of the big five of personality traits: A historical review. An Interdisciplinary Journal of Human Theory and Praxis, 4(3), 83-100.
Publisher | Google Scholor - Kamer, J. A., & Ishitani, T. T. (2021). First-year, nontraditional student retention at four-year institutions: How predictors of attrition vary across time. Journal of College Student Retention: Research, Theory & Practice, 23(3), 560-579.
Publisher | Google Scholor - Kannangara, C. S., Allen, R. E., Waugh, G., Nahar, N., Khan, S. Z. N., et al. (2018). All that glitters is not grit: Three studies of grit in university students. Frontiers in Psychology, 9(1539), 1-15.
Publisher | Google Scholor - Kelly, A. M., Townsend, K. W., Davis, S., Nouryan, L., Bostrom, M. P. G., & Felix, K. J. (2018). Comparative assessment of grit, conscientiousness, and self-control in applicants interviewing for residency positions and current orthopaedic surgery residents. Journal of Surgical Education, 75(3), 557-563.
Publisher | Google Scholor - Khedmatian, A., Naami, A. Z., Zarei, E., & Khalafie, A. (2022). Academic grit, academic flow and academic thriving: Mediating role of adaptive coping style. Iranian Evolutionary and Educational Psychology Journal, 4(2), 244-255.
Publisher | Google Scholor - Kim, Y., Chung, S., & So, J. (2019). Success expectancy: A mediator of the effects of source similarity and self-efficacy on health behavior intention. Health Communication, 35(9), 1063-1072.
Publisher | Google Scholor - Kim, J. Y., Kim, E., & Lee, I. (2021). Influence of self-esteem of middle school students for mental care on academic achievement: Based on the mediation effect of GRIT and academic enthusiasm. International Journal of Environmental Research and Public Health, 18(13), 1-13.
Publisher | Google Scholor - Kim, M. Y., & Lee, H. J. (2022). Does grit matter to employees’ quality of work life and quality of life? The case of the Korean public cector. Public Personnel Management, 51(1), 97-124.
Publisher | Google Scholor - Klein, R. J., & Robinson, M. D. (2019). Neuroticism as mental noise: Evidence from a continuous tracking task. Journal of Personality, 87(6), 1221-1233.
Publisher | Google Scholor - Kloep, M., & Hendry, L. B. (2014). Some ideas on the emerging future of developmental research. Journal of Adolescence, 37(8), 1541-1545.
Publisher | Google Scholor - Kotera, Y., Taylor, E., Fido, D., Williams, D., & Tsuda-McCaie, F. (2021). Motivation of UK graduate students in education: Self-compassion moderates pathway from extrinsic motivation to intrinsic motivation. Current Psychology, 1-14.
Publisher | Google Scholor - Kranefeld, I., & Blickle, G. (2021). Emotion recognition ability and career success: Assessing the roles of GMA and conscientiousness. Personality and Individual Differences, 168, 1-6.
Publisher | Google Scholor - Kwon, H. W. (2021). Are gritty people happier than others? Evidence from the United States and South Korea. Journal of Happiness Studies, 22, 2937-2959.
Publisher | Google Scholor - Laerd Statistics. (2020). Pearson’s product-moment correlation using SPSS Statistics. Statistical tutorials and software guides.
Publisher | Google Scholor - Locke, E. A., & Latham, G. P. (2013). Goal setting theory: The current state. In New Developments in Goal Setting and Task performance (pp. 623-630). Routledge.
Publisher | Google Scholor - Lund, T. (2012). Combining qualitative and quantitative approaches: Some arguments for mixed methods research. Scandinavian Journal of Educational Research, 56(2), 155-165.
Publisher | Google Scholor - Mahoney, J. (2010). After KKV: The new methodology of qualitative research. World Politics, 62(1), 120-147.
Publisher | Google Scholor - Malinauskas, R. K. (2017). Enhancing of self-efficacy in teacher education students. European Journal of Contemporary Education, 6(4), 732-738.
Publisher | Google Scholor - Malone, J. C., Liu, S. R., Vaillant, G. E., Rentz, D. M., et al. (2016). Midlife Eriksonian psychosocial development: Setting the stage for cognitive and emotional health in late life. Developmental Psychology, 52(3), 496-508.
Publisher | Google Scholor - Malureanu, A., Panisoara, G., & Lazar, I. (2021). The relationship between self-confidence, self-efficacy, grit, usefulness, and ease of use of elearning platforms in corporate training during the COVID-19 pandemic. Sustainability, 13(12), 1-20.
Publisher | Google Scholor - Maree, J. G. (2021). The psychosocial development theory of Erik Erikson: critical overview. Early Child Development and Care, 191(7-8), 1107-1121.
Publisher | Google Scholor - Marentes-Castillo, M., Castillo, I., Tomás, I., Zamarripa, J., & Alvarez, O. (2022). Understanding the antecedents of healthy and unhealthy weight control behaviours: Grit, motivation and self-control. Public Health Nutrition, 25(6), 1483-1491.
Publisher | Google Scholor - Marentes-Castillo, M., Zamarripa, J., & Castillo, I. (2019). Validation of the grit scale and the Treatment Self-Regulation Questionnaire (TSRQ) in the Mexican context. Revista Latinoamericana de Psicología, 51(1), 9-18.
Publisher | Google Scholor - Mayer, I. (2015). Qualitative research with a focus on qualitative data analysis. International Journal of Sales, Retailing and Marketing, 4(9), 53-67.
Publisher | Google Scholor - Montano, R. L. T. (2021). Thriving predicts grit through self-efficacy among Filipino students enrolled in online education: The moderating role of academic stress. Hellenic Journal of Psychology, 18(3), 271-286.
Publisher | Google Scholor - Mueller, B. A., Wolfe, M. T., & Syed, I. (2017). Passion and grit: An exploration of the pathways leading to venture success. Journal of Business Venturing, 32(3), 260-279.
Publisher | Google Scholor - Muenks, K., Wigfield, A., & Eccles, J. S. (2018). I can do this! The development and calibration of children’s expectations for success and competence beliefs. Developmental Review, 48, 24-39.
Publisher | Google Scholor - Murta, S. G., do Amaral Vinha, L. G., de Almeida Nobre-Sandoval, L., Santos Rocha, V.P., Duailibe, K.D., et al. (2021). Exploring the short-term effects of the Strengthening Families Program on Brazilian adolescents: A pre-experimental study. Drugs: Education, Prevention and Policy, 28(3), 267-277.
Publisher | Google Scholor - National Commission for the Protection of Human Subjects of Biomedical and Behavioral Research. (1978). The Belmont report: Ethical principles and guidelines for the protection of human subjects of research (DHEW Publication No. 78-0012).
Publisher | Google Scholor - Norman, G. (2010). Likert scales, levels of measurement and the “laws” of statistics. Advances in Health Sciences Education, 15(5),625 –632.
Publisher | Google Scholor - Ommering, B. W., van Blankenstein, F. M., van Diepen, M., & Dekker, F. W. (2021). Academic success experiences: promoting research motivation and Self-Efficacy beliefs among medical students. Teaching and Learning in Medicine, 33(4), 423-433.
Publisher | Google Scholor - Oriol, X., Miranda, R., Oyanedel, J. C., & Torres, J. (2017). The role of self-control and grit in domains of school success in students of primary and secondary school. Frontiers in Psychology, 8(1716),1-9.
Publisher | Google Scholor - Özer, E., Hamarta, E., & Deniz, M. E. (2016). Emotional intelligence, core self-evaluation, and life satisfaction. Psychology, 7(2), 145-153.
Publisher | Google Scholor - Pajares, F. (1996). Self-efficacy beliefs in academic settings. Review of Educational Research, 66(4), 543-578.
Publisher | Google Scholor - Palisoc, A. J. L., Matsumoto, R. R., Ho, J., Perry, P. J., et al. (2017). Relationship between grit with academic performance and attainment of postgraduate training in pharmacy students. American Journal of Pharmaceutical Education, 81(4). 1-11.
Publisher | Google Scholor - Park, J., & Park, M. (2016). Qualitative versus quantitative research methods: Discovery or justification? Journal of Marketing Thought, 3(1), 1-8.
Publisher | Google Scholor - Peltokorpi, V., & Michel, J. (2021). The moderating effect of core self‐evaluations between the relationships of work–family conflict and voluntary turnover, job promotions and physical health. Stress and Health, 37(1), 162-174.
Publisher | Google Scholor - Peña, P. A., & Duckworth, A. L. (2018). The effects of relative and absolute age in the measurement of grit from 9th to 12th grade. Economics of Education Review, 66, 183-190.
Publisher | Google Scholor - Piepiora, P., & Piepiora, Z. (2021). Personality determinants of success in men’s sports in the light of the big five. International Journal of Environmental Research and Public Health, 18(12), 1-10.
Publisher | Google Scholor - Pierce, J. L., & Gardner, D. G. (2009). Relationships of personality and job characteristics with organization‐based self‐esteem. Journal of Managerial Psychology, 24(5), 392-409.
Publisher | Google Scholor - Pleace, M., & Nicholls, N. (2022). Grit, motivation and university grades. South African Journal of Economics, 90(1), 21-36.
Publisher | Google Scholor - Polirstok, S. (2017). Strategies to improve academic achievement in secondary school students perspectives on grit and mindset. SAGE Open, 7(4), 1-9.
Publisher | Google Scholor - Priyohadi, N. D., Suhariadi, F. & Fajrianthi. (2019). Validity test for short Grit Scale (Grit-S). Duckworth on Indonesian millennials. Journal of Educational, Health and Community Psychology, 8(3), 594-618.
Publisher | Google Scholor - Prabowo, A. S., Nurlaela, L., Buditjahjanto, A., & Yundra, E. (2021). The role of self-efficacy and self-esteem in improving academic performance amongst aviation polytechnic’s Students. Journal of Technical Education and Training, 13(3), 20-28.
Publisher | Google Scholor - Putwain, D. W., Nicholson, L. J., Pekrun, R., Becker, S., & Symes, W. (2019). Expectancy of success, attainment value, engagement, and achievement: A moderated mediation analysis. Learning and Instruction, 60, 117-125.
Publisher | Google Scholor - Rak, C. F., & Patterson, L. E. (1996). Promoting resilience in at-risk children. Journal of Counseling and Development, 74(4), 368–373.
Publisher | Google Scholor - Raphiphatthana, B., Jose, P., & Salmon, K. (2018). Does dispositional mindfulness predict the development of grit? Journal of Individual Differences, 39(2), 76-87.
Publisher | Google Scholor - Reuning, K., & Plutzer, E. (2020). Valid vs. invalid straightlining: The complex relationship between straightlining and data quality. Survey Research Methods, 14(5), 439-459.
Publisher | Google Scholor - Rhodes, E., & Giovannetti, T. (2021). Grit and successful aging in older adults. Aging & Mental Health, 26(6), 1-8.
Publisher | Google Scholor - Robertson-Kraft, C., & Duckworth, A. L. (2014). True grit: Trait-level perseverance and passion for long-term goals predicts effectiveness and retention among novice teachers. Teachers College Record, 116(3), 1-27.
Publisher | Google Scholor - Rosopa, P. J., & Schroeder, A. N. (2009). Core self-evaluations interact with cognitive ability to predict academic achievement. Personality and Individual Differences, 47(8), 1003-1006.
Publisher | Google Scholor - Schmidt, F. T., Fleckenstein, J., Retelsdorf, J., Eskreis-Winkler, L., & Möller, J. (2017). Measuring Grit. European Journal of Psychological Assessment, 35(3), 436-447.
Publisher | Google Scholor - Schmitt, D. P., & Allik, J. (2005). Simultaneous administration of the Rosenberg self-esteem scale in 53 nations: Exploring the universal and culture-specific features of global self-esteem. Journal of Personality and Social Psychology, 89(4), 623–642.
Publisher | Google Scholor - Schunk, D. H. (1989). Self-efficacy and achievement behaviors. Educational Psychology Review, 1(3), 173-208.
Publisher | Google Scholor - Schunk, D. H. (1991). Self-efficacy and academic motivation. Educational Psychologist, 26(3-4), 207-231.
Publisher | Google Scholor - Schutte, J. W., & Hosch, H. M. (1996). Optimism, religiosity, and neuroticism: A cross-cultural study. Personality and Individual Differences 20(2), 239-244.
Publisher | Google Scholor - Schwartz, S. J., Donnellan, M. B., Ravert, R. D., Luyckx, K., & Zamboanga, B. L. (2013). Identity development, personality, and well-being in adolescence and emerging adulthood: Theory, research, and recent advances. In R. M. Lerner, M. A. Easterbrooks, J. Mistry, & I. B. Weiner (Eds.), Handbook of psychology: Developmental psychology (pp. 339–364). John Wiley & Sons, Inc.
Publisher | Google Scholor - Schwoerer, C. E., May, D. R., Hollensbe, E. C., & Mencl, J. (2005). General and specific self‐efficacy in the context of a training intervention to enhance performance expectancy. Human resource development quarterly, 16(1), 111-129.
Publisher | Google Scholor - Sciarra, D. T., & Whitson, M. L. (2007). Predictive factors in postsecondary educational attainment among Latinos. Professional School Counseling, 10(3), 307-316.
Publisher | Google Scholor - Shanahan, M. L., Fischer, I. C., & Rand, K. L. (2020). Hope, optimism, and affect as predictors and consequences of expectancies: The potential moderating roles of perceived control and success. Journal of Research in Personality, 84, 1-8.
Publisher | Google Scholor - Sharma, P. K., & Misra, R. K. (2017). Core self-evaluations scale: An empirical attestation among software professionals. Procedia Computer Science, 122, 79-85.
Publisher | Google Scholor - Shiloh, S., Peleg, S., & Nudelman, G. (2022). Core self-evaluations as resilience and risk factors of psychological distress during the COVID-19 pandemic. Psychology, Health & Medicine, 0(0) 1-15.
Publisher | Google Scholor - Sibarani, R. M. & Meilani, Y. F. (2019). Grit, self-regulated learning, self-determination theory and academic performance of generation. In Proceedings of the 2nd International Conference on Inclusive Business in the Changing World (ICIB 2019).
Publisher | Google Scholor - Sigmundsson, H. (2021). Passion, grit and mindset in the ages 14 to 77: Exploring relationship and gender differences. New Ideas in Psychology, 60, 1-8.
Publisher | Google Scholor - Sigmundsson, H., Haga, M., & Hermundsdottir, F. (2020). Passion, grit and mindset in young adults: Exploring the relationship and gender differences. New Ideas in Psychology, 59, 1-7.
Publisher | Google Scholor - Siyal, S., Saeed, M., Pahi, M. H., Solangi, R., & Xin, C. (2021). They can’t treat you well under abusive supervision: Investigating the impact of job satisfaction and extrinsic motivation on healthcare employees. Rationality and Society, 33(4), 401-423.
Publisher | Google Scholor - Smedema, S. M., Lee, D., & Bhattarai, M. (2022). An examination of the relationship of core self-evaluations and life satisfaction in college students with disabilities. Rehabilitation Counseling Bulletin, 65(2), 129-139.
Publisher | Google Scholor - Smithers, L. G., Sawyer, A. C., Chittleborough, C. R., Davies, N. M., Davey Smith, G., & Lynch, J. W. (2018). A systematic review and meta-analysis of effects of early life non-cognitive skills on academic, psychosocial, cognitive and health outcomes. Nature Human Behaviour, 2(11), 867-880.
Publisher | Google Scholor - Steed, L. G. (2002). A psychometric comparison of four measures of hope and optimism. Educational and Psychological Measurement, 62(3), 466-482.
Publisher | Google Scholor - Stratton, S. (2021). Population research: Convenience sampling strategies. Prehospital and Disaster Medicine, 36(4), 373-374.
Publisher | Google Scholor - Sulla, F., Renati, R., Bonfiglio, S., & Rollo, D. (2018). Italian students and the Grit-S: A self-report questionnaire for measuring perseverance and passion for long-term goals. In 2018 IEEE International Symposium on Medical Measurements and Applications (MeMeA) (pp. 1-5). Parma, Italy.
Publisher | Google Scholor - Sun, X., Nancekivell, S., Gelman, S. A., & Shah, P. (2021). Growth mindset and academic outcomes: a comparison of US and Chinese students. Nature Partner Journals Science of Learning, 6(1), 1-9.
Publisher | Google Scholor - Suyono, J., & Mudjanarko, S. (2017). Motivation engineering to employee by employees Abraham Maslow theory. Journal of Education, Teaching and Learning, 2(1), 27-33.
Publisher | Google Scholor - Suzuki, Y., Tamesue, D., Asahi, K., & Ishikawa, Y. (2015). Grit and work engagement: A cross-sectional study. Plos One, 10(9),1-11.
Publisher | Google Scholor - Taheri, L., Boroujeni, A. Z., Kargar Jahromi, M., Charkhandaz, M., & Hojat, M. (2015). Effect of streptokinase on reperfusion after acute myocardial infarction and its complications: An ex-post facto study. Global Journal of Health Science, 7(4), 184–189.
Publisher | Google Scholor - Tee, D., Shearer, D., & Roderique-Davies, G. (2017). The client as active ingredient: ‘Core self-evaluations’ as predictors of coaching outcome variance. International Coaching Psychology Review, 12(2), 125-132.
Publisher | Google Scholor - Theofanidis, D., & Fountouki, A. (2018). Limitations and delimitations in the research process. Perioperative Nursing, 7(3), 155-163.
Publisher | Google Scholor - Usher, E. L., Li, C. R., Butz, A. R., & Rojas, J. P. (2019). Perseverant grit and self-efficacy: Are both essential for children’s academic success? Journal of Educational Psychology, 111(5), 877-902.
Publisher | Google Scholor - Usman, M., Liu, Y., Li, H., Zhang, J., Ghani, U., & Gul, H. (2021). Enabling the engine of workplace thriving through servant leadership: The moderating role of core self-evaluations. Journal of Management & Organization, 27(3), 582-600.
Publisher | Google Scholor - Vainio, M., & Daukantaitė, D. (2016). Grit and different aspects of well-being: Direct and indirect relationships via sense of coherence and authenticity. Journal of Happiness Studies, 17(5), 2119–2147.
Publisher | Google Scholor - Vallerand, R. J. (2008). On the psychology of passion: In search of what makes people's lives most worth living. Canadian Psychology/Psychologie Canadienne, 49(1), 1-13.
Publisher | Google Scholor - Valls, V., González-Romá, V., Hernandez, A., & Rocabert, E. (2020). Proactive personality and early employment outcomes: The mediating role of career planning and the moderator role of core self-evaluations. Journal of Vocational Behavior, 119, 1-15.
Publisher | Google Scholor - Vazsonyi, A. T., Ksinan, A. J., Jiskrova, G. K., Mikuška, J., Javakhishvili, M., & Cui, G. (2019). To grit or not to grit, that is the question! Journal of Research in Personality, 78, 215-226.
Publisher | Google Scholor - Verner-Filion, J., Schellenberg, B. J., Holding, A. C., & Koestner, R. (2020). Passion and grit in the pursuit of long-term personal goals in college students. Learning and Individual Differences, 83, 1-9.
Publisher | Google Scholor - Victorson, D., Barocas, J., Song, J., & Cella, D. (2008). Reliability across studies from the functional assessment of cancer therapy-general (FACT-G) and its subscales: a reliability generalization. Quality of Life Research, 17, 1137-1146.
Publisher | Google Scholor - Vinson, J. M., McMillan, J. J., & Schleifer, L. F. (2022). An investigation of the association of grit with performance in accounting courses. Journal of Accounting Education, 59, 1-16.
Publisher | Google Scholor - Von Culin, K. R., Tsukayama, E., & Duckworth, A. L. (2014). Unpacking grit: Motivational correlates of perseverance and passion for long-term goals. The Journal of Positive Psychology, 9, 306-312.
Publisher | Google Scholor - Wang, Y., Derakhshan, A., & Zhang, L. J. (2021). Researching and practicing positive psychology in second/foreign language learning and teaching: the past, current status and future directions. Frontiers in Psychology, 12, 1-10.
Publisher | Google Scholor - Wang, Y., Rocabado, G. A., Lewis, J. E., & Lewis, S. E. (2021). Prompts to promote success: Evaluating utility value and growth mindset interventions on general chemistry students’ attitude and academic performance. Journal of Chemical Education, 98(5), 1476-1488.
Publisher | Google Scholor - Wanzer, D., Postlewaite, E., & Zargarpour, N. (2019). Relationships among noncognitive factors and academic performance: Testing the University of Chicago Consortium on School Research model. AERA Open, 5(4), 1-20.
Publisher | Google Scholor - Ward, E. A. (2001). Expectancies for success as a multidimensional construct among employed adults. Educational and Psychological Measurement, 61(5), 818-826.
Publisher | Google Scholor - Weisskirch, R. S. (2019). Grit applied within: Identity and well-being. Identity: An International Journal of Theory and Research, 19(2), 98-108.
Publisher | Google Scholor - Wu, H., & Leung, S. O. (2017). Can Likert scales be treated as interval scales?—A simulation study. Journal of Social Service Research, 43(4), 527-532.
Publisher | Google Scholor - Xing, L., Sun J-M, Jepsen D, Zhang Y. (2021). Supervisor negative feedback and employee motivation to learn: An attribution perspective. Human Relations, 00(0), 1-31.
Publisher | Google Scholor - Yeager, D. S., Hanselman, P., Walton, G. M., Murray, J. S., Crosnoe, R., Muller, et al. (2019). A national experiment reveals where a growth mindset improves achievement. Nature, 573(7774), 364-369.
Publisher | Google Scholor - Yoo, K., Lee, K. H. (2019). Core self-evaluation and work engagement: Moderated mediation model of career adaptability and job insecurity. Frontiers in Psychology, 10(2093), 1-9.
Publisher | Google Scholor - Yusoff, M. S. B., Hadie, S. N. H., & Yasin, M. A. M. (2021). The roles of emotional intelligence, neuroticism, and academic stress on the relationship between psychological distress and burnout in medical students. BMC medical education, 21(1), 1-10.
Publisher | Google Scholor - Zhang, M. X., Mou, N. L., Tong, K. K., & Wu, A. (2018). Investigation of the effects of purpose in life, grit, gratitude, and school belonging on mental distress among Chinese emerging adults. International Journal of Environmental Research and Public Health, 15(2147), 1-12.
Publisher | Google Scholor - Zheng, X., Wu, B., Li, C. S., Zhang, P., & Tang, N. (2021). Reversing the pollyanna effect: The curvilinear relationship between core self-evaluation and perceived social acceptance. Journal of Business and Psychology, 36(1), 103-115.
Publisher | Google Scholor - Zisman, C., & Ganzach, Y. (2021). In a representative sample grit has a negligible effect on educational and economic success compared to intelligence. Social Psychological and Personality Science, 12(3), 296-303.
Publisher | Google Scholor