
Research Article
Trends in Musculoskeletal Injuries Due to Firearms in Pediatric Patients: A Retrospective Study
1SUNY Upstate College of Medicine, Syracuse, NY, United States.
2Department of Orthopedic Surgery, SUNY Upstate Medical University, Syracuse, NY, United States.
*Corresponding Author: Rajin Shahriar, Department of Orthopedic Surgery, SUNY Upstate Medical University, Syracuse, NY, United States.
Citation: Saif N, Wentlent Z., Shahriar R. (2023). Trends in Musculoskeletal Injuries Due to Firearms in Pediatric Patients: A Retrospective Study. Journal of BioMed Research and Reports, BioRes Scientia Publishers. 5(1):1-9. DOI: 10.59657/2837-4681.brs.24.089
Copyright: © 2024 D.K. Rajin Shahriar, this is an open-access article distributed under the terms of the Creative Commons Attribution License, which permits unrestricted use, distribution, and reproduction in any medium, provided the original author and source are credited.
Received: May 29, 2024 | Accepted: June 12, 2024 | Published: June 20, 2024
Abstract
Background: Firearm injuries (FIs) are a substantial cause of mortality and morbidity in children. As physicians may have a role in preventing these injuries, understanding the epidemiology and identifiable risk factors associated with these injuries is important. The primary objective of this study is to assess for longitudinal trends in demographics and circumstance of injury (e.g., assault, accident, self-inflicted) in pediatric and adolescent FIs across different geographical regions in the United States. Secondary objectives included assessing the severity of outcomes and quality-of-care measures based on the nature of injury, including anatomical location and the presence of concomitant nerve injury.
Methods: Data was utilized from admissions between 1997-2019 available in Kids’ Inpatient Database (KID), a nationwide database of pediatric and adolescent inpatient care admissions. All patients aged 20-years-old (y.o.) or younger with a firearm-associated injury were included in our study. Multi-level generalized linear models were employed to evaluate differences in categorical characteristics (e.g., race, circumstance of injury, geographical region) across time points.
Results: The majority of FIs in our study were 16-20 y.o., with over half due to assaults. Between 2000-2019, the probability of an FI due to an accident nearly quadrupled in Black and Hispanic patients. Between 2000-2019, the number of FI admissions in the Northeast decreased from .75 to .64, while the Midwest increased from .16 to 1.02 per, 100,000 people.
Conclusions: Our data indicates significant heterogeneity in the pattern of musculoskeletal injuries resulting from FIs. Recognizing this may allow physicians to improve counseling for patients and advocate for the best policies within the areas they serve. Future research should assess the efficacy of provider specific programs geared towards preventing these injuries.
Keywords: firearms; fractures; epidemiology
Introduction
Firearm injuries (FIs) are a substantial cause of mortality and morbidity in children. From 2012 to 2014, there were nearly 1,300 deaths and over 17,000 injuries to pediatric and adolescent patients due to firearms [2]. Unfortunately, the prevalence of firearm suicides and non-fatal firearm assaults have reached their highest rates in over 20 years [1]. For children aged one to four, unintentional firearm deaths rose an average of 4.9 percentage each year from 1999-2018 [3]. As physicians may have a role in preventing these injuries, understanding the epidemiology and identifiable risk factors associated with these injuries is important. Additionally, these injuries account for a considerable percentage of national healthcare costs, with FIs reported to result in a lifetime medical and productivity cost of $48 to $175 billion dollars per year [4]. Therefore, there is a large unmet need for effective interventions that aim to prevent these injuries. Current research on FIs in children demonstrates certain demographical subgroups are disproportionately affected. For example, a study found that between 2012-2014, males accounted for 84% of non-fatal FIs, and African American children died due to FIs at higher rates (4.1 deaths per 100,000 children) compared to White children (0.4 deaths per 100,000 children) [2, 5]. Between 2003-2012, the incidence of firearm-related fractures increased an average of 31% in patients younger than 20 y.o. [5]. Overall, the existing research has shed light on the epidemiological trends that exist on FI admissions and its increased prevalence, and our study aims to build upon this growing body of evidence.
The Kids’ Inpatient Database (KID) is a nationwide database of pediatric and adolescent inpatient care admissions released by the Agency for Healthcare Research & Quality and is the largest pediatric inpatient database in the United States [6]. Using KID, our study includes 20+ years of nationwide data to analyze trends in FIs over time, assessing how FI rates varied across race, gender, geographic region, and circumstance of FI. Patient outcomes were also evaluated across different injury characterizations, including the presence of fracture. The primary aim of this study is to evaluate the demographic trends in musculoskeletal injuries resulting from FIs in pediatric and adolescent populations from 1997-2019. The scope of research was focused on musculoskeletal injuries to determine whether there were epidemiological or circumstantial factors that were associated with types of injury, and thus could inform more targeted intervention practices. The secondary aim of this study included three components. First, to analyze if the circumstance of FIs changed over time across different U.S. geographic regions and races. Second, to identify changes in overall incidence of FIs across different U.S regions over time. Third, to determine if there were differences in quality-of-care measures in pediatric FIs that resulted in fracture.
Methods
Data Source
The most-recently released KID included data collected every three years (1997, 2000, 2003, 2006, 2009, 2012, 2016, and 2019) [6]. Admissions in KID were considered relevant to the study aim based on the following inclusion criteria: (1) injuries due to a firearm per external cause of injury code (E-code), (2) diagnosis of a musculoskeletal injury per International Classification of Diseases Ninth or Tenth Edition (ICD-9 or 10), and (3) patient age of 20 y.o. or younger. Exclusion criteria for our study included: (1) patient age not listed, (2) admissions with no E-code related to firearms, and (3) admissions with no E-codes. The final dataset included a total of 21,123 patients who suffered musculoskeletal injuries due to firearms.
Outcome Measures
Epidemiological characteristics that were assessed included sex, race, age, socioeconomic status, expected primary payer, admission month, type of injury, body part injured, patient location, disposition of patient, and circumstance of injury. Quality-of-care (QOC) measures included length of stay (LOS), number of procedures, number of diagnoses, length of time from admission to first procedure, death during hospitalization, severity of injury, and All Patient Refined-Diagnosis Related Group (APR-DRG) risk of mortality, a score developed by 3M to analyze outcomes using discharge diagnoses, patient ages, and preexisting conditions [7].
Statistical Analysis
Multi-level generalized linear models were employed to evaluate differences in categorical characteristics (e.g., race, gender, circumstance of injury, U.S. geographical region, physician-rated severity of injury, physician-rated risk of mortality) across time points. Timepoints were separated as 1997-2000, 2003-2012 (for comparison against results published by Blumberg et al.), 2016, and 2019 [5]. Interactions were assessed using the Wald test. Bonferroni corrections were employed to account for multiplicity. P values < 0.05 were considered a statistically significant difference. Incidence rates accounted for change in populations over time, as measured by the U.S. Census Bureau [8]. Analyses was performed using Rstudio [9].
Results
Demographics of FIs in the Pediatric Population from 1997-2019
Between 1997-2019, there were 21,123 pediatric admissions due to FI. Overall, 83.9% were in the 16-20 age group and 89.1% of patients were male. A majority of patients were Black (55.7%), followed by Hispanic (20.7%), and White/Caucasian (18.0%). A majority of patients were located within a central county or city (population >1,000,000) (54.3%), and 84.2% of patients were admitted to an urban teaching hospital. The most pediatric FIs occurred in the South region (38.2%), followed by the West (25.5%). See Table 1 for additional demographics.
Table 1: Cohort Demographics
| Year(s) | Overall | ||||
| Variables | 1997-2000 | 2003-2006 | 2009-2012 | 2016-2019 | 1997-2019 (total) |
| Number of patients with firearm injuries | 8129 | 10909 | 6147 | 5643 | 43513 |
| Number of firearm patients with MSK trauma | 3115 (38.3%) | 5224 (47.9%) | 6075(47.9%) | 3265(57.9%) | 21123 (48.5%) |
| Race | |||||
| White | 448 (14.4%) | 657 (12.6%) | 984(16.2%) | 1209(18.0%) | 3298 (15.6%) |
| Black | 1237 (39.7%) | 2056 (39.4%) | 3195 (52.6%) | 3747(55.9%) | 10235 (48.5%) |
| Hispanic | 696 (22.3%) | 941 (18.0%) | 1112(18.3%) | 1053(15.7%) | 3802 (18.0%) |
| Asian | 61 (2.0%) | 60 (1.1%) | 51 (0.8%) | 47 (0.7%) | 219 (1.0%) |
| Native American | 19 (0.6%) | 21 (0.4%) | 34 (0.6%) | 44 (0.7%) | 118 (0.6%) |
| Other | 67 (2.2%) | 141 (2.7%) | 199 (3.3%) | 292 (4.4%) | 699 (3.3%) |
| Not listed | 587 (18.8%) | 1348 (25.8%) | 500(8.2%) | 317 (4.7%) | 2752 (13.0%) |
| Gender | |||||
| Male | 2797 (89.8%) | 4731 (90.6%) | 5431(89.4%) | 5865(87.4%) | 18824 (89.1%) |
| Female | 318 (10.2%) | 493 (9.4%) | 644(10.6%) | 844(12.6%) | 2299 (10.9%) |
| Not listed | 0 (0.0%) | 0 (0.0%) | 0 (0.0%) | 0 (0.0%) | 0 (0.0%) |
| Insurance Status | |||||
| Medicare | 8 (0.3%) | 3 (0.1%) | 20 (0.3%) | 15 (0.2%) | 46 (0.2%) |
| Medicaid | 1242 (39.9%) | 2357 (45.1%) | 2964(48.8%) | 3977(59.3%) | 10540 (49.9%) |
| Private Insurance | 992 (31.8%) | 1344 (25.7%) | 1476(24.3%) | 1485(22.1%) | 5297 (25.1%) |
| Self-pay | 603 (19.4%) | 1006 (19.3%) | 1009(16.6%) | 807 (12.0%) | 3425 (16.2%) |
| No charge | 41 (1.3%) | 78 (1.5%) | 86 (1.4%) | 57 (0.8%) | 262 (1.2%) |
| Other | 209 (6.7%) | 403 (7.7%) | 496 (8.2%) | 355 (5.3%) | 1463 (6.9%) |
| Not listed | 20 (0.6%) | 33 (0.6%) | 24 (0.4%) | 13 (0.2%) | 90 (0.4%) |
| Region | |||||
| Northeast | 700 (22.5%) | 632 (12.1%) | 999(16.4%) | 784(11.7%) | 3115 (14.7%) |
| Midwest | 387 (12.4%) | 1247 (23.9%) | 1497(24.6%) | 1507(22.5%) | 4638 (22.0%) |
| South | 808 (25.9%) | 1676 (32.1%) | 2093(34.5%) | 3184(47.5%) | 7761 (36.7%) |
| West | 1220 (39.2%) | 1669 (31.9%) | 1486(24.5%) | 1234(18.4%) | 5609 (26.6%) |
| Percentile of Median Income | |||||
| 1-25th | 1231 (39.5%) | 2600 (49.8%) | 3142(51.7%) | 3610(53.8%) | 10583 (50.1%) |
| 25th-50th | 831 (26.7%) | 1239 (23.7%) | 1477 (24.3%) | 1443 (21.5%) | 4990 (23.6%) |
| 50-75th | 496 (15.9%) | 819 (15.7%) | 843 (13.9%) | 1072 (16.0%) | 3230 (15.3%) |
| 75-100th | 432 (13.9%) | 421 (8.1%) | 428 (7.0%) | 490 (7.3%) | 1771 (8.4%) |
| Not listed | 125 (4.0%) | 145 (2.8%) | 185 (3.0%) | 94 (1.4%) | 549 (2.6%) |
Categorization of FIs in the Pediatric Population from 1997-2019
The most common circumstance of injury was assault (59.9%), followed by accidental (29.6%), and self-inflicted (4.2%)—5.3% of cases were of undetermined cause. 51.6% of admissions did not include a bone fracture, while 48.4% did. Of these, fractures of the lower limb were most common (29.9%), followed by the upper limb (24.8%), the neck and thorax (24.6%), and the skull (20.7%). The average APR-DRG risk of mortality for all admissions was 1.69 (1 = minor risk, 4 = extreme risk), with 64.5% of patients classified as a minor risk for death. The average rated severity of injury for all admissions was 2.43 (1 = minor loss of function, 4 = extreme loss of function), with only 20.8% of patients having minor loss of function. Moderate loss of function was most common (35.3%), followed by major loss (24.2%) and extreme loss (19.8%).
Changes in Incidence Over Time, by Region (Figure 1)
Between 2000-2019, the number of FI admissions in the Northeast decreased from 1.23 to 1.09 per 100,000 people (p=0.002). FI admissions in the West decreased from 1.69 to 1.23 per 100,000 people, (p=0.002). FI admissions in the Midwest increased from .27 to 1.83 per 100,000 people (p less than 0.001). FI admissions in the South increased from .99 to 2.24 per 100,000 people, (p less than 0.001). The change in incidence was significantly greater in the South compared to the Northeast (ratio = 2.59, p less than 0.001) and the West (ratio = 3.19, p less than 0.001). The change in incidence was significantly greater in the Midwest compared to the Northeast (ratio =7.14, p less than 0.001) and the West (ratio = 8.78, p less than 0.001). Between 2016 and 2019, the change in incidence was significantly greater in the South compared to the Northeast (ratio = 1.27, p=0.001), West (ratio =1.32, p less than 0.001), and the Midwest (ratio =1.22, p=0.002).
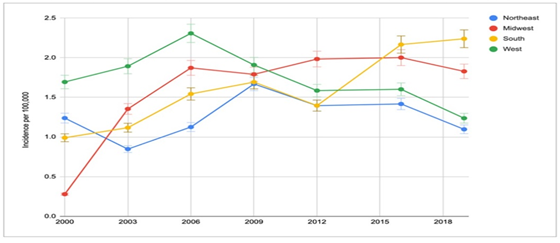
Figure 1: Changes in Incidence of Pediatric FIs Across U.S. Geographic Regions Over Time.
Changes in Circumstance of Injury Over Time, by Region (Figure 2)
Geographic U.S. Region (all ages) (Figure 2A)
Compared to 2003-2012, rates of accidental FIs increased in all four regions (all p less than 0.001) in 2016 and 2019, with the South seeing the largest increase in accidental FIs (ratio = 2.16 [2.01-2.32], p less than 0.001). Between 2016-2019, all four regions saw a significant decrease in FIs due to assault (all p less than 0.001), with the Northeast seeing the largest decrease (ratio = 0.51 [0.32-0.71], p less than 0.001).
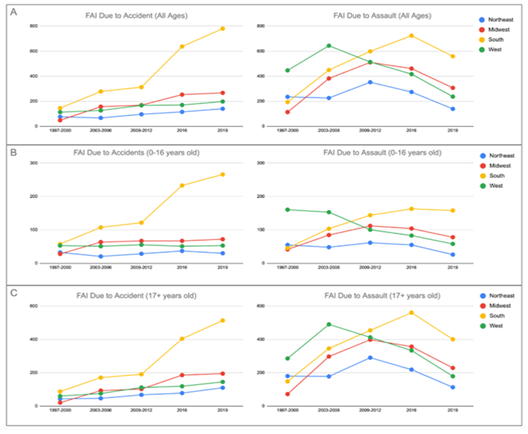
Figure 2: Changes in Circumstance of Injury Across U.S. Geographic Regions Over Time. Legend: Each point represents the average number of FIs during that timepoint. A) Change in FIs due to accident or assault in different U.S. regions across all ages (0-20 y.o.). B) Change in FIs due to accident or assault in different U.S. regions in patients less than 17 y.o. C) Change in FIs due to accident or assault in different U.S. regions in patients at least 17 y.o.
Geographic U.S. Region (age-stratified) (Figures 2B, 2C)
In patients 17+ y.o., all regions saw an increased rate of accidental FIs (all p less than 0.001) when comparing 2003-2012 and 2016-2019. In patients less than 17 y.o., accidental FIs significantly decreased in the North (ratio=0.81 [0.70-0.92], p=0.009), increased in the South (ratio-2.84 [2.53-3.15], p less than 0.001), and did not significantly change in the West (0.97 [0.72-1.23], p=0.319), and Midwest (ratio=1.01 [0.78-1.24], p=0.319).
In patients 17+ y.o., the Northeast and West saw decreased rates of FIs due to assault (p less than 0.001), while the Midwest and South saw increased rates (p less than 0.001). In patients less than 17 y.o., only the South saw increased rates of FI due to assault (1.38 [1.09-1.67], p=0.009) while all other regions saw no change (p less than 0.05).
Changes in Circumstance of Injury Over Time, by Race (Figure 3)
Race (all ages) (Figure 3A)
Compared to 2003-2012, the rates of accidental injury increased in White (p less than 0.001), Black (p less than 0 .001), Hispanic (p less than 0.001), and Asian (p less than 0.001) patients in both 2016 and 2019. In 2019, the probability that Black FI admission were due to accident rather than assault nearly quadrupled (ratio=3.94 [2.98-4.90], p less than 0.001), as did Hispanic FI admissions (ratio=3.62 [3.01 -4.23], p less than 0.001), both of which were significantly greater than White FI admissions (ratio=1.64 [1.31-1.98], p less than 0.001).
Race (age-stratified) (Figures 3B, 3C)
Between 2016-2019, White patients 17+ y.o. saw increased rates of FIs due to accident (p less than 0.001) compared to 2003-12. However, White patients less than 17 y.o. saw no significant change in rates of FI due to accident (ratio=1.08 [0.67-1.49], p=0.295) or assault (ratio=1.21 [0.87-1.55], p=0.219) in the same time frame. Between 2016-2019, Black patients 17+ y.o. saw an increase in FIs due to accident (ratio=2.75 [2.12-3.38], p less than 0.001) and a decrease in FIs due to assault (ratio=0.74 [0.58-0.90], p=0.009) compared to 2003-2012. Black patients less than 17 y.o. also saw higher rates of FI due to accident (ratio=2.98 [2.67-3.29], p less than 0.001), and no change in FIs due to assault (ratio=0.98 [0.75-1.21], p=0.193). In Hispanic admissions, patients 17+ y.o. saw an increase in FIs due to accident (ratio=2.24 [1.99-2.49], p less than 0.001) and a decreased assault rate (ratio=0.54 [0.33-0.75], p=0.001). Similarly, patients less than 17 y.o. also had an increased accident rate (ratio=1.91 [1.54-2.28], p less than 0.001) and decreased assault rate (ratio=0.72 [0.49-0.95], p=0.031).
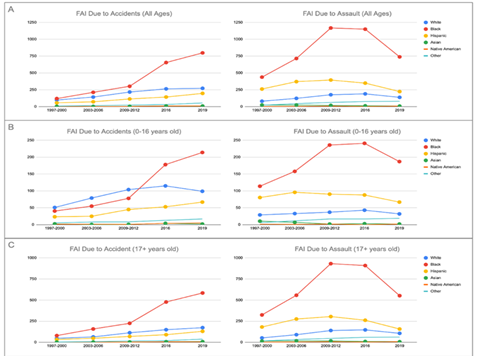
Figure 3: Changes in Circumstance of Injury Across Different Races Over Time. Legend: Each point represents the average number of FIs during that timepoint. A) Change in FIs due to accident or assault in different races across all ages (0-20 y.o.). B) Change in FIs due to accident or assault in different races in patients less than 17 y.o. C) Change in FIs due to accident or assault in different races in patients at least 17 y.o.
Difference in Quality-of-Care Measures Dependent on Nature of Injury
Fractures versus Non-fracture Musculoskeletal Injuries
Thorax and abdomen injuries with a fracture had a statistically increased LOS (difference=3.74, p less than 0.001), number of procedures (difference=0.6, p=0.006), number of diagnoses (difference=2.36, p=0.001) and cost (difference=$38,652, p less than 0.001), when compared to neck and thorax injuries without a fracture. Fractures were associated with a longer interval of admission to the first procedure (difference 0.50, p=0.016). Upper limb injuries with a fracture had a statistically increased LOS (difference=1.67, p less than 0.001), number of procedures (difference=1.48, p less than 0.001), number of diagnoses (difference=1.3, p=0.021), and cost (difference=$31,338, p less than 0.001), when compared to upper limb injuries without a fracture. Lower limb injuries with a fracture had a statistically increased number of procedures (difference=0.64, p=0.007), number of diagnoses (difference=0.79, p=0.045), and cost (difference=$21,324, p less than 0.001), when compared to skull injuries without a fracture. There was no significant difference in LOS between fracture and non-fracture injuries (difference=0.56, p=0.121). See Table 2 for additional information. See Supplementary Materials for Appendix A and Table S1, which discuss differences in quality-of-care measures with respect to fractures with and without nerve injury.
Table 2: Comparison of Quality-of-Care Measures in Fracture and Non-fracture Injuries
| Location and Injury | N | LOS (95% CI) | # of procedures | # of diagnoses | days admission to procedure | Cost | |
| Head | Single Fracture | 3212 | 7.41(6.94-7.89) | 4.38(4.25-4.51) | 7.65(7.47-7.84) | 0.96(0.84-1.08) | 101830.30 (96636.31-107024.90) |
| Vault/Base | 2043 | 7.21(6.44-7.98) | 4.42(4.22-4.62) | 9.58(9.27-9.89) | 1.08(0.68-1.48) | 120475.92(111533.54-129418.30) | |
| Facial bones | 909 | 7.22(6.6-7.85) | 4.63(4.38-4.87) | 6.18(5.91-6.44) | 1.29(1.10-1.49) | 80353.11(72916.79-87789.43) | |
| Other | 260 | 7.53(4.8-10.25) | 4.19(3.75-4.64) | 6.54(5.94-7.15) | 0.67(0.31-1.02) | 82982.13(67509.45-98454.81) | |
| No Fracture | 3478 | 4.13(3.84-4.41) | 2.69(2.60-2.79) | 5.39(5.26-5.53) | 0.66(0.55-0.76) | 50212.14(46634.07-53791.21) | |
| Single Fracture vs No Fracture | 3.28(p less than 0.001) | 1.69(p less than 0.001) | 2.26(p=0.011) | 0.3(p=0.091) | 51618.16(p less than 0.001) | ||
| Thorax & Abdomen | Single Fracture | 3871 | 9.78(9.39-10.2) | 3.98(3.85-4.11) | 8.02(7.86-8.18) | 1.01(0.88-1.13) | 105405.35(99464.30-111345.40) |
| Vertebral column | 2014 | 12.4(11.74-13.06) | 4.41(4.22-4.60) | 9.39(9.15-9.62) | 1.41(1.21-1.62) | 136103.44(125864.30-146342.59) | |
| Ribs/Sternum | 1181 | 7.41(6.95-7.88) | 3.50(3.29-3.70) | 7.06(6.82-7.3) | 0.68(0.51-0.86) | 78991.82(71854.79-86128.84) | |
| Pelvis | 676 | 6.11(5.57-6.65) | 3.53(3.25-3.82) | 5.64(5.35-5.94) | 0.30(0.22-0.38) | 60157.65(54237.98-66077.32) | |
| No Fracture | 14174 | 6.04(5.88-6.19) | 3.38(3.32-3.43) | 5.66(5.59-5.73) | 0.51(0.46-0.56) | 66753.21(64609.09-68896.33) | |
| Single Fracture vs No Fracture | 3.74(p less than 0.001) | 0.6(p=0.009) | 2.36(p=0.001) | 0.5(p=0.016) | 38652.14(p less than 0.001) | ||
| Upper Limb | Single Fracture | 3951 | 4.04(3.84-4.24) | 3.07(2.98-3.16) | 5.07(4.95-5.2) | 0.81(0.74-0.88) | 55705.22(51987.12-59423.32) |
| Clavicle | 464 | 4.9(4.32-5.49) | 3.01(2.71-3.32) | 9.05(8.64-9.47) | 0.71(0.56-0.86) | 89748.46(78820.14-100676.78) | |
| Scapula | 255 | 3.55(2.93-4.18) | 2.03(1.70-2.36) | 4.65(4.28-5.02) | 0.50(0.30-0.71) | 40011.59(31858.57-48164.63) | |
| Humerus | 823 | 4.35(3.94-4.75) | 2.71(2.51-2.91) | 4.14(3.92-4.37) | 0.99(0.79-1.19) | 56020.33(48894.41-63146.26) | |
| Radius/Ulna | 1106 | 4.56(4.07-5.05) | 3.29(3.11-3.47) | 4.74(4.53-4.95) | 1.00(0.85-1.15) | 61891.82(51680.42-72103.21) | |
| Wrist/Hand/Fingers | 1303 | 3.19(2.96-3.42) | 3.33(3.18-3.48) | 4.61(4.42-4.8) | 0.63(0.55-0.71) | 39865.57(36797.98-42933.15) | |
| No Fracture | 1582 | 2.37(2.2-2.55) | 1.59(1.49-1.68) | 3.77(3.63-3.91) | 0.53(0.44-0.63) | 24366.78(22515.91-26217.87) | |
| Single Fracture vs No Fracture | 1.67(p<0> | 1.48(p<0> | 1.3(p=0.021) | 0.28(p=0.311) | 31338.44(p<0> | ||
| Lower Limb | Single Fracture | 6093 | 4.62(4.47-4.77) | 2.85(2.78-2.92) | 4.33(4.25-4.42) | 0.86(0.80-0.92) | 58792.32(56437.09-61148.54) |
| Femur | 2452 | 5.05(4.81-5.29) | 2.88(2.77-2.99) | 4.61(4.47-4.74) | 0.82(0.72-0.91) | 70428.25(66478.78-74377.72) | |
| Patella | 642 | 4.29(3.89-4.68) | 3.28(3.01-3.56) | 6.64(6.31-6.97) | 0.77(0.63-0.91) | 81743.99(72456.70-91031.27) | |
| Tibia/Fibula | 1504 | 4.93(4.57-5.29) | 2.89(2.75-3.04) | 3.66(3.52-3.81) | 1.02(0.87-1.17) | 52442.48(47761.14-57123.82) | |
| Ankle | 322 | 3.82(3.24-4.39) | 2.61(2.30-2.91) | 3.15(2.88-3.41) | 0.89(0.62-1.16) | 33861.88(27431.15-40292.61) | |
| Foot/Toes | 1173 | 3.75(3.47-4.03) | 2.56(2.43-2.69) | 3.68(3.54-3.83) | 0.80(0.69-0.92) | 35035.47(32030.84-38040.10) | |
| No Fracture | 2294 | 4.06(3.72-4.4) | 2.21(2.10-2.31) | 3.54(3.42-3.65) | 0.88(0.74-1.03) | 37467.71(34357.57-40576.95) | |
| Single Fracture vs No Fracture | 0.56(p=0.121) | 0.64(p=0.007) | 0.79(p=0.045) | 0.02(p=0.619) | 21324.61(p less than 0.001) | ||
Discussion
We found that in 2019, older pediatric minority populations, specifically Black and Hispanic patients 17-20 y.o., saw significantly reduced assault-related FIs compared to prior years. This may suggest that programs established to reduce firearm-related assaults in minority populations have been effective. For example, “Becoming a Man”, a social program that utilized cognitive behavioral therapy to counsel youth in Chicago who were considered at higher risk for firearm violence, demonstrated a >45% reduction in violent crime arrests and a 12-19% increase in school graduation rates [10]. Although the nature of our study is unable to explain the reduction in assault-related FIs in minorities, this finding is promising, and further research is warranted to assess the effectiveness of similar programs in specifically minority adolescent populations. Nevertheless, our study found that FIs due to accidents have increased at a significantly higher rate in minority populations compared to White populations, more-than-tripling and more-than-doubling in Black and Hispanic pediatric populations, respectively. Substantial research and social efforts have been made to implement safe-storage measures and practices in the homes of gun owners [11,12]. It is unclear whether these efforts have reached minority gun owner populations compared to Whites. This may highlight the complexity that lies in implementing firearm safety and broad-scale preventative programs, and interventions tailored to approach communities of different ages and demographic composition may be warranted. Additionally, our study suggests that gun violence prevention and gun safety are complex issues that require strong consideration of several factors, including but not limited to age, race, and geography. Between 2000-2019, FI incidence rates have significantly decreased in both the Northeast and West geographic regions, with assault-related FIs decreasing by more-than-half in both regions. However, in 2016 and 2019, FI incidence rates significantly increased in the South, with a significant increase in accident-related FIs and smaller decrease in assault-related FIs compared to other U.S. regions. Some municipal programs have shown promise in addressing local issues relating to gun violence. For instance, Boston, MA ran a city-sponsored program named “Operation Ceasefire”, where law enforcement collaborated with local organizations to curb firearm trafficking and enforce measures to deter firearm use by gang members; this led to a 68 percemt decrease in firearm violence in one year [13].
Given the positive impact programs like “Operation Ceasefire” and “Becoming a Man” have had on their communities, coupled with our research showing a significant variance of FIs across the United States in both who is being affected and how they’re being affected, it stands to reason those local targeted interventions may be more impactful than national programs. In fact, large national programs may be counter-productive, as they may end up neglecting the members of these individual communities that need help the most. Instead, it may be most beneficial for local governments to use information, like the data presented in our research, to inform their own unique interventions, that are specifically suited to address the nuances of gun violence in their respective communities.
FIs in children are a public health concern, and like many public health issues, warrants intervention across several disciplines, including the educational system, community-based programs, and physicians [14]. While the role of physicians in FIs is traditionally considered to be medical treatment, physicians are able to impact behavior and can play a part in the prevention of these injuries. This has been demonstrated in other major issues that aren’t strictly considered health-related, such as promoting wearing of seatbelts in children, receiving vaccinations, and practicing safe sexual behaviors [15]. Like local government programs utilizing trends in their community to inform their intervention policies, local physicians can use this data to inform their screening protocols. If a community is being affected primarily by accidental injuries, this may influence physicians to put more of an emphasis on safe handling and safe storage practices. Likewise, if a community is found to have increasing FIs in children less than 10 y.o., this may influence physicians to start screening and educating their community at a younger age. The emphasis needs to be on making their policies specific to their community. However, this is a task that many physicians are not appropriately prepared to handle. The majority of physicians do not own firearms, and even less receive any accredited education on firearms and firearm injury prevention, so it is common for physicians to feel ill-prepared to intelligently discuss these topics with their patients [16]. Therefore, it may be beneficial to include this information as a part of the standard medical education, or to provide continuing education courses on the topic.
Strengths and Limitations
Utilizing the KID database provided an extensive and realistic representation of the FI burden on the pediatric population in the United States. The span of our study, from 1997 to 2019, also provided a means to assess how the epidemiological burden of FIs have changed over time. We were able to effectively analyze an array of dependent and independent variables, increasing the scope of our study. One limitation was KID transitioning from using ICD-9 to ICD-10 in 2016. This resulted in a slight variance in diagnostic codes, making it more difficult to compare year to year. Additionally, KID only reports inpatient admissions, meaning all FIs that did not result in hospital admission could not be included. Lastly, our decision to include all entries up to 20 y.o. may have been a limitation. Most records were of patients 16-20 y.o., which some may argue are not pediatric patients but rather adult patients. However, the results of the subgroup analysis of patients under 17 y.o. demonstrated similar trends, and patients up to 20 y.o. are still commonly treated in pediatric hospitals, so we determined it was appropriate to include them in our analysis.
Conclusion
There is no one-size-fits-all approach to decreasing FIs in the United States. Countering this issue likely requires a multi-factorial solution. Establishing interventions that reduce gun violence and accidental FIs at the community level may be warranted, as local leadership may have a better understanding of the nuances affecting their community members. Future research should analyze interventions that have already been implemented, to identify which characteristics of these policies ultimately allowed them to make a meaningful difference, so that they can be better applied to communities around the country, as well as on physician-specific interventions. We hope that our findings can be used to better direct interventions towards reducing FIs in pediatric patients at the community and national level.
Declarations
The Institutional Review Board of SUNY Upstate Medical University waived the need for ethics approval and patient consent for the collection, analysis and publication of the retrospectively obtained and anonymized data for this non-interventional study [Project # 2020228-1].
Consent for publication
Not applicable
Availability of data and material
The dataset analyzed during the current study are available in Kids’ Inpatient Database,
Link: https://hcup-us.ahrq.gov/db/nation/kid/kiddbdocumentation.jsp
Competing interests
The authors declare that they have no competing interest
Funding Statement
The author(s) disclosed receipt of the following financial support for the research, authorship, and/or publication of this article: This work was supported by SUNY Upstate Medical University COM Summer Research Fellowship.
Author’s Contribution
NS conceptualized and designed the study, collected data, drafted the initial manuscript, performed statistical analysis, and critically reviewed and revised the manuscript. ZW conceptualized and designed the study, collected data, drafted the initial manuscript, and critically reviewed and revised the manuscript. RS conceptualized and designed the study, and critically revised the manuscript.
References
- Fowler KA, Dahlberg LL, Haileyesus T, Annest JL. (2015). Firearm injuries in the United States. Prev Med., 79:5-14.
Publisher | Google Scholor - Fowler KA, Dahlberg LL, Haileyesus T, Gutierrez C, Bacon S. (2017). Childhood Firearm Injuries in the United States. Pediatrics. 140(1):e20163486.
Publisher | Google Scholor - Bleyer A, Siegel SE, Thomas CR Jr. (2021). Increasing Rate of Unintentional Firearm Deaths in Youngest Americans: Firearm Prevalence and Covid-19 Pandemic Implication. J Natl Med Assoc. 113(3):265-277.
Publisher | Google Scholor - Peek-Asa C, Butcher B, Cavanaugh JE. (2017). Cost of hospitalization for firearm injuries by firearm type, intent, and payer in the United States. Injury Epidemiology. 4:20
Publisher | Google Scholor - Blumberg TJ, DeFrancesco CJ, Miller DJ, Pandya NK, Flynn JM, Baldwin KD. (2018). Firearm-associated Fractures in Children and Adolescents: Trends in the United States 2003-2012. J Pediatr Orthop., 38(7):e387-e392.
Publisher | Google Scholor - HCUP Kids’ Inpatient Database (KID). In: (HCUP) HCaUP, eds. Rockville, MD: Agency for Healthcare Research and Quality. Accessed June 1, 2021.
Publisher | Google Scholor - Baram D, Daroowalla F, Garcia R, et al. (2008). Use of the All Patient Refined-Diagnosis Related Group (APR-DRG) Risk of Mortality Score as a Severity Adjustor in the Medical ICU. Clin Med Circ Respirat Pulm Med. 2:19-25.
Publisher | Google Scholor - (2022). United States Census Bureau. 2000-2010 and 2011-2020 statistics.
Publisher | Google Scholor - RStudio Team (2021). RStudio: Integrated Development Environment for R. RStudio, PBC, Boston, MA.
Publisher | Google Scholor - Heller SB, Shah AK, Guryan J, Ludwig J, Mullainathan S, Pollack HA. (2017). Thinking, Fast and Slow? Some Field Experiments to Reduce Crime and Dropout in Chicago. Q J Econ., 132(1):1-54.
Publisher | Google Scholor - Connor SM. (2005). The association between presence of children in the home and firearm-ownership and -storage practices. Pediatrics., 115(1):e38-443.
Publisher | Google Scholor - Coyne-Beasley T, Miles DR, Lees AC, Proescholdbell SK, Ford CA. (2012). Disparities in firearms ownership and storage practices in North Carolina. South Med J., 105(4):225-230.
Publisher | Google Scholor - Kennedy DM, Braga AA, Piehl AM, Waring EJ. (2001). Reducing Gun Violence: The Boston Gun Project’s Operation Ceasefire. National Institute of Justice Publication Report.
Publisher | Google Scholor - Runyan CW, Runyan DK. (1991). How can physicians get kids to wear bicycle helmets? A prototypic challenge in injury prevention. Am J Public Health. 81(8):972-973.
Publisher | Google Scholor - Gruen RL, Campbell EG, Blumenthal D. Public Roles of US Physicians: Community Participation, Political Involvement, and Collective Advocacy. JAMA, 296(20):2467-2475.
Publisher | Google Scholor - Betz ME, Wintemute GJ. Physician Counseling on Firearm Safety: A New Kind of Cultural Competence. JAMA, 314(5):449-450.
Publisher | Google Scholor