Research Article
Transcriptomics Analysis of Stromal Breast Cancer Tissues Reveals Up-Regulation of GABA-A Receptor Activity
- Rutvi Vaja 1
School of Science, Department of Biomedical Sciences, Navrachana University, Vadodara, Gujarat, India.
*Corresponding Author: Rutvi Vaja School of Science, Department of Biomedical Sciences, Navrachana University, Vadodara, Gujarat, India.
Citation: Vaja R. (2023). Transcriptomics Analysis of Stromal Breast Cancer Tissues Reveals Up-Regulation of GABA-A Receptor Activity. International Journal of Clinical and Molecular Oncology, BRS Publishers. 2(1); DOI: 10.59657/2993-0197.brs.23.004
Copyright: © 2023 Rutvi Vaja, this is an open-access article distributed under the terms of the Creative Commons Attribution License, which permits unrestricted use, distribution, and reproduction in any medium, provided the original author and source are credited.
Received: May 24, 2023 | Accepted: June 12, 2023 | Published: June 16, 2023
Abstract
Breast cancer is the second most prevalent cancer overall among newly diagnosed cases and the most common cancer among women. 90% of cancer deaths are caused by metastasis, which is a factor that precedes local invasion, but very little is understood about the molecular mechanisms of invasion and metastasis. Thus, uncovering the root causes of this illness at the Transcriptomics level may result in a cutting-edge method of treating breast cancer. The total RNA microarray processed data from GEO for breast cancer patients was analyzed to discover hidden differences between epithelial breast cancer tissues (ET), stromal breast cancer tissues (ST), normal control epithelial breast cancer tissue samples (EC), and normal control stromal breast cancer tissue samples (SC) at the Transcriptomics level. Therefore, multiple bioinformatics analyses of the transcriptional profiles of 64 samples—including 28 TEC, 28 SCC, 5 EN, and 5 SN controls—received from the NCBI-Bio project were performed in the current study (PRJNA107497). First, ET versus EC and ST vs SC samples showed significant patterns in exploratory data analysis based on gene expression data using principal component analysis (PCA). Following this, 13512 substantially differentially expressed genes (Fold change (>= 1.5), p.adj value 0.1) between these conditions were found by Welch's T-test differential gene expression analysis. This study identifies the main element that may significantly contribute to the spread of breast cancer from epithelial cells to stromal cells in the mammary glands as the gene like the GBRP. This study was also able to identify the affected biological pathways for both the ST vs. SC samples and the ET vs. EC samples as a result of the up-regulated and down-regulated genes. This most surely provides a crucial hint about the cause of the deadly metastatic cancer problem. Finally, the results presented here provide novel insights on breast cancer metastasis.
Keywords: breast cancer; machine learning; differential gene expression; kegg pathway analysis; pca; heat maps; dendrograms
Introduction
One of the most prevalent malignancies in women globally, breast cancer caused 570,000 fatalities in 2015 [1]. Every year, almost 1.5 million women worldwide-25% of all cancer patients are given a breast cancer diagnosis. According to estimates, there were 252,710 new cases of breast cancer among women in America in 2017 [1]. Breast cancer is an incurable form of metastatic cancer that frequently spreads to distant organs such the bone, liver, lung, and brain [2]. A positive prognosis and a high survival rate can result from early diagnosis of the illness. Breast Cancer is the main cause of death for women between the ages of 40 and 55, accounting for one-third of all new cancer cases [3]. The lifetime chance of dying from Breast Cancer is 3.4%, and one in eight women will be diagnosed with it. With an average of 19.3 lost years of life per woman dying of Breast Cancer, it is the second most common cause of cancer-related years of life lost in women [3]. Up until 2003, the prevalence of breast cancer rose. The Women's Health Initiative (WHI) study associating hormone therapy with Breast Cancer was published between 2002 and 2003, which is most likely what caused the rates to drop quickly between those two years (Chlebowski et al., 2009). Since 2004, the rates have remained steady.
Recent research has demonstrated that breast cancer also includes major modifications in the stroma, or tumour microenvironment, which surrounds the neoplastic cells [4]. These changes are now understood to be important for the onset and spread of breast cancer as well as prospective treatment targets [4,5]. As a result of interactions between several elements of the breast cancer microenvironment, including suppressive immune cells, soluble substances, and altered extracellular matrix, breast cancer development and metastasis are facilitated [5]. Some of the molecular changes and abnormal signaling pathways that characterize stromal cells in the breast cancer microenvironment are prognostic of the clinical outcome. Numerous novel therapies that target stromal components are being developed or tested in patients.
New research suggests that tumours also have a significantly changed stroma surrounding them in addition to neoplastic cells [6]. In fact, this tumour microenvironment is increasingly acknowledged as a crucial component for the growth and evolution of tumours as well as a quantifiable indicator of therapy response. Numerous studies have shown that there are significant epigenetic changes that result in aberrant gene expression in the cells of the tumour microenvironment, and that tumour stromal gene expression signatures can predict clinical outcome [7]. In light of these recent discoveries, the breast cancer microenvironment is receiving more attention as a prognostic factor and potential therapeutic target, and new therapies targeted at stromal components are being developed. The focus of this research paper is on the cells that make up the breast cancer microenvironment, the changes in their molecular fingerprints, how they interact with cancer cells, and any potential clinical consequences of these discoveries.
The correct development and differentiation of the mammary gland depend on the interaction of epithelial and stromal cells [1, 8]. Epithelial polarity is maintained by physiological stroma, which also prevents unchecked cell proliferation and neoplastic transformation. For instance, myoepithelial cells, which create the basement membrane (BM) and act as a physical barrier around luminal epithelial cells to prevent the growth of tumours, have been identified as natural tumour suppressors in the breast [9]. Studies on breast cancer xenograft models indicate that the loss of myoepithelial cells favours the development of invasive carcinoma from ductal carcinoma in situ (DCIS) [10]. The 'escape' and 'release' models have both been put out as explanations for the change from in situ to invasive cancer. The "release" model contends that an aberrant microenvironment causes the BM to be disrupted and the dissemination of tumour epithelial cells into the stroma [10]. The "escape" model contends that genetic alterations in tumour epithelial cells enable them to invade tissue next to the ducts [10]. The essential event of the in situ-to-invasive transition in breast cancer is likely a combination of these two models, highlighting the importance of alterations in both the epithelial and stromal compartments for tumour development and progression.
It has also been demonstrated that healthy myoepithelial cells can inhibit the proliferation, invasion, and angiogenesis of breast cancer cells. Myofibroblasts and fibroblasts in cancer-associated stroma, however, appear to promote carcinogenesis and metastatic dissemination via complex paracrine signaling, fostering a receptive milieu and affecting the growth and metastasis of cancer [11]. The accompanying tumour stroma shares characteristics with a healing wound, including fibroblast proliferation and ECM remodeling, but is devoid of physiological controls.
Stromal tissue is made up of fibroblasts, adipocytes, and the ECM, and blood and lymph arteries, all of which have been discovered to influence the development of tumours [11]. The stroma in the tumour microenvironment changes as the malignancy spreads. Fibroblast activation, ECM remodeling, and angiogenesis are some of these modifications [12]. These changes are believed to be essential for transforming the stroma into a metastasis-supportive environment.To determine the effects of each of these compartments on the cell and molecular level, the transcriptome of each of these compartments, whether at the epithelial or stromal level, must be investigated separately [13]. As a result, research efforts focused on determining a unique genetic signature of stromal tissue associated with cancer are limited. The metastasizing primary breast cancer is identified by the up-regulation of stroma-specific genes along with the state of inactivation of tumor-epithelial-specific genes and signals, according to recent research using laser capture micro dissection (LCM) [14]. Additionally, studies and research were conducted using samples of normal stroma and epithelium obtained from people undergoing reduction mammoplasty or surgical treatment for breast cancer, which were then dissected using the LCM method [14]. Additionally, these studies have demonstrated that the stromal microenvironment modifications, which are now known to be directly linked to cancer progression and metastasis, do not exist prior to the stage before carcinogenesis is initiated.
The main goal of our transcriptomics investigation was to elucidate the underlying mechanisms driving the differences between the gene expression profiles of cancerous stromal (SCC) and cancer epithelial (TEC) tissues in comparison to normal samples. Due to the differences in gene expression patterns between TEC and SCC patient tissue samples, our main goal was to identify the affected pathways at the molecular, biological, and cellular levels. By comparing the observed transcriptome variations between stromal and epithelial cells in normal breast tissue and breast cancer tissue samples, our main objective was to determine the role stroma plays in breast cancer invasion. In order to comprehend the formation, development, and progression of tumours in breast cancer, we sought for transcriptional abnormalities. Future treatments may greatly benefit from identifying the underlying genes that cause breast cancer because the expression of TEC and SCC is tissue-specific and depends on the phenotypes in which it occurs.
To better understand the affected Molecular, Biological, and Cellular pathways and their corresponding differentially expressed genes at the transcriptomics level, we examined the transcriptomics profiles of breast tissue samples obtained during surgery from patients having invasive breast cancer surgically removed (n=56) [Cancer Epithelial Tissues=28; Cancer Stromal Tissues=28] and normal breast tissue samples obtained from patients (n=10). After separating the relevant genes between these two experimental groups, we were able to determine which pathways were affected as the illness advanced to later stages of breast cancer metastasis.
Materials and Methods
Datasets
The transcriptome data for this particular research study was taken from the NCBI GEO server, and the data set number was [GSE10797]. The bio project accession number for the dataset used in this study is PRJNA107497, and it was created by Casey T, Bond J, Tighe S, Hunter T, et al. The [HG- U133A_2] Affymetrix Human Genome U133A 2.0 Array platform's transcriptome data includes quantile normalized values from total RNA collected from stromal and epithelial breast cancer cells that have undergone microarray processing using the Bioconductor package Lumi (version 2.32.0). In Table 1 below, the data set for the aforementioned Bio project is shown.
Table 1: Datasets used in the present study.
| Disease State Sample Group Name | Total Number of Samples |
| Cancer Stromal Tissues [ST] | 28 |
| Cancer Epithelial Tissues [ET] | 28 |
| Normal Stromal Tissues [SC] | 5 |
| Normal Epithelial Tissues [EC] | 5 |
Data Pre-Processing
The microarray data was processed with quantile-normalized signal data. The data that had been processed contained Gene IDs. Gene IDs and gene symbols were mapped using the SOFT family files.
Exploratory Analysis
The exploratory investigation compared samples from three categories, including healthy and cancer patient samples (cancer epithelial and cancerous stromal tissues). To further understand the patterns in the data, the following exploratory data analysis was performed using the principal component analysis tool incorporated within the Metaboanalyst Bioinformatics Server (https://www.metaboanalyst.ca/) [15]. Using PCA [16], a dimensionality reduction strategy, the data variety is discretely represented and visualized. The following three independent conditions were used for PCA: (1) Cancer Epithelial Tissue vs. Normal Epithelial Tissue (2) Cancer Stromal Tissue vs. Normal Stromal Tissue (3) All Samples (Cancer Epithelial Tissues vs. Cancer Stromal Tissues vs. Control Samples). Moreover, the patterns were then determined by plotting the PCA scatter plots.
Differential Gene expression Analysis
The differential Gene [removed]DGE) analysis may be completed by contrasting the ET and ST samples with the EC and SC Control samples, respectively [17]. The samples were put through a differential gene [removed]DGE) analysis using the Metaboanalyst Software and the GEO2R built-in DEG function used by NCBI GEO platform, as well as the Welch's T-test. The Welch's T-test is a statistical analysis modification that helps locate the key genes and provides statistical significance for variances with unequal variances. A Welch's test [17] may be used when two groups have uneven sample sizes and variances. The potentially differentially significant genes were identified using the threshold of (p.adj value0.1, Fold change (>= 1.5)).
Assessment of Discriminatory potential of significant genes
The potential of the discovered important genes in differentiating both classes of data was then assessed and illustrated using statistical analysis such as PCA, dendrograms, and H-Clustering utilizing the chosen set of differentially expressed significant genes alone. H-clustering (Distance: Euclidean, Linkage: average) was used to understand the possibility of significant genes often in differentiating the ET, ST and Control samples based on their gene expression. Heatmaps were eventually used to show the differences in gene expression patterns across the different groups of samples.
It is simpler to assess better feature selection for the cutting-edge machine learning algorithms that have been suggested when using techniques like Heat-map and H-clustering. As opposed to H-clustering, which allows us to observe how our data set clusters in order to understand how features are picked, Heatmap makes it straightforward to identify which features are most closely connected with the target variable. This also shows that the genes are divided into discrete heat map expression patterns and Dendrograms clusters by a factor at the Transcriptomics level.
Gene Enrichment Analysis
To elucidate the biological significance of the important genes, a gene enrichment analysis for Gene Ontology (GO) concepts was performed using the annotation module of the Enrichr: Pathway analysis software. Additionally, the KEGG pathways were enriched by significantly expressed genes (p.adj value 0.05, Fold change (>= 1.5) found using the Enrichr software. Enrichr is a web-based enrichment analysis tool that delivers a variety of visualization summaries of the combined activities of gene lists. It is user-friendly and straightforward. Additionally, enriched pathways were discovered and evaluated using the Enrichr software-based platform, particularly for the highly differently expressed down-regulated and up-regulated genes.
Result
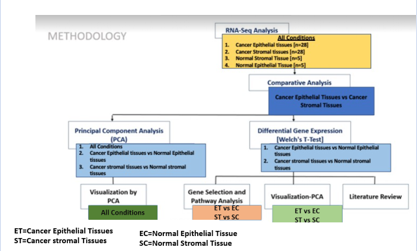
In the current proposed study, we explored and analyzed the Transcriptomics data of cancer epithelial tissue, cancer stromal tissue, and healthy control epithelial and stromal samples using various bioinformatics techniques to elucidate the underlying gene signatures and biological pathways at the Transcriptomics level. The workflow for the full investigation is shown in Figure 1.
Figure 1: Work Flow of the study representing the key steps. Exploratory Data Analysis.
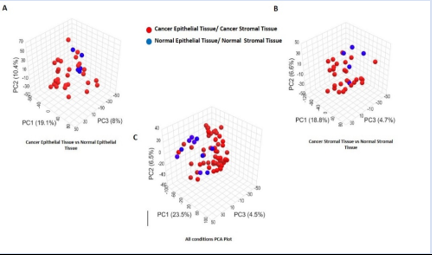
Principal component analysis was used to retrieve the transcriptomics data (PCA). We used PCA to analyze the underlying variation across the four groups, which included samples from healthy control epithelial and stromal samples and cancer epithelial and stromal tissue. The fluctuation between all the circumstances, including ET, EC, ST and SC, is shown in Figure 2C. The PC1 is 23.5%, the PC2 is 6.5%, and the PC3 is 4.5%. The PCA of this exploratory analysis makes it clear that something at the transcriptomics levels is responsible for the gene- level differences between the ET, EC, ST and SC samples. Importantly, there are significant differences between the ET and EC samples, with PC1 being 19.1%, PC2 being 10.4%, and PC3 being 8%, as seen in Figure 2A. Figure 2B represents variation between ST and SC samples. The variation between 3 PCAs is given as PC1=20.3%, PC2=7% and PC3=4.8%.
Figure 2: (A) PCA for Cancer Epithelial Tissue vs Normal Epithelial Tissue (B) PCA For Cancer Stromal tissue samples Vs Normal Stromal tissue samples, (C) PCA showing Variance among all groups.
Downstream Analysis
The PCA results (Figure 2A to 2C) unambiguously demonstrate that the cancer stromal tissue and normal epithelial tissue samples (ST versus SC) exhibit the largest variation. As a result, we contrasted tissue samples from normal epithelium and cancer stromal (ST versus SC). We also conducted a comparison analysis between samples of cancer epithelial tissues and normal epithelial tissue (ET versus EC), as they showed the second-highest degree of variation in the PCA plots. Figure 2B clearly shows the difference between ST and SC samples, demonstrating the significant transcriptome diversity between both populations. Therefore, in the downstream analysis, we compared the gene expression of normal epithelial tissues with that of cancer stromal tissues (ST vs SC) and cancer epithelial tissues (ET vs EC).
Differential Genes Expression Analysis
The results of the analysis of the difference gene expression between cancer epithelial tissues and normal epithelial tissue (ET vs EC) samples were significant (p.adj value 0.1, Fold change >= 1.5). In comparison to EN, 13 of them were found to be significantly upregulated (p.adj value 0.1, Fold change >= +1.5), and 3 of them were found to be significantly downregulated (p.adj value 0.1, Fold change = -1.5). 13512 samples were substantially examined in the examination of the differential gene expression between cancer stromal tissues and normal stromal tissues (SCC vs SN) (p.adj value 0.1, Fold change >= 1.5). These genes were split into 6 that had significantly higher levels in SCC than in SN (p.adj value 0.1, Fold change >= +1.5), and 1 was downregulated (p.adj value 0.1, Fold change = -1.5).
Clustering and Heat Map revealed variations among Epithelial and Stromal cancer tissues and Normal Control samples
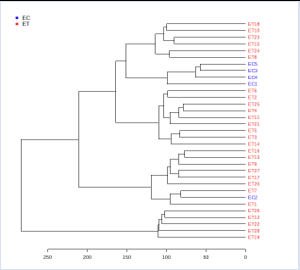
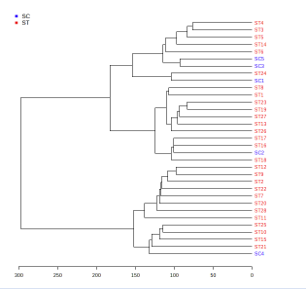
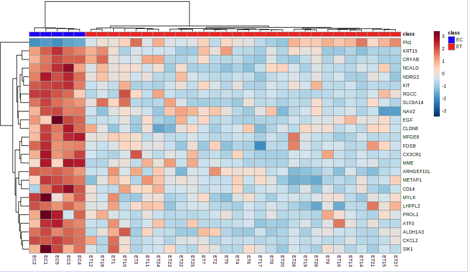
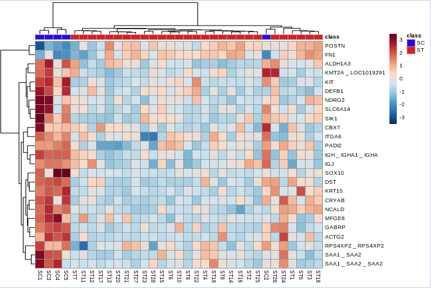
Hierarchical clustering (visualized in the form of dendrograms) [19] was carried out to ascertain whether the differentially expressed significant genes can form distinct clusters of Cancer stromal tissues vs. Normal stromal tissue [ST vs. SC] samples and Cancer epithelial tissues vs. Normal epithelial tissue [ET vs. EC] samples based on their gene expression. The results of the clustering analysis clearly illustrate the distinct clusters of the group of Cancer Stromal Tissues vs. Normal Stromal Tissue [ST vs. SC] samples and Cancer Stromal Tissues vs. Normal Epithelial Tissue [ET vs. EC] samples, as shown in Figures 3 and 4, respectively. Figures 5 and 6 respectively exhibit heatmaps that depict the expression patterns of important genes in cancer epithelial tissues compared to normal epithelial tissue [ET vs EC] samples and cancer stromal tissues compared to normal stromal tissue [ST vs SC] samples.
Figure 3: Hierarchical Clustering results as dendrograms. Red text represents the clusters of the diseased (Cancer epithelial tissues) samples and blue text clusters indicate the Control (Normal epithelial tissue) samples.
Figure 4: Hierarchical Clustering results as dendrograms. Red text represents the clusters of the diseased (Cancer stromal tissues) samples and blue text clusters indicate the Control (Normal stromal tissue) samples.
Figure 5: Heatmap showing the gene expression profiles of genes with notable differences in expression.
Figure 6: Heatmap showing the gene expression profiles of genes with notable differences in expression.
Figures 4 and 5's clustering patterns, which show a very clear picture of feature selection that may be undertaken between the ET vs EC and ST vs SC groups, are quite obvious. Using the built-in Metaboanalyst software's feature selection method, we examined a heat map of the top 25 differentially expressed genes to see their expression levels. The up- and down-regulated genes for the paired groups ET vs EC and ST vs SC may be clearly seen on our heat map.
Pathways involved in the pathogenesis of Epithelial/Stromal cells driven Breast Cancer.
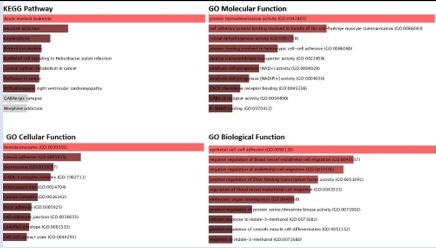
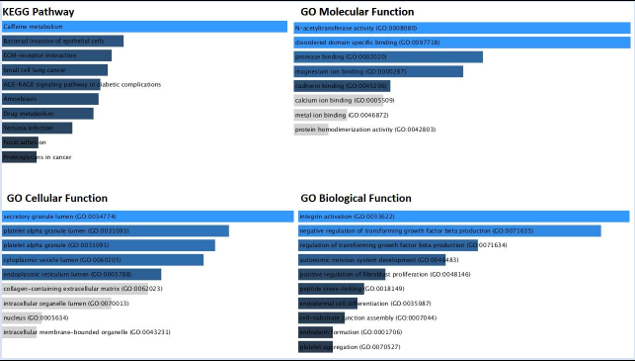
The investigation of gene ontologies was done to comprehend the biological significance of pathways. Though different pathways were impacted by the over-expressed and upregulated genes, it is interesting to note that many of these pathways represented biological ones, including the epithelial cell-cell adhesion pathway, the endothelial cell migration and embryonic development pathway (Figure 7A). The caffeine metabolism, integrin activation pathways, and SRP dependent co- translational pathways were the biological pathways that were altered as a result of the down-regulated genes (Figure 7B).
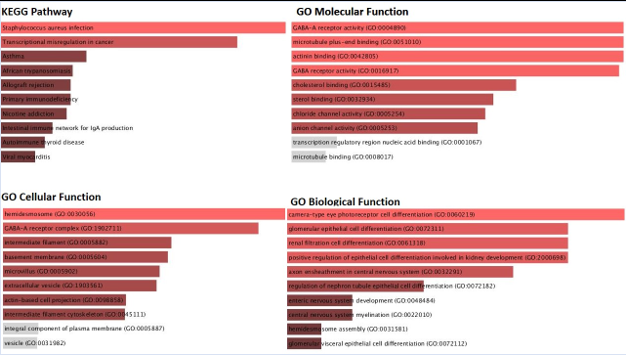
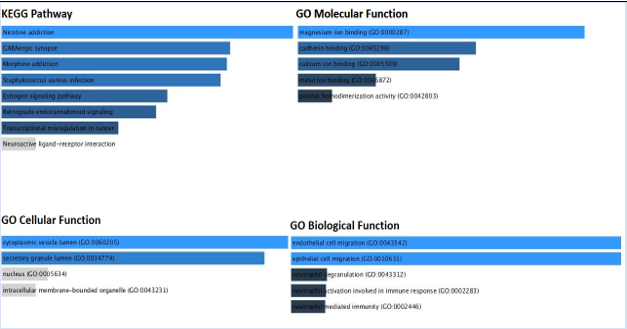
To understand the biological importance of pathways, gene ontologies were investigated. It’s interesting that, despite the fact that the over-expressed-upregulated genes affected a variety of pathways, many of these pathways represented biological pathways, such as the pathways for staphylococcus aureus, hemidesmosome, GABA-A-Receptor activity and epithelial cell to cell adhesion (Figure 7C).Cytoplasmic vesicle lumen, Nicotine addiction and metabolism pathways, and Secretory granule lumen processes were the biological pathways that were altered as a result of the down-regulated genes (Figure 7D).
Figure 7A: KEGG pathway and Gene ontology analysis of the Up-regulated genes [ET vs EC samples].
Figure 7B: KEGG pathway and Gene ontology analysis of the Down-regulated genes [ET vs EC samples].
Figure 7C: KEGG pathway and Gene ontology analysis of the Up-regulated genes [ST vs SC samples].
Figure 7D: KEGG pathway and Gene ontology analysis of the Down-regulated genes [ST vs SC samples].
Discussion
The extracellular matrix (ECM) serves as a conduit for communication between the stromal and epithelial cells that make up the mammary gland [20]. Disruption of the epithelium-connection can lead to both breast cancer induction and promotion. Stroma's Crosstalk between the breast epithelium and stroma is necessary for the typical mammary gland to develop and function properly. It's interesting to note that during the mammary gland's maturation cycle, a number of traits connected to breast cancer are displayed. In addition, many of the factors linked to breast cancer are also necessary for mammary growth [21].We might be able to better understand how cancers start and develop if we have a better understanding of how these elements work during normal development. In this study, we aimed to show a significant correlation between a variety of cellular and molecularly changed biological processes and malignant tissues from the stroma and epithelium.
RNA-Seq analysis was carried out on RNA-seq samples acquired from both groups in order to find changes in gene expression between cancer stromal tissues vs. normal stromal tissue [SCC vs SN] samples and cancer stromal tissues vs. normal epithelial tissue [TEC vs TN] samples. The samples from the two categories, cancer stromal tissues vs. normal stromal tissues [SCC vs SN] and cancer stromal tissues vs. normal epithelial tissues [TEC vs TN], form distinct clusters, indicating significant gene-level differences between the samples. PCA-based exploratory data analysis made this discovery. This suggests that there could be a transcriptome-level trigger for the growth of tumours and the spread of metastatic breast cancer. The sequence of events that take place during this transition could be revealed with more study on the subject.
Based on differential gene expression analysis using Welch's T-Test, we discovered that the Cancer epithelial tissues vs. Normal epithelial tissue [ET vs EC] samples studied 13512 significantly differed (p.adj value 0.1, Fold change >= 1.5). While 3 genes were found to be significantly downregulated (p.adj value 0.1, Fold change = -1.5), 13 genes were found to be significantly upregulated (p.adj value 0.1, Fold change >= +1.5) in ET compared to EC. Additionally, 13512 gene expression patterns that were substantially different between malignant stromal tissues and normal stromal tissues (SCC vs SN) samples were looked at (p.adj value 0.1, Fold change >= 1.5). 6 of the total number of genes were shown to be significantly upregulated in SCC compared to SN (p.adj value 0.1, Fold change >= +1.5), while 1 of them were discovered to be significantly downregulated (p.adj value 0.1, Fold change = -1.5).
Dendrograms and heat maps, two examples of feature selection visualization patterns, aid in choosing the best machine learning method to extract features [22]. The selection of breast cancer sub-features, such as classification based on gender, age, race, ethnicity, and pathophysiology, could be worked on later using these visualization patterns.
A gene ontology study using Enrichr based on important gene sets suggests that potential dysregulation may have influenced the formation of cancers in epithelial/stromal tissues. Though different pathways were impacted by the over-expressed and upregulated genes, it is interesting to note that many of these pathways represented biological ones, including the epithelial cell-cell adhesion pathway, the endothelial cell migration and embryonic development pathway. The caffeine metabolism, integrin activation pathways, and SRP dependent co- translational pathways were the biological pathways that were altered as a result of the down-regulated genes.
This study shows that as per our GO Molecular Component 2021 pathway Analysis, the most affected pathway is the GABA-A-Receptor pathway. The associated gene with this pathway is GABRP [on the basis of analysis done on the Enrichr software] as the key features that may substantially contribute to metastasis of breast cancer from epithelial cells to stromal cells in the mammary glands [23].According to research, the gamma-aminobutyric acid type A receptor subunit [GABRP], a membrane protein that is particularly abundant in TNBC stem cells, interacts with EGFR and significantly maintains its expression, resulting in the maintenance of stemness and resistance to chemotherapy [24]. By inhibiting GABRP, EGFR signaling was reduced, which decreased cell stemness and increased sensitivity to chemotherapy drugs like paclitaxel, doxorubicin, and cisplatin [24]. Retigabine, an FDA-approved medication for the adjunctive treatment of seizures, enhanced the EGFR's sensitivity to gefitinib in cells that were previously resistant to the therapy [25]. It was discovered that the membrane protein abundant in TNBC stem cells, the gamma-aminobutyric acid type A receptor subunit [GABRP], interacted with EGFR and greatly maintained its expression, resulting in the preservation of stemness and chemotherapy resistance [26].By inhibiting GABRP, EGFR signaling was reduced, which decreased cell stemness and increased sensitivity to chemotherapy drugs like paclitaxel, doxorubicin, and cisplatin. Retigabine, an FDA-approved medication for the adjunctive treatment of seizures, enhanced the EGFR's sensitivity to gefitinib in cells that were previously resistant to the therapy [27].
The gamma-aminobutyric acid (GABA) A receptor is a multi-subunit chloride channel that mediates the fastest inhibitory synaptic transmission in the central nervous system. The uterus and ovaries are two non-neuronal tissues that express the subunit that this gene encodes (28). This subunit can assemble with known GABA-A receptor subunits, and the presence of this subunit affects the sensitivity of recombinant receptors to modulatory drugs such as pregnanolone [28]. Alternatively spliced transcript variants producing various isoforms have been discovered for this gene.
Most studies have concentrated only the mechanism of GABA activity and expression of GABA receptors in the neoplastic process. No concrete data were found regarding survival time of breast cancer patients based on GABA level. Unlike previously published data, the current study demonstrates considerable differences in the overall and disease-free survival time correlated with the GABA level in neoplastic tumor [29]. However, according to the study’s preliminary report, 10-year survival is dependent on GABA levels. Additionally, the most currently observed significant correlations were confirmed among patients with different E-cadherin immune-expression. The authors' findings demonstrate the importance of GABA in the emergence of breast cancer and suggest that it may serve as a novel prognostic indicator [30].
The presence of GABA in neoplastic cells and its large concentration differences in respective patients, with values both below and above the established norm, was revealed [31]. However, it should be stressed that any studies did not portray on the GABA level which did not correlate with any of the studied clinical (i.e., tumour size, lymph nodes metastatic spreading) and histological (immune expression of ER, HER2) classical prognostic factors. Studies have suggested that GABA may be a potent inhibitor of cell migration and proliferation [32]. This could explain why patients who are currently being investigated and have low GABA levels have significantly lower overall and disease-free survival times. It has been shown that the proliferation of human pulmonary adenocarcinoma (PAC) cells NCI-H322, immortalized human pancreatic duct epithelial cells HPDE6-C7, and small airway epithelial cells HPL1D is inhibited by the activation of GABA B receptor by baclofen, an agonist of peripheral benzodiazepine GABA [32, 33].
The reason for the low level of GABA, specific for shorter survival of breast cancer patients, may be caused by changes in oxygenation in the tumour parenchyma. It is generally known that GABA-T transaminase, which mostly functions under oxygen circumstances, breaks down GABA. Increased oxygenation and transaminase activity may be brought on by enhanced neo-angiogenesis, which would then result in a drop in GABA levels. Increased cell migration and proliferation could result from a secondary, decreased level of GABA, which would then have an impact on survival.
On the other side, the available data made it easier to choose patients based on their prognosis. Patients with high GABA levels and positive E-cadherin immune expression had the greatest prognosis, while those with the reverse value of both parameters had the worst [34]. However, a link has already been established between abnormal E-cadherin immune expression and worse prognosis, increased likelihood of distant metastasis, and higher histological tumour grading in breast cancer patients [35]. The predictive relevance of E-cadherin for both overall survival and disease survival was also emphasized. Its influence on neoplastic cell migration was also highlighted. Based on meta-analysis, studies found that loss of E-cadherin immune expression may be a stand-alone bad prognostic indication for an infiltrating ductal breast cancer [36]. Also worth mentioning is the role played by GABA and E-cadherin in the control of cellular migration and metastasis formation, which may help to explain some of the findings of the present study [37]. To validate the above information, moreover our study represents a deregulated endothelial adhesion and migration pathway[down-regulated] as a consequence of breast cancer tumour formation [38].
Furthermore, some recent investigations have shown a connection between the GABAergic system and cadherins. According to Fiederlink et al. [23], E-cadherin signaling plays a significant role in the control of GABAergic synapses in cortical neurons. Additionally, Li et al. Demonstrated a connection between protocadherin’s and GABAergic synapses in their investigation of these proteins, which are often engaged in the pre- and postsynaptic contacts. Although the two studies focused on the physiology of the nervous system, the mechanism of metastasis formation is a complicated process, and it is possible that the two analyzed components interact despite the absence of relevant evidence in the literature.
Our findings imply that GABRP represents a novel therapeutic target with potential in TNBC. It is a candidate for the development of a ductal carcinomas due to its membrane location, high expression in breast tumours, low expression in the majority of normal tissues, and significant function in maintaining cell proliferation.
Conclusion
In conclusion, our work is able to highlight some of the probable key variations in gene expression between cancerous stromal tissues compared to normal stromal tissues (ST vs SC) and cancerous epithelial tissues compared to normal epithelial tissues (ET vs EC) samples. As a result of the up-regulated and down-regulated genes, we also discovered the affected biological pathways for both cancer stromal tissues compared to normal stromal tissues [ST vs. SC] samples and cancer epithelial tissues compared to normal epithelial tissue [ET vs. EC] samples. This most definitely offers an important cue regarding the root of the fatal metastatic cancer problem.
References
- Houghton, S. C., & Hankinson, S. E. (2021). Cancer Progress and Priorities: Breast Cancer. Cancer epidemiology, biomarkers & prevention: a publication of the American Association for Cancer Research, cosponsored by the American Society of Preventive Oncology, 30(5), 822–844. https://doi.org/10.1158/1055-9965.EPI-20-1193
Publisher | Google Scholor - Kumar N, Patni P, Agarwal A, Khan MA, Parashar N. (2015). Prevalence of molecular subtypes of invasive breast cancer: a retrospective study. Med J Armed Forces India.71(3):254–8.
Publisher | Google Scholor - Lu P, Weaver VM, Werb Z. The extracellular matrix: a dynamic niche in cancer progression. J Cell Biol. 2012;196(4):395–406.
Publisher | Google Scholor - van 't Veer LJ, Dai H, van de Vijver MJ, He YD, Hart AA, et al. (2002). Gene expression profiling predicts clinical outcome of breast cancer. Nature. 415(6871):530–6.
Publisher | Google Scholor - Iyengar P, Espina V, Williams TW, Lin Y, Berry D, et al. (2005). Adipocyte-derived collagen VI affects early mammary tumor progression in vivo, demonstrating a critical interaction in the tumor/stroma microenvironment. J Clin Invest. 115(5):1163–76.
Publisher | Google Scholor - Provenzano PP, Inman DR, Eliceiri KW, Knittel JG, et al. (2008). Collagen density promotes mammary tumor initiation and progression. BMC Med. 6:11.
Publisher | Google Scholor - Shields MA, Dangi-Garimella S, Krantz SB, Bentrem DJ, Munshi HG. (2011). Pancreatic cancer cells respond to type I collagen by inducing snail expression to promote membrane type 1 matrix metalloproteinasedependent collagen invasion. J Biol Chem. 286(12):10495–504.
Publisher | Google Scholor - Condeelis J, Segall JE. (2003). Intravital imaging of cell movement in tumours. Nat Rev Cancer. 3(12):921–30.
Publisher | Google Scholor - Provenzano PP, Inman DR, Eliceiri KW, Keely PJ. (2009). Matrix density-induced mechanoregulation of breast cell phenotype, signaling and gene expression through a FAK-ERK linkage. Oncogene. 28(49):4326–43.
Publisher | Google Scholor - S Curran, J A McKay, H L McLeod, G I Murray (2000). Laser capture microscopy Mol Pathol. 53(2): 64–68. doi: 10.1136/mp.53.2.64
Publisher | Google Scholor - Boyd NF, Guo H, Martin LJ, Sun L, Stone J, et al. (2007). Mammographic density and the risk and detection of breast cancer. N Engl J Med. 356(3):227–36.
Publisher | Google Scholor - Guo YP, Martin LJ, Hanna W, Banerjee D, Miller N, et al. (2001). Growth factors and stromal matrix proteins associated with mammographic densities. Cancer Epidemiol Biomark Prev. 10(3):243–8.
Publisher | Google Scholor - Kalluri, R., & Zeisberg, M. (2006). Fibroblasts in cancer. Nature reviews. Cancer, 6(5), 392–401. https://doi.org/10.1038/nrc1877.
Publisher | Google Scholor - Myllyharju J, Kivirikko KI. (2004). Collagens, modifying enzymes and their mutations in humans, flies and worms. Trends Genet. 20(1):33–43.
Publisher | Google Scholor - Hellewell AL, Adams JC. (2016). Insider trading: extracellular matrix proteins and their non-canonical intracellular roles. Bioessays. 38(1):77–88.
Publisher | Google Scholor - J. Lever, M. Krzywinski, N. (2017). Altman, Points of Significance: Principal component analy-sis. Nature Methods, 14(7), 641–642. doi:10.1038/nmeth.4346
Publisher | Google Scholor - Fu Q, Hoijtink H, Moerbeek M. (2021). Sample-size determination for the Bayesian t test and Welch’s test using the approximate adjusted fractional Bayes factor. Behav Res Methods. 53(1):139–152. doi: 10.3758/s13428-020-01408-1. PMID: 32632740; PMCID: PMC7880954.
Publisher | Google Scholor - Kavuri VC, Liu H. (2014). Hierarchical clustering method to improve transrectal ultrasound-guided diffuse optical tomography for prostate cancer imaging. Acad Radiol. 21(2):250–62. doi: 10.1016/j.acra.2013.11.003. PMID: 24439338; PMCID: PMC4562019.
Publisher | Google Scholor - Banyard J, Bao L, Zetter BR. (2003). Type XXIII collagen, a new transmembrane collagen identified in metastatic tumor cells. J Biol Chem. 278(23):20989–94.
Publisher | Google Scholor - Hashimoto T, Wakabayashi T, Watanabe A, Kowa H, Hosoda R, et al. (2002). CLAC: a novel Alzheimer amyloid plaque component derived from a transmembrane precursor, CLAC-P/collagen type XXV. EMBO J. 21(7):1524–34.
Publisher | Google Scholor - Hagg P, Rehn M, Huhtala P, Vaisanen T, Tamminen M, et al. (1998). Type XIII collagen is identified as a plasma membrane protein. J Biol Chem. 273(25):15590–7.
Publisher | Google Scholor - Maatta M, Vaisanen T, Vaisanen MR, Pihlajaniemi T, Tervo T. (2006). Altered expression of type XIII collagen in keratoconus and scarred human cornea: increased expression in scarred cornea is associated with myofibroblast transformation. Cornea. 25(4):448–53.
Publisher | Google Scholor - Taddei, M. L., Giannoni, E., Fiaschi, T., & Chiarugi, P. (2012). Anoikis: an emerging hallmark in health and diseases. The Journal of pathology, 226(2), 380–393. https://doi.org/10.1002/path.3000
Publisher | Google Scholor - Nykvist P, Tu H, Ivaska J, Kapyla J, Pihlajaniemi T, et al. (2000). Distinct recognition of collagen subtypes by alpha(1)beta(1) and alpha(2)beta(1) integrins. Alpha(1)beta(1) mediates cell adhesion to type XIII collagen. J Biol Chem.275(11):8255–61.
Publisher | Google Scholor - Vaisanen MR, Vaisanen T, Pihlajaniemi T. (2004). The shed ectodomain of type XIII collagen affects cell behaviour in a matrix-dependent manner. Biochem J. 380(Pt 3):685–93.
Publisher | Google Scholor - Snellman A, Keranen MR, Hagg PO, Lamberg A, Hiltunen JK, et al. (2000). Type XIII collagen forms homotrimers with three triple helical collagenous domains and its association into disulfide-bonded trimers is enhanced by prolyl 4-hydroxylase. J Biol Chem. 275(12): 8936–44.
Publisher | Google Scholor - Snellman A, Tu H, Vaisanen T, Kvist AP, Huhtala P, et al. (2000). A short sequence in the N-terminal region is required for the trimerization of type XIII collagen and is conserved in other collagenous transmembrane proteins. EMBO J. 19(19):5051-9
Publisher | Google Scholor - Vaisanen T, Vaisanen MR, Autio-Harmainen H, Pihlajaniemi T. (2005). Type XIII collagen expression is induced during malignant transformation in various epithelial and mesenchymal tumours. J Pathol. 207(3):324–35.
Publisher | Google Scholor - Miyake M, Hori S, Morizawa Y, Tatsumi Y, Toritsuka M, et al. (2017). Collagen type IV alpha 1 (COL4A1) and collagen type XIII alpha 1 (COL13A1) produced in cancer cells promote tumor budding at the invasion front in human urothelial carcinoma of the bladder. Oncotarget. 8(22):36099–114.
Publisher | Google Scholor - Plantefaber LC, Hynes RO. (1989). Changes in integrin receptors on oncogenically transformed cells. Cell. 56(2):281–90. 27.
Publisher | Google Scholor - Cosgrove D, Rodgers K, Meehan D, Miller C, Bovard K, et al. (2000). Integrin alpha1beta1 and transforming growth factor-beta1 play distinct roles in alport glomerular pathogenesis and serve as dual targets for metabolic therapy. Am J Pathol. 157(5):1649–59.
Publisher | Google Scholor - Howe AK, Aplin AE, Juliano RL. (2002). Anchorage-dependent ERK signaling-- mechanisms and consequences. Curr Opin Genet Dev. 12(1):30–5.
Publisher | Google Scholor - George EL, Georges-Labouesse EN, Patel-King RS, Rayburn H, Hynes RO. (1993). Defects in mesoderm, neural tube and vascular development in mouse embryos lacking fibronectin. Development. 119(4):1079–91.
Publisher | Google Scholor - Hynes RO. (1996). Targeted mutations in cell adhesion genes: what have we learned from them? Dev Biol. 180(2):402–12.
Publisher | Google Scholor - Tessari A, Palmieri D, Di Cosimo S. (2013). Overview of diagnostic/targeted treatment combinations in personalized medicine for breast cancer patients, Pharmgenomics Pers Med. 16 (7):1–19.
Publisher | Google Scholor - Maciejczyk A. (2013). A New prognostic factors in breast cancer, Adv Clin Exp Med. 22(1):5–15.
Publisher | Google Scholor - PapadopoulosV, Kapsis A, Li H, Amri H, Hardwick M, et al. (2000). Drug-induced inhibition of the peripheral-type benzodiazepine receptor expression and cell proliferation in human breast cancer cells. Anticancer Res. 20 (suppl 5A) 20(5A):2835–47.
Publisher | Google Scholor - Matuszek M, Jesipowicz M, Kleinrok Z. (2001). GABA content and GAD activity in gastric cancer. Med Sci Monit. 7(3):377–81.
Publisher | Google Scholor - Takehara A, Hosokawa M, Eguchi H, Ohigashi H, Ishikawa O, et al. (2007). Gamma-aminobutyric acid (GABA) stimulates pancreatic cancer growth through overexpressing GABAA receptor pi subunit. Cancer Res. 67 67(20):9704–12.
Publisher | Google Scholor - Watanabe M, Maemura K, Oki K, Shiraishi N, Shibayama Y, et al. (2006). Gamma-aminobutyric acid (GABA) and cell proliferation: focus on cancer cells. Histol Histopathol. 21(10):1135–41.
Publisher | Google Scholor - Jiang X, Su L, Zhang Q, He C, Zhang Z, et al. (2012) GABAB receptor complex as a potential target for tumor therapy. J Histochem Cytochem. 60(4):269–79.
Publisher | Google Scholor - Schuller H, Al-Wadei H, Majidi M. (2008). GABA B receptor is a novel drug target for pancreatic cancer. Cancer. 112(4):767–78.
Publisher | Google Scholor

