Research Article
Sustainable Hydrodynamic of Artificial Neural Networks and Logistic Regression Model to Lane Change Serious Conflict at Unsignalized Intersection on Malaysia’s Federal Route
- Fajaruddin Mustakim 1*
- Mohammad Nazir Ahmad 1
- Rabiah Abdul Kadir 1
- Samuel G Charlton 2
- Azlan Abdul Aziz 3
- Othman Che Puan 4
- Motohiro Fujita 5
1Institute IR4.0, Universiti Kebangsaan Malaysia, Selangor, Malaysia.
2Transport Research Group, School of Psychology, University of Waikato, New Zealand.
3RMC, Faculty of Engineering and Technology, Malaysia Multimedia University, Malaysia.
4School of Civil Engineering, University Teknologi Malaysia.
6Graduate School of Eng., Nagoya Institute of Technology, Japan.
*Corresponding Author: Fajaruddin Mustakim, Institute IR4.0, Universiti Kebangsaan Malaysia, Selangor, Malaysia.
Citation: Mustakim F., Mohammad N. Ahmad, Rabiah A. Kadir, Samuel G Charlton, Azlan A. Aziz, et al. (2023). Sustainable Hydrodynamic of Artificial Neural Networks and Logistic Regression Model to Lane Change Serious Conflict at Unsignalized Intersection on Malaysia’s Federal Route. Journal of BioMed Research and Reports, BioRes Scientia Publishers. 2(5):1-16. DOI: 10.59657/2837-4681.brs.23.033
Copyright: © 2023 Fajaruddin Mustakim, this is an open-access article distributed under the terms of the Creative Commons Attribution License, which permits unrestricted use, distribution, and reproduction in any medium, provided the original author and source are credited.
Received: August 08, 2023 | Accepted: August 22, 2023 | Published: August 29, 2023
Abstract
The neural network approach is used to resolve the interdependencies between inputs and outputs in a major conflict on the Malaysian Federal Route’s unsignalized intersection (UI). Two group of datasets being use in this study, they are right turning motor vehicle (RTMs) which consist eight hundred forty-five data and serious conflict lane change model, consist three hundred sixty-three datasets. The aim of the study is to develop serious conflict lane change model by using artificial neuron network (ANN) and logistic regression method (LRM) and to identify the risk of right turning motor vehicle (RTMs) behavior. The input data consists traffic behavior, type of gap, road geometry and traffic facilities. Subsequently the output data will be lane change serious conflict, the study utilize SPSS 26 statistic software. The first section of the study covers the neural network, while the second section describes the strategy utilized to analyses the scientific work.
Third part cover the simple analysis of lane change serious conflict and analysis of gap types. Last part is comparison result between logistic regression method and artificial neuron network. This study reveals that lane change due angular conflict, speed limit 50kph, Gap 3 type, second passenger car, motorcycles, motorcycle stop near passenger car, traffic light and lane width were found significance in lane change serious conflict models. The study has determined that RTMs is motorcycle as vulnerable mode of transport. Besides, this study found that the combination between both method ANN and LRM sustainable hydrodynamic and complement each other especially on explaining the outcomes result.
Keywords: artificial neural networks; logistic regression method; traffic behavior
Introduction
Frequently road accident associated with motorcycles contribute serious injuries. Motorcyclist are unprotected and easily involved in accident compared to passenger car drivers [1]. Motorcycles are responsible for far more fatalities than any other form of mobility due to motorbike riders' susceptibility and exposure to risk. [2]. Since riders only depend on helmet and clothing as available gears of safety protection, this lack of safety protection would be the reason riders are more prone to accident injuries [3]. Physically, motorcycle is more vulnerable due to its shape, much lighter than passenger car, easily to accelerate speed than other road user, without proper protection like passenger car, it has only two wheels to balance himself [4]. In Malaysia, the risk of a motorcycle rider being killed is 17 times greater than that of a passenger car driver [5]. Conversely, the number of people killed in car accidents in Japan is decreasing annually, and most accidents are caused by intoxicated motorists and pedestrians [6]. Typically, the main reason cause by traffic accident were over speeding or speeding issue [7, 8]. It also the key factor contributing the road accident, which 40% of all serious injuries and fatal crash [9]. Furthermore, 34% of all motorcycle death recorded was from speeding factor [10]. A crucial factor in 65 percent of motorcycle-car collisions is visibility [11]. Rainfall, fog and high winds are among the attribute than contribute the lack of visibility, which rise the risk and probability of road crash [12, 13].
The study carried out by E. Petridou et. al., [14] proven human behavior is the main reason 95 % of road crash. Moreover, human error is the biggest reason for the occurrence of motorcycle accidents. Human error, can be define as riders’ behaviors comprising speediness, fatigue, drug, drowsiness, alcohol drunkenness, attentiveness, wearing of fluorescent jacket and safety helmet use [15,16]. Previous study carried out by [17, 18], found in context of drivers’ illegal behavior, psychological factor influences on the risky driving behavior. Moreover, attitude provides a significance impact on motorcyclists’ risky behavior and road crash [19]. L.M. Hurst [20] found in a previous study that different available ITS technology equipment may be installed in vehicles, such as warning systems for lane-change, avoidance system and collision warning, speeding devices, and vision enhancement systems, and helmet/stand reminder systems, which can directly improve motorcycle safety. The study carried out by Turner & Higgins, [21], providing motorcycle with various existing ITS technologies could upgrade the motorcyclist safety protection. Savino et al., [22] predicted motorcycle accidents can be reduce by implementing ITS in the motor vehicles.
A novel method to determine speeds was developed by Agerholm et al. [23], who used data from the Global Navigation Satellite System (GNSS) in relation to floating. The subsequent analysesis showed data from passenger cars from 3216 trips that passed one or more speed-calming measures. Furthermore, Abu et al., [24] proposed implementing ITS for the Anti-lock Braking System (ABS). The study undertaken by Jevtić et al. [25] demonstrated that motorcyclists drove at greater speeds than the drivers of passenger cars, while cases of speeding among motorcyclists were 2.3 times greater than the rate for drivers of cars. The research conducted by Joy et al., [26] involving motorcycle, connecting wireless technology. The function of this technology to warns the rider if speed limit over the accepted level. Moreover, Turner & Higgins, [27] recommended installing the speed limit alert technology for motorcycle rider. As part of a proposal by Yuen et al. [28], motorcycles would be fitted with sensor devices connected to on-board cameras to detect the readings of potential speed changes. Base on the study from Amini et al., [29] a communication regarding the warning alert between passenger car drivers and motorcyclist can assist the road user to keep a safe distance amongst them.
The findings of research conducted by Fragrant and Kockelman [30] revealed that CAVs, also known as connected and automated vehicles, could make traffic flow improvements if they drove using shorter time headways and avoided conflicts through reacting more quickly. In contrast, a key problem they face involves the positions adopted when the traffic conditions feature road-sharing by CAVs and vehicles driven manually (MVs). In behaviorural terms, the driver of an MV may exhibit a different reaction to a CAV driver, as shown in a comparison undertaken by Razmi Rad, Farah, Tale, van Arem and Hoogendoorn [31]. Rahmati et al [32] ppreviously noted the statistical significance of the behavioural differences of humans when they drive behind automated vehiclesin comparison to when they follow MVs. The findings show that a driver of an MV tended to display greater comfort when automated, rather than manual, vehicles were ahead of them.
Gong et al., [33] reveal connected and autonomous vehicle (CAV) fitted on-board sensor and it main function to cover wide area traffic information and carry out precise control in term of safety and traffic efficiency. Yang and Koutsopoulos [34], Hides [35] discover the combination between vehicle-to-infrastructure (V2I) communication, vehicle-to-vehicle (V2V) communication and other sensing technologies enhance CAV user to integrate each other on the intersection. Kang Sun et al. [36] proposed the expansion of the CAV’s capabilities with the development of a method of cooperatively changing lanes. This would incorporate flows of traffic on the respective lanes, making CAVs more mobile and leading to improved streaming and safer manoeuvreswhen changes in lane are required.
A study conducted by Kim et al. [37] revealed that inter-vehicle communications positively affected traffic flows by making them smoother, once a method had been introduced of cooperatively sensing how to avoid collisions when the vehicle changed lanes. Furthermore, through the use of V2V collaboration, Bai et al. [38] modelled the trajectories of accelerated changes in lane. Moreover, Kato et al. [39] demonstrated how a system of changing lanes cooperatively might lead to improvements in road capacityies and reduce, as far as possible, the time needed to change lanes. As revealed by Ward et al. [40],when roads are congested, changing lanes is difficult in single vehicles if the drivers do not cooperatee with those around them. Wei et al., [41] analyzed multiple lane change and lane changing behavior.
The study conducted Van Dijck and van der Heijden [42] stated 4% to 10% of traffic accident attribute from improper lane changes. Research carried out by Amin et al., [43], found 10% collision accident are contribute due to lane change behavior. The statistical data analysis was from Canadian traffic investigation. In the other hand Laval and Daganzo [44], reveal 60% of road crash on highways in China caused from lane change. In addition, lane change will trigger traffic conflict and interrupt traffic flows, which produce traffic swaying and congestion.
Instead of being seen as individual methods, neural networks can be described as systems in which several machine learning algorithms cooperate in the processing ofsubstantial volumes of data. It's a graphic depiction of the model inspired by the way human neuron’s function and process sensory information [45]. Neural network-based machine learning algorithms do not need the use of particular rules to know what to anticipate from the input. Alternatively, we could "instruct" these concepts to a neural network, which we could then employ to tackle problems with unpredictable data [46].
Various layers of neurons make to a neuron network. Synapses connect them and deliver the signal via their edges, where each one has a 'weight’ indicating how strong the network is. "Layers" are used to categorize neurons. Each layer's neuron works logically in sequence. Serial data transmission occurs between layers [47]. ANNs are nonparametric mathematical models that consist of a network of linked processing units called “neurons” that are adaptable and trainable and store experience-based knowledge. As with the brain, ANNs are composed of linked units or neurons responsible for recognizing patterns, predicting outcomes, classifying differences, and learning to adapt. The networks derive information from data and store it in a system of synaptic strengths or weights [48] related to the standard statistical model of prediction. The architecture of an ANN is congruent with the way a human brain solves complex issues. A neural network (ANN) is a distributed processor built of standard processing units called neurons or nodes, each of which has a function for calculating input and output data [49]. The structure of neurons in the human brain is equivalent to that of neurons in the brain. The synaptic weights of inter-neuron connections store the information acquired during learning processes [50]. A neutral network in its optimal state is formed of a few layers, including an input layer, an output layer, and one or maybe more concealed layers [51]. All the linear functions could be simulated by a single hidden layer, where as a pair of hidden layers might even be able to reflect discontinuous layers. It is well established that the more neurons in the buried layer, the more accurate the prediction [52]. Conversely, if the hidden layer contains a large number of neurons, this might affect the over-fitting scenarios and potentially raise the burden on the computing process but not boost the accuracy of the prediction. In consequence, there is no precise method for calculating the quantity of neurons in the black box or hidden layer; rather, experiments with trial and error can be applied [51].
ANNs are capable of detecting non-linear correlations between the data variables. The Multi-Layer Perceptron (MLP) network structure is a widely used ANN network topology. It incorporates an extra layer known as the “hidden layer” into the neuron network’s design. The activation function within the processing unit layers contains non-linear properties, so it is possible to utilise the MLP function when analysingvarious topics. The efficiency of a neural network is determined by the activation function used. Each epoch’s inaccuracy is determined by comparing the outcome of each input to the predicted output [53]. Malaysia is using an artificial neural network technique to find acceptability criteria for smart meters [54]. According to the research, ANNs are capable of identifying complicated linear and nonlinear correlations between input and output parameters. Additionally, neural networks are capable of making more precise predictions than standard regression approaches [55]. However, a limitation was identified in the artificial neuron network, which could be realized from the “black box” method. This specific concern in the neuron network results in an insufficient technique for testing hypotheses and studying the link between input and output variables. When the model was validated, the researchers found it difficult to verify how the neuron network explains the results [56].
The neural network was limited, as seen by the “black box” route. This was a significant issue in the neural network because it couldn't accurately express the method for identifying the connection between evaluating the model, input and output parameters, and testing the hypotheses, as well as the regression constant signs of (-/+) and level of significance for each parameter. Consequently, when the model was examined, the researchers had trouble understanding how the neural nets communicated the results. To address these difficulties, the dataset was analyzed using both artificial neural networks and binary regression techniques concurrently. Through this approach, both methods can complement each other and limitations appearing in the neural network could be explained.
Data collection
Data was collected from three 3-legged unsignalized intersection (UI) using video camera for the gap accepted behavior analysis. In the video recording, all the traffic manoeuvres from minor road crossing onto main stream and from the main stream onto minor road has been analyzed. The selected 3-legged unsignalized intersection were located at Malaysia federal route rural roadway. The intersection consisted two lane minor road connecting four lane major road. The data set contained of a total 845 observations. Figure 1, shows two parameter describing approach speed and gap. The plot of spatial gaps and approaching speed of respecting vehicle on main stream at 3-leg unsignalized intersection. The gap has two categories which are accepted and rejected as distinguished in the Figure 1. Average approach speed for second vehicle on major road allowing RTM were 62 kph. Average accepted gap for right turning vehicle for all 3- leg unsignalized intersection were 8 seconds. Meanwhile average rejected gap for right turning vehicle were 1.82 seconds.
Figure 1: Plot of spatial gaps and approach speed
Gap Acceptance
For right-turning automobiles, a gap sequence has been clearly established [57]. Figure 2 illustrates four distinct forms of gap patterns for right-turning vehicles at a particular UI. The gap types are explained as follows. Gap 1 refers to the space between two automobiles on either track 1 or track 2. The two cars are as follows: the first passes the RTM, and the second permits the RTM to make a right turn. The defination of Gap 2 is the interval between a pair of cars on the third track, while the defination of Gap 3 is the interval between the vehicle that first passes the RTM on the first or second track and the vehicle on the third track (the vehicle placed second). The space between the car passing the RTM in track 3 and the vehicle in either track 1 or 2 is specified as Gap 4 (the second motor vehicle). The gap that the RTM accepts is the time and pattern for opting to make a right turn, according to this research. By comparison, the rejected gap is the largest gap for which the RTM will not turn right.
Figure 2: Right turning at a three-leg unsignalized intersection, the four potential gap patterns for motor vehicle acceptance or rejection (UI)
Serious Conflict Lane Change Situation
In the video analysis, the lane change angular conflicts impact contributes three conflict situations. Firstly, a conflict over angles because of a lane change might occur should the main stream be entered by the crossing of a right-turn car from a secondary road. Any vehicle in lane three and on the left risks a collision, so this driver would opt for a lane change to the fourth lane. As seen in Figure 3, this conflict arose as a result of an angle conflict. Second, lane changes due to rear-end collisions occur when a side road right-turn transitions to the main route. Slowing down the pace of the vehicles in lane three will allow the right turn vehicle to pass. In contrast, it is likely that the car that followswill experience a back-end impact and thus initiate a lane change from the third to the fourth lane,which Figure 3 indicates. Third, when the RTM from the side road entered the principal road, a lane change conflict occurred due to a nose to tail collision. Any vehicle coming from the right in the first lane risks a potential impact should they switch lanes quickly due to the first and second subsequent vehicles experiencing nose-to-tail touching, as Figure 3 shows.
Figure 3: Categories of traffic conflicts at un-signalized T junction 1=lane change because of angular conflict, 2a and 2b= lane change because of nose to tail.
Analysis of Serious Conflict Lane Change
Figure 4 depicts the frequency of right-turning motor vehicles based on gap acceptance at unsignalized intersections (UI). In total, 363 RTM data were used in the analysis. The approved gap times of 6 and 7 seconds yielded the maximum number of RTMs. Both acceptance timings stated a frequency of more than 50 RTMs. In the last 6 seconds, 33 incidents of serious conflict lane change (SCLC) have occurred at this intersection. Gap 3 seconds, Gap 4 seconds and Gap 5 seconds has obtained SCLC 8, 11 and 14 respectively. Meanwhile Figure 5, represent the traffic classification portion of vehicle make RTMs. Motorcycle, passenger car, van and lorries recorded 175 (48%), 149 (41%), 25 (7%) and 13 (4%) respectively.
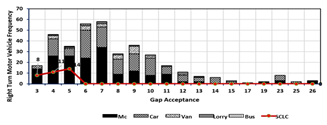
Figure 4: Acceptable gap frequency for right-turning motor vehicles (RTMs) that experiencea major lane change conflict at intersections with no signals.
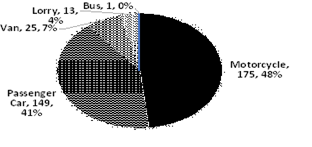
Figure 5: Traffic classification portion for right turn motor vehicle (RTMs) at the unsignalized intersection (UI).
In this study 33 total number of serious conflict due lane change have been identified. Figure 6, shown serious conflict lane change (SCLC) by type of right turn motor vehicles (RTM). Motorcycle stated the highest number (26), 79% involved in conflict follow by passenger car (6),18% and van only (1) 3%.
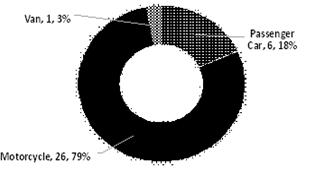
Figure 6: Serious conflict lane change (SCLC) by type of right turn motor vehicles (RTM)
Analysis of Gap Types
Total data of 363 RTMs was applied in the analysis of gap types. Figure 7 illustrated, range of gap types in seconds for RTM at unsignalized intersection (UI). Gap 3 type recorded the shortest gap acceptance 3.00 seconds and the longest gap acceptance with 26.85 seconds. Meanwhile, gap 2 type experienced gap acceptance range between 3.00 - 10.43 seconds. Next, gap 1 type obtained gap range between 4.06 – 14.78 seconds. Gap 4 type have recorded gap range between 4.17 - 23.35 seconds. In other hand, average for gap 1, gap 2, gap 3 and gap 4 stated 8.09 seconds, 6.55 seconds, 5.09 seconds and 8.71 seconds respectively. Gap 3 type recorded minimum average 5.09 seconds comparing to other. Consequently gap 2 and gap 3 share the lowest gap acceptance with 3.00 seconds.
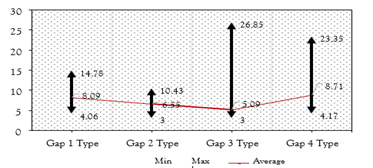
Figure 7: Range of gap types in seconds for right turn motor vehicle (RTM) at unsignalized intersection (UI).
Figure 8 illustrated, frequency of accepted gap from serious conflict lane change (SCLC) dataset. Gap 3 type stated the highest accepted gap and SCLC with 199 and 31 respectively. Meanwhile Gap 1 type, gap 2 type and gap 4 type obtained accepted gap 98, 53 and 13 respectively. Subsequently, gap 4 type completed 13 accepted gap while both gap1 type and gap 2 type received lowest SCLC with 1 case.
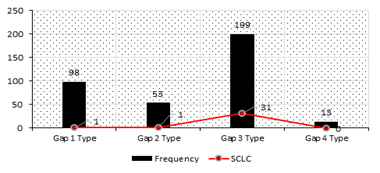
Figure 8: Frequency of accepted gap type and serious change lane conflict (SCLC) at unsignalized intersection (UI).
Analysis of Motorcycle Stop near Passenger Car
Motorcycle stops near passenger car (McS) define as right turn motor vehicle (RTM) is motorcycle which have experience in waiting and turning simultaneously with passenger car at (UI). In this study 39 cases McS have been recorded. Figure 9, represent the McS frequency at unsignalized intersection. This situation has created 5 cases serious conflict lane change, 3 event in gap acceptance three seconds. Meanwhile, each one case in four- and five-seconds gap acceptance. Consequently Figure 10, shown the McS frequency accepted gap and SCLC. Gap 3 type obtained the highest gap accepted 21 events. Meanwhile gap 1 type, gap 2 type and gap 4 type received 14. 3, and 1 respectively. All the SCLC only experience in gap 3 type and stated 5 cases.
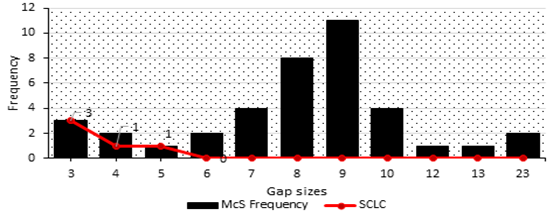
Figure 9: Motorcycle stop near car passenger (McS) frequency and serious conflict lane change (SCLC) at unsignalized intersection (UI).
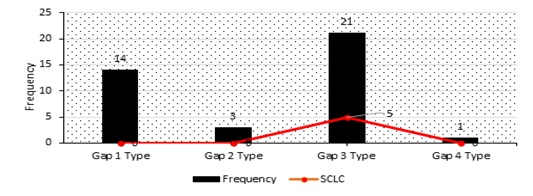
Figure 10: Motorcycle stop near car passenger (McS) frequency accepting gap type and serious conflict lane change at unsignalized intersection (UI).
Development of Serious Conflict Model
The total 363 datasets for Right Turning Motor Vehicle (RTM) were utilized in development of serious conflict model. Out of 363 RTMs dataset, 33 RTVs have been identified experience change lane serious conflict and set as dependent variable. Subsequently traffic behavior, road geometry and others parameter were set as independent variables or predictors. Three of the most often used strategies are to commence with an empty model and to gradually add covariates (forward selection); to commence with a complete model and to gradually eliminate covariates (backward selection); or to combine both forward and backward variables by adding or eliminating covariates (stepwise selection). To suit the data and connect the impact of the different elements of the lane change serious conflict model, logistic regression methods were implemented. The model was developed and validated using the SPSS Statistics 26 programmed. The significance intervals of 90%, 95%, and 99 percent were determined using a stepwise selection procedure. Serious conflict behavior model attributes are described in Table 1.
Table 1: Attributes for a serious conflict model.
| Abbr. | Description |
| RTM | RTM=If a motor vehicle turns right at a gap, it gets a 1; otherwise, it gets a 0. |
| Gap | A Gap which is rejected or accepted (sec) |
| Car | Car=1 if the RTM is a car, and 0 if otherwise |
| Mc | Mc=1 if the RTM is a motorcycle, and 0 if otherwise |
| Rider | Rider=1 if the RTM is a single-rider motorcyclist, and 0 if otherwise |
| PRider | PRider=1 if the RTM is a Pillion Rider, and 0 if otherwise |
| Van | Van=1 if the RTM is a van, and 0 if otherwise |
| McS | McS=1 if the RTM is a motorcycle stopping near a car’s passenger side on a minor road, and 0 if otherwise. |
| LW | LW= lane width |
| SL50 | SL50= 1 if the speed limit less than or equal 50kph, and 0 if otherwise. |
| Conf | Conf=If a motor vehicle turns right at a gap, it gets a 1; otherwise, it gets a 0. |
| Nose-tail | Nose-tail=If a nose-tail occurs in a significant conflict, 1; otherwise, 0. |
| LAC | Lane changing due to angular conflict = If Lane switching happens as a result of angular conflict, 1; otherwise, 0. |
| LNT | Lane changing due to nose to tail conflict = If Lane change happens owing to a nose to tail conflict, 1; otherwise, 0. |
| Gap1 | Gap1=1 if the gap is the gap pattern 1 in Fig. 2, and 0 if otherwise. |
| Gap2 | Gap2=1 if the gap is the gap pattern 2 in Fig. 2, and 0 if otherwise. |
| Gap3 | Gap3=1 if the gap is the gap pattern 3 in Fig. 2, and 0 if otherwise. |
| Gap4 | Gap4=1 if the gap is the gap pattern 4 in Fig. 2, and 0 if otherwise. |
| Tlight | Tlight=1, if all vehicles are at the UI, and 0 if otherwise. |
Serious Conflict due Lane Change Model Using LRM
This section further explores the factors that cause serious conflicts during lane changes. The models for serious conflict (see Table 2) were created using logistic regression on a total of 363 approved RTV gaps. The dependent variable was severe conflict, which was set to 1 if an RTV faced a serious conflict and 0 if otherwise. Table 1 details the variables.
Table 2: Serious conflict due lane change LRM models
| Attributes | LRM Model 1 | LRM Model 2 | LRM Model 3 |
| Variable | Variable | Variable | |
| Constant | 11.16 | -8.34 | -10.5 |
| (2.24)* | (12.13)*** | (18.68)*** | |
| Gap 3 type | 3.98 | 4.46 | 3.46 |
| (7.73)*** | (8.34)*** | (8.26)*** | |
| SPC | 3.9 | 3.51 | 2.93 |
| (4.131)** | (3.74)** | (3.74)** | |
| LAC | 5.22 | 5.81 | 5.1 |
| (18.97)*** | (22.30)*** | (25.01)*** | |
| SL50 | -1.34 | -1.5 | -1.2 |
| (6.33)*** | (4.99)*** | (3.67)* | |
| Mc | - | - | 2.81 |
| (8.10)*** | |||
| McS | - | - | 2.31 |
| (4.163)** | |||
| LW | -1.37 | - | - |
| (5.48)** | |||
| Tlight | - | -3.49(9.78)*** | - |
| Sample | 363 | 363 | 363 |
| Nagelkerke R2 | 0.62 | 0.61 | 0.57 |
| Hitting Ratio-Serious Conflict | 46% | 46% | 46% |
| Hitting Ratio-Total | 94% | 95% | 95% |
*, **, ***=Significant at the 90%,95% and 99% level, respectively.
Numerous attempts were made to incorporate dummy variables for every gap type into the model (as seen in Figure 2). The result variables specified in Model 1 were the Gap 3 type, SPC (Second Passenger Car), LAC (Lane change due angular conflict), SL50 (Speed limit less than 50 kph), and LW (Lane Width). Lane width in all unsignalized Intersections (UI) ranges between 14 meters and 21 meters. Meanwhile, significance variables in Model 2 were Gap 3 type, SPC, LAC, SL50, and TL (Traffic light). Additionally, for Model 3, the remaining variables produced the Gap 3 type, SPC (Second Passenger Car), LAC (Lane Change due to Angular Conflict), SL50 (Speed Limit 50kph), Mc (Motorcycle), and McS (RTM was a motorcycle stopping near a passenger car on a minor road). Similarly, we attempted to mainstream the approaching speed variable and other dummy variables for vehicle approaching speeds (i.e., speeds of less than 40 kph, 45 kph, and so on). Finally, we discovered that speeds less than or equal to 50 kilometers per hour are the most influential. Thus, the models retained the SL50 dummy variable (approaching speed of the vehicle that permits RTMs to enter is less than or equal to 50 kph).
In Model 1, Model 2, and Model 3, the negative sign of SL50 indicates that major collisions often occur when vehicles reach speeds of more than 50 kilometers per hour. Meanwhile the positive sign in the Gap 3 pattern and SPC (Second Passenger Car allowing RTM), can be interpreted to mean that serious conflicts often occur when RTMs accept the Gap 3 pattern and SPC. Furthermore, the positive sign in LAC (Lane Change due Angular Conflict) indicates that serious conflicts frequently occur when RTMs experience LAC.
Alternatively, in Model 1, the negative sign of LW (Lane Width) indicate that RTMs likely to accept longer gap or RTMs have safe turning with less conflict. Meanwhile in Model 2, the negative sign of TL (Traffic Light) indicates that RTMs likely to accept longer gap or RTMs have safe turning with less conflict. The existence of traffic light approximately 100 meters from the intersection have influenced the RTMs to accept longer gap. In another hand, positive sign of Mc (Motorcycle RTM) and McS (RTM were motorcycle stop near passenger car in minor road) likely occurred serious conflict. Number of motorcycles (Mc) in the model recorded 132 and McS in stated 39 cases with average waiting time of 23 seconds.
Given the importance of the SL50 variable in avoiding the Gap 3 pattern, it was proposed that the speed limit for vehicles on the mainline at the intersection be 50 kph. Taking into consideration current technological advancements, using the following steps in conjunction with the installation of speed cameras will be more efficient at educating drivers about the dangers of unlawful movements. These changes are designed to decrease the frequency of catastrophic collisions, increase traffic safety, and better organise vehicle movements. However, we must thoroughly study each item and conduct additional gap analysis studies in other parts to determine the most appropriate measures for execution.
Artificial Neuron Network Model
The purpose of this research is to ascertain the link between the analysed inputs and the outcomes. The result is the lane shift, which creates a serious conflict for right-turn motor vehicles (RTMs) transitioning from a small road to a major route near an unsignalized intersection (UI) on the Federal Route. Total number 363 of gap acceptance RTMs were used in the analysis and 33 samples of RTMs involved in lane change serious conflict. They are 8 input parameters selected in the analysis namely gap type 3, SL50, lane change angular conflict, motorcycles, motorcycle stop near passenger car, lane width, traffic light and second vehicle passenger car.
The association between input and output was represented by the artificial neural networks. This method is used in the framework of regression, which requires the use of a more complex methodology like probit or logit. For the study, SPSS 26 software was used to conduct the analysis, which had the capability to do artificial neural network analysis. The process requires that both dependent and independent variables be entered. Then, it is critical to pick the program’s route. Three processes are involved in this process: analysis, neural networks, and multilayer perceptron. In the section, lane change serious conflict will be the dependent variable and other predictors represent in covariates. Following that, under the network structure section, the description, diagram, and synaptic weights must be selected. In addition, thick model summary, classification results, and independent variables important analysis are required in the network performance path. The possible to address which of the parameters contribute the significance role by comparing the result to the beta coefficient, level of significance, Nagelkerke R2 and hitting ratio in Logistic Regression Method. In this study, total 363 dataset were utilized to the development of lane change serious conflict using ANN. Table 2, shown training processing for Model 1, 2 and 3 involved 252, 264 and 244 samples respectively. Meanwhile in testing analysis consist 111, 99 and 199 samples respectively.
Table 3: Lane Change Serious Conflict ANN Processing Summary
| Attributes | ANN Model 1 | ANN Model 2 | ANN Model 3 | |||
| Importance | Normalized Importance | Importance | Normalized Importance | Importance | Normalized Importance | |
| Gap 3 type SPC LAC SL50 Mc McS LW Tlight | 0.123 | 36.90% | 0.253 | 72.40% | 0.142 | 46.70% |
| 0.169 | 50.70% | 0.13 | 37.10% | 0.147 | 48.40% | |
| 0.332 | 100.00% | 0.349 | 100.00% | 0.304 | 100.00% | |
| 0.068 | 20.50% | 0.077 | 22.20% | 0.069 | 22.60% | |
| - | - | 0.193 | 63.60% | |||
| - | 0.144 | 47.20% | ||||
| 0.308 | 92.70% | - | ||||
| 0.191 | 54.80% | |||||
| Total Sample | 363 | 363 | 363 | |||
| Training/Testing | 252/111 | 264/99 | 244/119 | |||
| Area Under Curve Training (Mean Square | 0.95 | 0.91 | 0.93 | |||
| Error) Testing (Mean Square | 0.072 | 0.051 | 0.051 | |||
| Error) | 0.056 | 0.064 | 0.057 | |||
| Training Time | 00:00.1 | 00:00.2 | 00:00.2 | |||
Area under curve (AUC) is a useful statistic summary of the network in the ANN model. All three model obtain AUC more than 0.90 which mean the model exhibit well prediction. Furthermore, in Training process, the model was run until Model 1, Model 2 and Model 3 stated mean square error of 0.072, 0.051 and 0.051 respectively. Meanwhile in testing processes Model 1, Model 2 and Model 3 achieve mean square error 0.056, 0.064 and 0.057 respectively. Subsequently training time for ANN Model 1, ANN Model 2 and ANN Model 3 obtain 0:00:00.14, 0:00:00.17 and 0:00:00.19 respectively.
The development of serious conflict lane change using the neural network. Only significant parameter identified by logistic regression method (Table-1) used as inputs to the ANNs model. Out of 45 parameter traffic behavior and road geometry, eight predictors selected to fit into the model. Eight chosen parameters were lane change angular conflict, motorcycle stop near passenger car, gap 3 type, second vehicle passenger car, speed limit 50 kph, lane width and traffic light. This study has developed 3 model for artificial neuron network as shown in Table 2. Model 1 has five significance variables (lane change angular conflict, second vehicle passenger car, gap 3 type, speed limit 50kph and lane width) as shown in Figure 11. Model 2 has five predictors (lane change angular conflict, second vehicle passenger car, gap 3 type, speed limit 50kph and traffic light) as demonstrate in Figure 12. Model 3 has six inputs parameters (lane change angular conflict, motorcycle stop near passenger car, gap 3 type, second vehicle passenger car and speed limit 50 kph) as illustrated in Figure 13. All ANN’s model prediction have one hidden layer and one output layer. The generated number of hidden layers are five, five and seven neuron or unit for ANN Model 1, 2 and 3 respectively.
In Model 1, it appears that variable related to, angular conflict (100%) has a greater effect on how the lane change serious conflict at unsignalized intersection occur. Followed by, lane width (92.7%), second passenger car (50.7%), gap 3 type (36.9%) and speed limit 50kph (20.5%). In Model 2, angular conflict obtained normalized importance (100%), next gap 3 type (72.4%), traffic light (54.8%), second passenger car (37.1%) and speed limit 50kph (22.2%) and Third Model, again angular conflict stated highest normalized importance (100%), then motorcycle (63.6%), second passenger car (48.4%), motorcycle stop near passenger car (47.2%), followed by gap 3 type (46.7%) and speed limit 50kph (22.6%).
Figure 11: Artificial Neuron Network Model 1
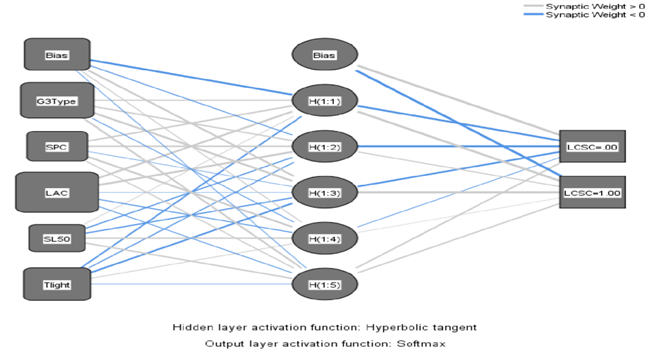
Figure 12: Artificial Neuron Network Model 2
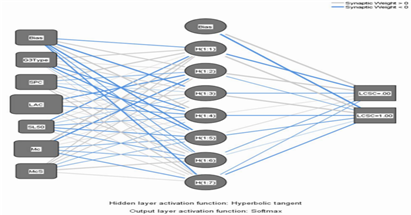
Figure 13: Artificial Neuron Network Model 3
Discussion
The study found lane change due angular conflict stated highest normalized importance variables (100%) for all three ANN’s Model. As well as all Logistic Regression Models with significant level of (99%). It proved both method, present significance impact on lane changes serious conflict. To overcome this issue, the authority should provide safety measure such as right turn channelization on major road or installation of traffic light. Lane width on major road obtain second higher (92.7%) normalized importance in ANN Model 1. In the other hand, Logistic Regression Model 1, lane width found (95%) significance level. The negative sign of this variable in model means the increasing lane width likely reduce the lane change serious conflict on UI. Motorcycle RTMs succeed (63.6 %) normalized importance for ANN Model 3, meanwhile in Logistic Regression Model 3, Motorcycle RTMs stated (99%) significance confident level. This scenario indicates, right turning vehicle is motorcycle likely to contribute lane change serious conflict. Gap 3 type achieve (72.4%, 46.7% and 36.9%) normalized importance for ANN Model 2, ANN Model 3 and ANN Model 1 respectively. Subsequently in Logistic Regression Model 1, LRM 2 and LRM 3 performed (99%) significance level. This indicates, the RTMs making decision to accept gap 3 type likely increase number of lanes change serious conflict.
Traffic light stated (54.8%) normalized importance in ANN model 2. However, in Logistic Regression Model 2, traffic light indicates (99%) significance level. Therefore, this variable likely improves the traffic safety and avoid any conflict situation for right turning vehicles. Second vehicle passenger car record (50.7 %, 48.4% and 37.1%) normalized importance for ANN Model 1, ANN Model 3 and ANN Model 2 respectively. Meanwhile in Logistic Regression Model 1, LRM 2 and LRM 3 second vehicle passenger car passing RTMs obtain (95%) significance level. This result can explain that second vehicle passenger car frequently create lane change serious conflict at UI. Speed limit 50 kph reach (22.6%, 22.2% and 20.5%) normalized importance for ANN Model 3, ANN Model 2 and ANN Model 1 separately. Consequently, in Logistic Regression Model 1, LRM 2 and LRM 3 speed limit 50kph achieve (99%), (99%) and (90%) confident level correspondingly. This describe the speed limit more than 50kph, encourage lane change serious conflict to be occur is higher. Angular conflict parameter achieved (100%) normalized importance (NI). Lane width, motorcycle RTM, gap 3 type, traffic light and second vehicle passenger car input variables determine range between (50% - 95%) normalized importance. Motorcycle stops near passenger car received about (50%) normalized importance. Only speed limit 50kph stated normalized importance between ranges (20% - 30%). Although speed limit input variable in ANN’s Model has normalized importance less than 30%, however it found significance in Logistic Prediction Model 1, LRM 2 and LRM 3.
Since gap 3 type recorded the lowest gap accepted and average gap accepted with 3.00 seconds and 5.09 seconds respectively as shown in Figure 7, which indicate RTMs experience short gap acceptance. Consequently gap 3 type mark highest number of SCLC 31 and achieved maximum accepted gap at 199 frequencies as illustrated in Figure 8. Moreover gap 3 types were found statistically significant at 99% in LRM1, LRM2 and LRM3. Decision to accept gap 3 type for RTMs likely increasing number of lanes change serious conflict. Therefore, gap 3 type were justified as the vulnerable type of gap acceptance This study would like to propose, gap 3 type could be once of parameter for monitoring tool at critical three leg intersection.
Motorcycle stops near passenger car on minor road at unsignalized intersection (McS) gain (47.2%) normalized importance for ANN Model 3. Simultaneously in Logistic Regression Model 3 McS obtained significance level (95%). This indicates, McS likely create lane change serious conflict that can trigger accident at the intersection. Countermeasure such as provide the separate lane or segregation lane on minor road at UI would be adequate to avoid the number of serious conflict and accident. In addition, this study would like to propose the implementation of the Advance Stop Lanes Intersection (ASLI) for motorcycle at unsignalized intersection. ASLI define as motorcycle box, color either road marking red, green or orange. The motorcycle box position was parallel with stop line on the UI and has sizes of (4-meter x 3.75 meter) as shown in Figure 11. It main function was to allow motorcycles to head start turning at UI safely. The idea of ASLI originated from previous studied carried out by Atkin [58] found ASLs benefit the cyclist in term of safety at signalized intersection especially during the maneuverer, minimize conflict, and provide cyclist priority over other road vehicles. Recently Mulyadi [59] reveal red box for motorcycle efficiently improve the head start motorcycle turning movement at signalized intersection, reduce 39% traffic conflict, avoid motorcycle changing lane and increase traffic flow.
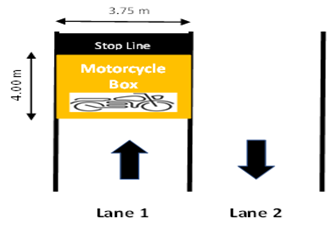
Figure 14: Motorcycle box at unsignalized intersection (UI)
Conclusion
This study found that even though same input and output variables were applied in the ANN’s Model, the outcome remains inconsistent, such as normalized importance. Thus, this study decides several attempts in the analysis until find the appropriate result. In the other hand, Logistic Regression Method give consistency result in final outcomes (such as significance level) by implementing same independent and dependent variables. This study reveals that the combination between both method ANN and LRM could complement each other especially on explaining the outcomes result and may sustainable hydrodynamic the application of artificial neuron network in the research work.
Moreover, after frequent effort analyses using artificial neuron network (ANN), each variable in the model necessary to obtain normalized importance (NI) between 10% -100%. Typically, this range of NI indicate the parameter have significance level more than 90% in logistic regression method (LRM). This study has identified the serious conflict lane change characteristic for right turn motor vehicle (RTMs) were lane change angular conflict, gap 3 patterns, RTMs is motorcycle, gap acceptance less than 6 seconds, motorcycle stop near passenger car on minor road, second passenger car passing RTMs and speed limit 50kph. Since RTMs is motorcycle is stated 99% significance confident level in Logistic Regression Method (LRM 3) and recorded 79% highest number involved in serious conflict lane change (SCLC) as shown in Figure 6. Therefore, motorcyclist have been identifying as vulnerable road user compare with other vehicles especially during right turning maneuver. More attention needs to be carried out in order to reduce number of SCLC and consequently reduce number of accidents.
This research work contributes a significance outcome, in term of the guideline practically on artificial neural networks for 363 dataset of right turn vehicles at unsignalized intersection (UI). The study concentrating on gap acceptance traffic behavior analysis to identify the significance factor effect to the lane change serious conflict. The result indicates the interrelationships between inputs and outputs. Input variables were lane changing due angular conflict, speed limit 50kph, gap 3 type, second passenger car, motorcycles, motorcycle stop near passenger car, traffic light and lane width. In the future, input data can be extended by using more quantitative data such as traffic behavior variables as well as qualitative data. This study would like to analysis more UI that prone to serious conflict lane change and accident causes. Furthermore, the little finding from this paper could serve as basic research for road safety design, autonomous vehicle as well as vehicle to vehicle communication.
References
- B.H. Ang, S.W.H. Lee, J. Oxley, K.K. Yap, K.P. Song, et al. (2019). Self-regulatory driving and riding practice amongst older adults in Malaysia. Transp. Res. Part F Traffic Psychology Behavior, 62:782-795.
Publisher | Google Scholor - J.J. Anaya, A. Ponz, F. García, E. Talavera. (2017). Motorcycle detection for ADAS through camera and V2V communication, a comparative analysis of two modern technologies. Expert Syst. Appl., 77:148-159.
Publisher | Google Scholor - M.K. Norfaizah, M.M. AbdulManan, M.J. Nusayba. (2015). A Safety Review of Exclusive Motorcycle Lane Access.
Publisher | Google Scholor - J.D. Kathleen Michon. (2017). Motorcycle Accidents: An Overview | Nolo.com.
Publisher | Google Scholor - M.K.A. Ibrahim, H. Hamid, T.H. Law, S.V.Wong. (2018). Evaluating the effect of lane width and roadside configurations on speed, lateral position and likelihood of comfortable overtaking in exclusive motorcycle lane. Accident Analysis Prevention, 111:63-70.
Publisher | Google Scholor - K. Ichiro Nakao, Y. Tatara. (2019). An analysis of alcohol and drug intake in forensic autopsy cases of traffic fatalities. IATSS Res, 43:75-78.
Publisher | Google Scholor - N. Agerholm, D. Knudsen, K. Variyeswaran, Speed-calming measures and their effect on driving speed – test of a new technique measuring speeds based on GNSS data, Transp. Res. Part F Traffic Psychology Behavior. 46:263-270.
Publisher | Google Scholor - Kassim Abu, K. Anwar, H. Hizal. (2017). Advancement in Vehicle Safety in Malaysia from Planning to Implementation, 4:704-714.
Publisher | Google Scholor - S.M.R. Ghadiri, J. Prasetijo, A.F. Sadullah, M. Hoseinpour, S. Sahranavard. (2013). Intelligent speed adaptation: preliminary results of on-road study in Penang, Malaysia, IATSS Res. 36 106-114.
Publisher | Google Scholor - L.D. Dodge, M. Halladay, I.T.S. (2018). America, Motorcycle Safety and Intelligent Transportation Systems, 10.
Publisher | Google Scholor - D. Atalar, P. Thomas. (2019). Powered two-wheeler crash scenario development. Accident Analysis Prevention, 125:198-206.
Publisher | Google Scholor - M.G. Masuri, K.A.Md Isa,M.P. Mohd Tahir. (2019). Children, youth and road environment: road traffic accident, Asian J. Environ. Stud. 2 (2017) 13.
Publisher | Google Scholor - H. Worley. (2006). Road traffic accidents increase dramatically worldwide, Population Ref. Bur. Web Site, 1-8.
Publisher | Google Scholor - E. Petridou, M. Moustaki, in: E. Petridou, M. Moustaki (Eds.), (2000). Human Factors in the Causation of Road Traffic Crashes. Springer Stable, 819-826.
Publisher | Google Scholor - MAIDS. Motorcycle Accidents In-Depth Study.
Publisher | Google Scholor - J. Rogé, V. El Zufari, F. Vienne, D. Ndiaye. (2015). Safety messages and visibility of vulnerable road users for drivers. Saf. Sci., 79:29-38.
Publisher | Google Scholor - F. Chang, P. Xu, H. Zhou, J. Lee, H. (2019). Huang, Identifying motorcycle high-risk traffic scenarios through interactive analysis of driver behavior and traffic characteristics, Transp. Res. Part F Traffic Psychol. Behav. 62:844-854.
Publisher | Google Scholor - D. Antoniazzi, R. Klein. (2019). Risky riders: a comparison of personality theories onmotorcyclist riding behaviour, Transp. Res. Part F Traffic Psychol. Behav. 62:33-44.
Publisher | Google Scholor - D. Stanojević, P. Stanojević, D. Jovanović, K. Lipovac. (2018). Impact of riders' lifestyle on their risky behavior and road traffic accident risk, J. Transp. Saf. Secur.
Publisher | Google Scholor - L.M. Hurst. (2011). Motorcyclists: A Literature Review and Exploratory Analysis of Fatalities and Serious Injury Collisions in Relation to Motorcyclists: Implications for Education. Engineering and Enforcement Initiatives, Plymouth University, UK.
Publisher | Google Scholor - P.O.Wanvik (2009). Effects of road lighting: an analysis based on Dutch accident statistics 1987-2006, Accid. Anal. Prev. 41(1):123-128.
Publisher | Google Scholor - P. Savolainen, F. (2007). Mannering, Probabilistic models of motorcyclists' injury severities in single- and multi-vehicle crashes, Accid. Anal. Prev., 39(5):955-963.
Publisher | Google Scholor - N. Agerholm, D. Knudsen, K. Variyeswaran. (2016). Speed-calming measures and their effect on driving speed – test of a new technique measuring- speeds based on GNSS data. Transp. Res. Part F Traffic Psychol. Behav. 46:263-270.
Publisher | Google Scholor - Kassim Abu, K. Anwar, H. Hizal. (2017). Advancement in Vehicle Safety in Malaysia from Planning to Implementation, 4:704-714.
Publisher | Google Scholor - V. Jevtić, M.Vujanić, K. Lipovac, D. Jovanović, D. Pešić. (2015). The relationship between the travelling speed and motorcycle styles in urban settings: a case study in Belgrade. Accid. Anal. Prev., 75:77-85.
Publisher | Google Scholor - S.P. Joy, V.S. Sunitha, V.R.S. Devi, A. Sneha, S. Deepak, A.J. Raju. (2016). A novel security enabled speed monitoring system for two wheelers using wireless technology, Proc. IEEE Int. Conf. Circuit. Power Comput. Technol. ICCPCT.
Publisher | Google Scholor - P.A. Turner, L. Higgins. (2014). Intelligent Transportation System (ITS) Technologies for Motorcycle Crash Prevention and Injury Mitigation, 1-12.
Publisher | Google Scholor - C.W. Yuen, M.R. Karim, A. (2017). Saifizul, Analysis of motorcyclist riding behavior on speed table, Sci. World J.
Publisher | Google Scholor - E. Amini, M. Tabibi, E.R. Khansari, M. Abhari. (2018). A vehicle type-based approach to model car following behaviors in simulation programs (case study: Car motorcycle following behavior), IATSS Res. 43:14-20.
Publisher | Google Scholor - Fagnant, D. J., & Kockelman, K. (2015). Preparing a nation for autonomous vehicles: Opportunities, barriers and policy recommendations. Transportation Research Part A: Policy and Practice, 77, 167-181.
Publisher | Google Scholor - Razmi Rad, Solmaz, Farah, Haneen, Taale, et al. (2020). Design and operation of dedicated lanes for connected and automated vehicles on motorways: A conceptual framework and research agenda. Transportation Research Part C: Emerging Technologies, 117:102664.
Publisher | Google Scholor - Rahmati, Y., Khajeh Hosseini, M., Talebpour, A., Swain, B., & Nelson, C. (2019). Influence of Autonomous Vehicles on Car-Following Behavior of Human Drivers.
Publisher | Google Scholor - Transportation Research Record: Journal of the Transportation Research Board, 2673(12):367-379.
Publisher | Google Scholor - W. Liu, Z. Wang, X. Liu, N. Zeng, Y. Liu, and F.E. (2017). Alsaadid: A survey of deep neural network architectures and their application. Neurocomputing, 234:11-26.
Publisher | Google Scholor - Gong, S., Zhou, A., Peeta, S., (2019). Cooperative adaptive cruise control for a platoon of connected and autonomous vehicles considering dynamic information flow topology. Transp. Res. Rec., 2673(10):185-198
Publisher | Google Scholor - Yang, Q., Koutsopoulos, H.N., (1996). A microscopic traffic simulator for evaluation of dynamic traffic management systems. Transp. Res. Part C: Emerg. Technol. 4 (3):113-129.
Publisher | Google Scholor - Hidas, P., 2002. Modelling lane changing and merging in microscopic traffic simulation. Transp. Res. Part C: Emerg. Technol. 10(5-6):351-371.
Publisher | Google Scholor - Kang, S., Xiangmo Z., Xia W. (2021). A cooperative lane change model for connected and autonomous vehicles on two lanes highway by considering the traffic efficiency on both lanes. Transp. Res. Inter. Pers. 9:100310.
Publisher | Google Scholor - Kim, S.W., Qin, B., Chong, Z.J., Shen, X., et al. (2014). Multivehicle cooperative driving using cooperative perception: design and experimental validation. IEEE Trans. Intell. Transp. Syst., 16(2):663-680.
Publisher | Google Scholor - Bai, H., Shen, J., Wei, L., Feng, Z., (2017). Accelerated lane-changing trajectory planning of automated vehicles with vehicle-to-vehicle collaboration. J. Adv. Transp.
Publisher | Google Scholor - Kato, S., Tsugawa, S., Tokuda, K., Matsui, T., Fujii, H., (2002). Vehicle control algorithms for cooperative driving with automated vehicles and intervehicle communications. IEEE Trans. Intell. Transp. Syst. 3(3):155-161
Publisher | Google Scholor - Ward, E., Evestedt, N., Axehill, D., Folkesson, J., (2017). Probabilistic model for interaction aware planning in merge scenarios. IEEE Trans. Intell. Veh., 2(2):133-146.
Publisher | Google Scholor - Wei, H., Meyer, E., Lee, J., Feng, C., (2000)a. Characterizing and modeling observed lane changing behavior: lane-vehicle-based microscopic simulation on an urban street network. Transp. Res. Rec. 1710, 104–113.
Publisher | Google Scholor - Van Dijck, T., van der Heijden, G.A. (2005). Vision Sense: an advanced lateral collision warning system. In: IEEE Proceedings. Intelligent Vehicles Symposium, 296-301.
Publisher | Google Scholor - Amin, M.S.R., Zareie, A., Amador-Jiménez, L.E., (2014). Climate change modeling and the weather-related road accidents in Canada. Transp. Res. Part D: Transp. Environ. 32:171-183.
Publisher | Google Scholor - Laval, J.A., Daganzo, C.F., 2006. Lane-changing in traffic streams. Transp. Res. Part B: Methodol. 40(3):251-264.
Publisher | Google Scholor - John A. (2018). Hertz: Introduction to the theory of neural computation. CRC Press.
Publisher | Google Scholor - Arredondo-Velazquez, M. Diaz-Carmona, J. Torrez-Huitzil, C. Padilla-Medina, A. and Prado-Olivarez J. (2020). A: Streaming architecture for convolutional neural networks based on layer operations chaining. Journal of Real-Time Image Processing, 1-19.
Publisher | Google Scholor - B. Barbour, N. Brunel, V. Hakim, J.P. (2007). Nadal: What can we learn from synaptic weight distributions? Trends in Neurosciences, 30:622-629.
Publisher | Google Scholor - S. Ledesma, M. A. Ibarra Manzano, M. G. Garcia Hernandez, D. L. (2017). Almanza Ojeda: Neural lab a simulator for artificial neural networks. in: 2017 Computing conference, 716-721.
Publisher | Google Scholor - S. Haykin. (1994). Neural Networks: A Comprehensive Foundation. Prentice Hall PTR,
Publisher | Google Scholor - F. Liebana Cabanillas, V. Marinkovic, I.R de Luna, Z. (2018). Kalinic, Predicting the determinants of mobile payment acceptance: A hybrid SEM neural network approach. Technol. Forecast. Soc. Change 129:117-130.
Publisher | Google Scholor - R. Yadav, S.K. Sharma, A. (2016). Tarhini: A multi-analytical approach to understand and predict the mobile commerce adoption. J. Enterp. Inf. Manag.
Publisher | Google Scholor - B. Sharma, S. Kumar, P. Tiwari, P. Yadav and M. I. (2018). Nezhurina. ANN based short-term traffic flow forecasting in undivided two-lane highway, 5:48.
Publisher | Google Scholor - G. A. Alkawsi, N. Ali, A. S. Mustafa, Y. Baashar, A. Alhussian, A. Alkahtani, S. K. Tiong, J. Ekanayake: A hybrid SEM-neural network method for identifying acceptance factors of the smart meters in Malaysia: Challenges perspective. Alexandria Engineering Journal, 227-240.
Publisher | Google Scholor - T. C. Wong, K. M. Y. Law, H. K. Yau, S. C. (2011). Ngan: Analyzing supply chain operation models with the PC-algorithm and the neural network, Expert System Application.
Publisher | Google Scholor - K.L. Du. (2010). Clustering: A neural network approach, Neural Network.
Publisher | Google Scholor - F. Mustakim, A. A. Aziz., M. Fujita., and M. N. (2021). Ahmad: Motorcycle and Passenger Cars Behavior at Unsignalized Intersection in Malaysia Rural Roadway. Turkish Online Journal of Qualitative Inquire, (TOJQI), 12(7):2249-2264.
Publisher | Google Scholor - Artkins. (2006). Advance Stop Line Variation Research Study, Research Finding October.
Publisher | Google Scholor - Agah Muhammad Mulyadi. (2019). Red Box Motorcycle Evaluation at Signalized Intersection in Denpasar Bali, Journal of the Eastern Asia Society for Transportation Studies. 13:1966-1982.
Publisher | Google Scholor