Research Article
Studying the Infrared spectroscopy of Compounds fluoride that blotched by Sb (x=0.01-0.02-0.03-0.04-0.05)
1Professor, Department of Physics, Faculty of science, Tishreen University, Syria
2Doctor, Department of Physics, Faculty of science, Alfurat University, Syria.
*Corresponding Author: Ahmad Khoudro, Professor, Department of Physics, Faculty of science, Tishreen University, Syria
Citation: Khoudro A, Kadory S. (2024). Studying the Infrared spectroscopy of Compounds fluoride that blotched by Sb (x=0.01-0.02-0.03-0.04-0.05). Scientific Research and Reports, BioRes Scientia Publishers. 1(2):1-11. DOI: 10.59657/2996-8550.brs.24.009
Copyright: © 2024 Ahmad Khoudro, this is an open-access article distributed under the terms of the Creative Commons Attribution License, which permits unrestricted use, distribution, and reproduction in any medium, provided the original author and source are credited.
Received: March 14, 2024 | Accepted: April 03, 2024 | Published: April 10, 2024
Abstract
The study of calcium fluoride is of great scientific importance due to its wide scientific applications. Therefore, our study came to some of the physical properties of the compounds of both pure Calcium fluoride and antimony doped Calcium fluoride. By measuring the infrared spectrum for antimony doped calcium fluoride at 1wt%, it is found that there are six vibratory frequencies, namely: (3445.67–1516.65–1095.95–876.41–643.07–445.62) cm- 1 and six vibratory frequencies for antimony doped calcium fluoride at 5wt%: (3442.13–1516.42–1137.98–876.24–638.10–430.68) cm- 1 The study showed that the absorbance values, the absorption coefficient, the refractive index and the optical length were in the antimony doped sample by 5wt% greater than that of the pure Calcium fluoride compound and are respectively: α=14.577 cm-1 n=1.817.
Keywords: powder; calcium fluoride; solid state reaction; infrared spectrum; rare-earth ions; optical conductivity
Introduction
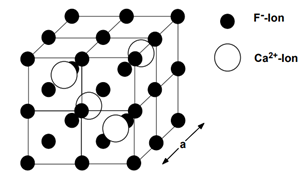
Calciumfluoride (CaF2) density is 3.18 (g/cm3) melting at 1633 (K) and crystalize in cubic structure with lattice constants a = 5.432 Å. CaF2 is presently the fastest known scintillator. It has an emission component with sub nanosecond decay time [4,5]. CaF2has several scintillation emissions bands. The fast scintillation light is emitted in the UV bands centered at 220 and 200 nm. The decay time of the fast component varies between 600 and 800 ps [2]. CaF2 has attracted much attention because of its wide range of potential applications in optoelectronic and microelectronic devices [3,6,7]. CaF2 compounds doped with rare-earth ions have been reported to display unique luminescence properties and can thus be used as scintillators [1,8,9,10].
Figure 1: The crystalline structure of pure Calcium fluoride
Infrared spectroscopy:
Infrared is electromagnetic waves and it has all the basic properties of light, which are represented by the phenomena of diffusion, reflection, refraction, interference, diffraction and polarization. They are invisible thermal waves emitted by the sun or from artificial sources and have a high penetration ability as well as from our bodies and their frequency is lower than the red ray frequency in the visible electromagnetic spectrum. The infrared spectrum is located between the visible spectrum and the microwave radiation spectrum. It is divided into three zones, as follows:
- Near infrared (NIR): It is the closest to the visible rays, namely the red color, and it lies within the range [4000 –12000] Cm-1.
- Middle Infrared MIR: located between the two preceding zones within the range [200 – 4000] Cm-1
Infrared spectroscopy is one of the basic methods of studying materials. It enables us to identify the structure of the material without affecting its properties. It depends on the study of the spectra absorbed by the sample, and its field is limited to [20 –1400] Cm-1.
Red radiation energy is not enough to cause electronic excitation in most materials, but it is sufficient to cause elasticity vibrations and flexion in the bonds. All types of these bonds respond to this amount of energy in which vibrations of this type occur. Therefore, they are absorbed in the zone beneath the red under the condition that absorption leads to a change in the polar moment, and these vibrations are quantized, and their occurrence means that the compound absorbs infrared energy in a specific part of the spectrum [11].
Most spectroscopic analysis occur in the central infrared zone [20 – 1400] Cm-1 where the most molecular vibrations occur to determine the molecular structure of the studied compounds.
Infrared spectroscopy principle
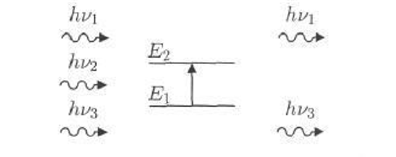
Natural molecules vibrate according to all their vibrating patterns, but with very weak amplitudes. However, the photon has a sinusoidal electric component. If the frequency of the photon corresponds to the frequency of the vibrations of the normal patterns of the molecule, the molecule will enter the resonance and vibrate at very large capacities. in other words, the photon whose energy is Equal to the energy necessary for the molecule to pass from a low energy state to an excited state is absorbed and its energy is transformed into a vibration energy as in Figure 2.
Figure 2: Infrared absorption mechanism
Only the photon whose energy (hv) equals to the transmission energy (E2-E1) is absorbed and thus the emission of the emitted radiation is impaired. As the absorption of some of the incoming photons leads to the appearance of the lines of compatibility of the photons that were not emitted in the curve of the infrared spectrum of the molecule. This absorption distinguishes the bonds between the atoms, since each vibration pattern corresponds to the single movement of the molecule, so there is a direct correspondence between the frequency of the absorbed radiation and the structure of the molecule [10].
Research objective
This work aims to determine the field of absorption frequencies, that is, the vibrations samples frequencies of the infrared spectra of pure calcium fluoride and antimony doped calcium fluoride by 3wt% and then finding the absorbance, absorption coefficient, damping factor, refractive index, optical length and optical conductivity to improve the physical properties of calcium fluoride.
Research materials and methods
- calcium fluoride CaF2 (99% purity, TITAN BIOTECH LTD, origin India).
- antimony Sb (purity 99%, TITAN BIOTECH LTD, origin India).
Devices and tools used:
- Sensitive scale type (SARTORIUS) with an accuracy of (10-4) gr is available in the Faculty of Science - Physics Department.
- Small agate mortar.
- High temperature thermal Oven (1200ºC) with a Temperature Regulator.
Preparing the samples:
The samples are prepared by the solid-state reaction method. Accordingly, the weights of the powders required for each sample are mixed and calculated using the molecular weight method in order to obtain the compounds required for the study where CaF2 1-x Sbx; (x=0.01-0.02-0.03-0.04-0.05). Then grinding these materials in the agate mortar perfectly well to make the mixture homogeneous and sifting it with a sieve of 90 µm. Then it is put it in a container and we add distilled water to increase the mixing process and homogeneity of the powder. Then we put it on a heater for 3 hours at a temperature of 100º C and the mixing and homogeneity process of the powder occurs by stirring.
After that, the powder is placed on a heater with direct contact with the air, then the water evaporates and then we perform a preliminary roasting process inside the oven (pre-sinter) to increase the degree of homogeneity of the mixture. We fix the oven temperature at 700°C for three hours, then we turn off the oven, which means to stop the roasting process and leave the sample inside the oven until it cools and reaches room temperature, thus we get rid of impurities that evaporate at high temperatures.
Then we grind the powder resulting from the roasting process in its first stage. Then we perform the second roasting process where we fix the oven temperature at 100° C for an hour and then we raise the temperature 50°C every 15 min until we reach the temperature of 700°C where we fix the oven temperature at it for 3 hours in order to get the crystal structure in its correct form.
To study the infrared spectra, we use an infrared spectroscopy device, which is a simple device whose main components are an infrared source, a sample holder and a detector. This device is considered one of the best spectroscopic devices used to identify the chemical composition of the compounds. It is available in the Faculty of Science - aleppo University works at the range [400-4000] Cm-1.
The spectrometer is characterized by a computer memory that analyzes the waves gathered on the detector, computerizes them, and draws the spectrum resulting from absorption. Or a vibratory transmission of the atoms occurs relative to each other in the molecule, which leads to a periodic change in the length of chemical bonds or a change in the angles between the chemical bonds in the molecule. Each vibrational motion results from the movement of two atoms, or it may include a group of its constituent atoms. The wavelength or frequency at which this absorption occurs depends on several factors, including the mass of the atom, the strength of the bonds that make up the molecule, and the geometry of the atoms in the molecule.
Results and discussion
1-Infrared spectroscopy
The IR spectrum of pure calcium fluoride and antimony doped calcium fluoride was measured using the spectrometer asco type FT/IR-460 plus available in the central laboratory of the Faculty of Science - aleppo University, working in the range [400-4000] Cm-1. Where the permeability T was measured by the frequency function  , the absorbance A, the absorption coefficient α, the damping factor K, the refractive index n and optical conductivity σopt were calculated:
- Permeability T: It is defined as the ratio between the intensity of the penetrating radiation to the intensity of the fallen radiation, it has been taken from the device itself and then by using the appropriate
mathematical equations, other optical parameters have been calculated.
- Absorbency A: is the ratio between the intensity of the absorbed radiation and the intensity of the fallen radiation, calculated from the equation [15]:
A=log(  ) = log(
 (1)
(1)
T represents Permeability.
- Absorption coefficient α: defined as the ratio between the decrease in the flow of the fallen radiation energy to the unit of distance towards the spread of the fallen light wave within the field, and is calculated from the equation:
α=2.303 (2)
(2)
A represents absorbency, d = 1mm the thickness of the material
- The damping factor k: is defined as the amount of energy absorbed by the electrons of the studied material from the energy of the radiation photons that fall on it, and is calculated from the equation [17]:
k= (3)
(3)
- Refractive index n: which is the ratio between the speed of light in the vacuum to its speed in the field, and it is calculated from the equation [18]:
n = ( )1/2 (4)
- Optical length L: the inversion of the absorption coefficient [16]:
L = (5)
(5)
- Optical conductivity σopt: optical conductivity is related to the refractive index and the damping factor according to the following equation [18]:
σopt=  nkν (6)
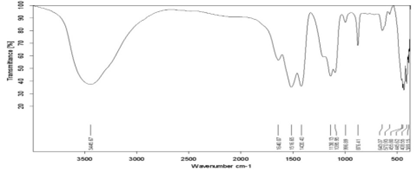
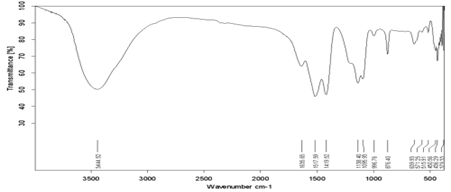
Figure 3: FTIR spectrum of Sb doped CaF2 samples (1wt%).
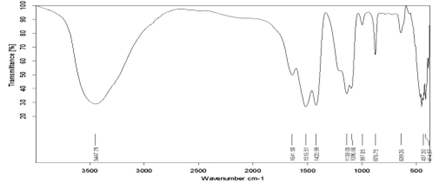
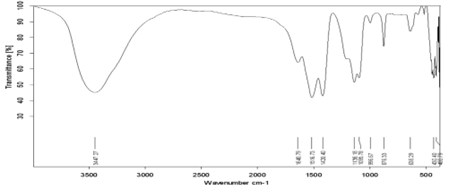
Figure 4: FTIR spectrum of Sb doped CaF2 samples (2wt%).
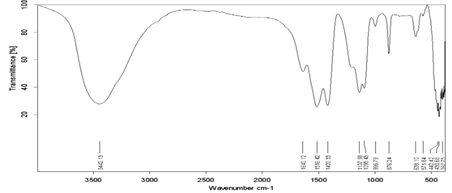
Figure 5: FTIR spectrum of Sb doped CaF2 samples (3wt%).
Figure 6: FTIR spectrum of Sb doped CaF2 samples (4wt%).
Figure 7: FTIR spectrum of Sb doped CaF2 samples (5wt%).
FTIR analysis of samples has been performed at room temperature within the range [400-4000] Cm-1. Some bundles appeared within this range, including the absorption bundle at the top corresponding to the number of vibratory frequency 1516.65 cm-1, 3445.67 cm-1 which belongs to the vibratory pattern of the hydroxyl group (vibration of hydroxyl group). This is due to the absorption of water vibration; the vibratory pattern also shows stretching and retraction (stretching vibrational mode) belonging to the O-H group [12]. The location of the absorbent bundles and peaks also depends on the crystalline structure of the material and its chemical composition, as well as on the morphology of the material [13].
for antimony doped calcium fluoride at 1wt%, is characterized by a set of vibrational frequencies within the range [400-4000] Cm-1 which is (3445.67 – 1516.65 – 1095.95 – 876.41 – 643.07– 445.62) cm- 1 antimony doped calcium fluoride by 5wt% is characterized by a set of vibrational frequencies within the range [400-4000] Cm-1 which is:
(3442.13– 1516.42– 1137.98– 876.24– 638.10– 430.68) cm- 1. An absorbent value has been observed at about the frequency 1095.95 cm-1 belonging to the C-H group, and this could be due to adsorption and interaction between carbon dioxide atoms with water during the sintering process [14]. From the permeability spectrum by the frequency function indicated in Figure (3), the physical quantities of pure calcium fluoride have been calculated, which are the absorbance, the absorption coefficient, the damping coefficient, the refractive index, the wavelength, the optical conductivity, which are shown in Table (1).
Table 1: shows the vibrations frequency of the antimony doped calcium fluoride by (1wt%) with corresponding permeability values for each frequency, absorbance and absorption coefficient, damping factor, refractive index, optical length and optical conductivity.
| ʋ(cm)-1 | T% | A | α(cm)-1 | N | k× 10-4 | L(cm) | σ(opt)(Ωcm)-1 |
| 3445.67 | 38.222 | 0.417 | 9.603 | 1.271 | 2.218 | 0.104 | 0.032 |
| 1516.65 | 36.860 | 0.433 | 9.971 | 1.308 | 5.234 | 0.100 | 0.034 |
| 1095.95 | 43.122 | 0.365 | 8.405 | 1.148 | 6.106 | 0.118 | 0.025 |
| 876.41 | 66.234 | 0.178 | 4.099 | 0.714 | 3.723 | 0.243 | 0.007 |
| 643.07 | 79.152 | 0.101 | 2.326 | 0.513 | 2.880 | 0.429 | 0.096 |
| 445.62 | 32.016 | 0.494 | 11.376 | 1.457 | 20.328 | 0.087 | 0.03 |
Table 2: shows the vibrations frequency of the antimony doped calcium fluoride by (2wt%) with corresponding permeability values for each frequency, absorbance and absorption coefficient, damping factor, refractive index, optical length and optical conductivity.
| ʋ(cm)-1 | T% | A | α(cm)-1 | N | k× 10-4 | L(cm) | σ(opt)(Ωcm)-1 |
| 3447.79 | 39.652 | 0.401 | 9.235 | 1.506 | 2.132 | 0.108 | 0.036 |
| 1516.51 | 28.720 | 0.541 | 12.459 | 1.575 | 6.541 | 0.080 | 0.052 |
| 1096.66 | 36.542 | 0.437 | 10.064 | 1.317 | 7.306 | 0.099 | 0.035 |
| 876.75 | 66.230 | 0.178 | 4.099 | 0.714 | 3.722 | 0.243 | 0.007 |
| 639.26 | 80.024 | 0.096 | 2.210 | 0.499 | 2.752 | 0.452 | 0.002 |
| 437.30 | 29.871 | 0.524 | 12.067 | 1.532 | 21.964 | 0.082 | 0.049 |
Table 3: shows the vibrations frequency of the antimony doped calcium fluoride by (3wt%) with corresponding permeability values for each frequency, absorbance and absorption coefficient, damping factor, refractive index, optical length and optical conductivity.
| ʋ(cm)-1 | T% | A | α(cm)-1 | N | k× 10-4 | L(cm) | σ(opt)(Ωcm)-1 |
| 3444.52 | 50.006 | 0.283 | 6.517 | 0.999 | 1.506 | 0.153 | 0.017 |
| 1517.59 | 46.022 | 0.337 | 7.761 | 1.082 | 4.071 | 0.128 | 0.022 |
| 1138.40 | 50.082 | 0.300 | 6.909 | 0.998 | 4.832 | 0.144 | 0.018 |
| 876.40 | 69.825 | 0.155 | 3.569 | 0.657 | 3.242 | 0.280 | 0.006 |
| 639.93 | 78.265 | 0.106 | 2.441 | 0.526 | 3.037 | 0.409 | 0.003 |
| 436.29 | 67.128 | 0.173 | 3.984 | 0.699 | 7.271 | 0.251 | 0.007 |
Table 4: shows the vibrations frequency of the antimony doped calcium fluoride by (4wt%) with corresponding permeability values for each frequency, absorbance and absorption coefficient, damping factor, refractive index, optical length and optical conductivity.
| ʋ(cm)-1 | T% | A | α(cm)-1 | N | k× 10-4 | L(cm) | σ(opt)(Ωcm)-1 |
| 3447.27 | 44.235 | 0.354 | 8.152 | 1.122 | 1.882 | 0.122 | 0.024 |
| 1516.73 | 41.182 | 0.385 | 8.866 | 1.195 | 4.654 | 0.112 | 0.028 |
| 1138.18 | 51.862 | 0.285 | 6.563 | 0.963 | 4.591 | 0.152 | 0.016 |
| 876.33 | 70.622 | 0.151 | 3.477 | 0.644 | 3.159 | 0.287 | 0.005 |
| 638.29 | 82.245 | 0.084 | 1.934 | 0.464 | 2.412 | 0.517 | 0.002 |
| 430.40 | 52.025 | 0.283 | 6.517 | 0.960 | 12.057 | 0.153 | 0.016 |
Table 5: shows the vibrations frequency of the antimony doped calcium fluoride by (5wt%) with corresponding permeability values for each frequency, absorbance and absorption coefficient, damping factor, refractive index, optical length and optical conductivity.
| ʋ(cm)-1 | T% | A | α(cm)-1 | N | k× 10-4 | L(cm) | σ(opt)(Ωcm)-1 |
| 3442.13 | 27.735 | 0.556 | 12.804 | 1.614 | 2.503 | 0.078 | 0.046 |
| 1516.42 | 23.822 | 0.623 | 14.347 | 1.788 | 7.532 | 0.069 | 0.068 |
| 1137.98 | 36.982 | 0.432 | 9.948 | 1.305 | 6.960 | 0.100 | 0.034 |
| 876.24 | 65.432 | 0.184 | 4.237 | 0.726 | 3.850 | 0.236 | 0.008 |
| 638.10 | 79.925 | 0.097 | 2.233 | 0.501 | 2.786 | 0.447 | 0.002 |
| 430.68 | 23.242 | 0.633 | 14.577 | 1.817 | 26.949 | 0.068 | 0.070 |
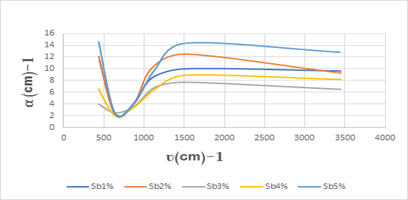
The absorption coefficients variations are drawn by the function of the vibrational frequency of the antimony doped calcium fluoride as shown in Figure (8).
Figure 8: shows the absorption coefficient variations by the function of the vibrational frequency of the antimony doped calcium fluoride by (1-2-3-4-5 wt%).
Figure (8) shows the change in the absorption coefficient of antimony doped calcium fluoride, we note that the largest absorption coefficient value was ( ) corresponding to the frequency (430.68
 ) cm-1 and the smallest absorption coefficient value was
  ) corresponding to the frequency (638.29
 ).
).
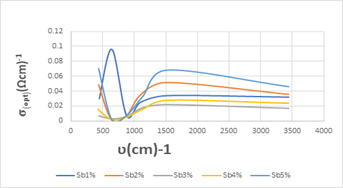
The optical conductivity variations are also drawn by the frequency function of the antimony doped calcium fluoride, as shown in Figure (9).
Figure 9: Studying of the conductivity variations by the frequency function of the antimony doped calcium fluoride by (1-2-3-4-5 wt%).
Figure (9) shows the change in the optical conductivity variations of antimony doped calcium fluoride, we note that the largest optical conductivity value was (0.070(Ωcm)-1) corresponding to the frequency (430.68 ) cm-1 and the smallest optical conductivity value was (0.002(Ωcm)-1) corresponding to the frequency (639.26
 ).
).
Conclusions
- The antimony doped calcium fluoride by 1wt%FTIR spectrum has shown some vibrational frequencies within the range [400-4000] Cm-1 which are:
- (3445.67 – 1516.65 – 1095.95 – 876.41 – 643.07– 445.62) cm- 1 The FTIR spectrum of the antimony doped calcium fluoride by 5wt%showed vibrational frequencies within the range [400-4000] Cm-1, the most notably are:
- (3442.13– 1516.42– 1137.98– 876.24– 638.10– 430.68) cm- 1
- The absorbance value for the pure sample varies within the range [0.106 – 0.337], and for the doped sample, the absorbance value varies within the range [0.097 - 0.633].
- The value of the optical length L concerning for the doped sample the value of the optical length varies within the range [0.068 -0.447] cm.
- The optical conductivity value σopt for the doped sample the value of the optical conductivity varies in the range [0.002 – 0.070] (Ωcm)-1.
- The largest values of absorbance, absorption coefficient, refractive index and optical length were greater in the antimony -doped sample by 5wt% for the vibrational frequency 430.68

- The largest values of the absorbance, the refractive index, and the absorption coefficient were for the frequency 430.68
 .
.
References
- Czaja, M., & Gajowska, S. B. (2012). The luminescence properties of rare-earth ions in natural fluorite. Phys Chem Minerals, 39:639-648.
Publisher | Google Scholor - Battikh, A. A., et al. (2014). Studying of the Europium ion effect on the luminescence of calcium fluoride crystal. Tishreen University Journal, 36.
Publisher | Google Scholor - Nanto, H., & Nakagawa, R. (2015). Optically stimulated luminescence in Tm-doped calcium fluoride phosphor crystal for application to a novel passive-type dosimeter. Sensors and Materials, 27:277-282.
Publisher | Google Scholor - Calcium fluoride and barium fluoride crystals in optics. (2014).
Publisher | Google Scholor - Elbatal, F. H. A., Marzouk, M. A., et al. (2014). Optical and FT infrared absorption spectra of 3d transition metal ions doped in NaF-CaF2-B2O3 glass and effects of gamma irradiation.
Publisher | Google Scholor - Zheng, W., & Zhou, S. (2013). Sub-10 nm lanthanide doped CaF2 nanoprobes for time-resolved luminescent biodetection.
Publisher | Google Scholor - Ravangave, L. S. (2010). Effect of doping concentration of Eu3+ ion on CaF2 nanoparticles. Digest Journal of Nanomaterials and Biostructures, 7(2):575-578.
Publisher | Google Scholor - Kishi, Y., Tanabe, S., et al. (2005). Fabrication and efficient infrared to visible upconversion in transparent glass ceramics of Er-Yb-Co doped CaF2 nanocrystals. Journal of the American Ceramic Society, 88(9):2444-2448.
Publisher | Google Scholor - Wang, F., Fan, X., et al. (2005). Synthesis and luminescence behavior of Eu3+ doped CaF2 nanoparticles. Solid State Communications, 133:775-779.
Publisher | Google Scholor - Hraiech, S., & Jouini, A. (2007). Breakage of Yb3+ pairs by Na+ in Yb3+ doped CaF2 laser host. Annales de Physique, 32 :59-61.
Publisher | Google Scholor - Rouessac, F., & Rouessac, A. (2004). Analyse chimique: méthodes et techniques instrumentales modernes. Dunod.
Publisher | Google Scholor - Faisal, M., et al. (2015). SnO2 doped ZnO nanostructures for highly efficient photocatalysis. Journal of Molecular Catalysis A: Chemical, 39:9-25.
Publisher | Google Scholor - Saleh, S. A., et al. (2016). Structural and optical properties of nanostructured Fe-doped SnO2. Acta Physica Polonica A, 129(6):1220-1225.
Publisher | Google Scholor - Gnanam, S., & Rajendran, V. (2010). Preparation of Cd-doped SnO2 nanoparticles by sol–gel route and their optical properties. Journal of Sol-Gel Science and Technology, 56:128-133.
Publisher | Google Scholor - Sakni, L. (2017). Studying the structural properties of Fe-doped tin oxide (Master's thesis). Alwadi University.
Publisher | Google Scholor - Aljawad, S., et al. (2016). Studying the effect of doping on the structural and optical properties of tin oxide thin films. Journal of Engineering and Technology, 34.
Publisher | Google Scholor - Mansour, M. (2012). Studying the structural and optical properties of ZnO thin films by APCVD method. Journal of Materials Science and Engineering, 5.
Publisher | Google Scholor - Zaid, A. (2012). Studying the structural and optical properties of NiO thin films (Master's thesis). Diyala University, Iraq.
Publisher | Google Scholor - Faisal, M., et al. (2015). SnO2 doped ZnO nanostructures for highly efficient photocatalysis. Journal of Molecular Catalysis A: Chemical, 39:19-25.
Publisher | Google Scholor

