
Research article
Study of the Biodiversity of Fish in The Kufa River
Department of Ecology and Pollution, Faculty of Science, University of Kufa, Kufa, Iraq.
*Corresponding Author: Nahdema Abed Abass Jasim, Department of Ecology and Pollution, Faculty of Science, University of Kufa, Kufa, Iraq.
Citation: N.A.A. Jasim, A.D.S. Wadi (2023). Study of the Biodiversity of Fish in The Kufa River, Pollution and Community Health Effects, BioRes Scientia Publishers. 1(2):1-17. DOI: 10.59657/2993-5776.brs.23.009
Copyright: © 2023 Nahdema Abed Abass Jasim, this is an open-access article distributed under the terms of the Creative Commons Attribution License, which permits unrestricted use, distribution, and reproduction in any medium, provided the original author and source are credited.
Received: October 13, 2023 | Accepted: October 19, 2023 | Published: November 06, 2023
Abstract
This study was conducted to identify the types of fish and their spread in the Kufa River, and the effect of some environmental factors on their presence. The study samples were collected monthly and for a period of five months, from October 2021 to February 2022 at five stations, the physical and chemical environmental factors were measured such as temperature, pH, dissolved oxygen, the vital requirement for oxygen, nitrates, phosphates, conductivity, turbidity, salinity and conductivity as well as studying biodiversity indicators such as the relative abundance index and the Shannon-Wiener index. The water temperature ranged between (23.1 and 15) °C, the pH value ranged between (6.5 and 9), the dissolved oxygen was (4.2 and 7) mg/l, the biological requirement for oxygen was between (1.2 and 4.6) mg/l, while the salinity was Between (0.03 and 1.13) parts per thousand, as well as the electrical conductivity between (1271 and 1733) micro Siemens / cm, and the cloudiness was between (0.99 and 7) NTU, while the nitrates ranged between (0.004 and 0.12) mg / liter, while the phosphate was between (0.021 and 0.139) mg / liter. Through the current study, 14 species of fish were diagnosed. Cyprinus Carpio, Spondylium cantharus, Aspirus vorax, Carassius carassius, Barbus kersin, Bagridae, Anguilliformes, Liza abu, Barbus luteus, Silurus trios’ tegus, Mesopotamichthys sharpeyi, Barbus xanthopterin, alburnus mossulensis and Ctenopharyngodon idella. The most common species were two Spondyliosoma cantharus and Silurus triostegus the least common species Ctenopharyngodon idella, Mesopotamichthys sharpeyi, Barbus xanthopterin, Bagridae and Anguilliformes.
Keywords: cyprinus carpio; spondyliosoma cantharus; aspius vorax; carassius carassius; barbus kersin
Introduction
Fish live in multiple environments, shallow hot springs, cold polar seas, and cold deep waters, it is differed in their types, shapes, and sizes, but they all share some characteristics that help them grow in their aquatic environment (Aguinaldo, 2018). All fish are cold-blooded that are able to maintain a body temperature higher than other species (Goldman, 1977), also many types of fish that are highly sensitive to change in temperature, so it exists at a certain temperature (Garey, 1973), other types are able to survive within a wider temperature range, so that the body temperature changes according to the temperature of environment, (Aguinaldo, 2018). There are many types of bony fish, more than 29,000 types of bony fish found in fresh and marine waters (Kenndy, 2019). The Aim of this study include evolution of the quantitative and qualitative composition of fish found in the Kufa river in Al-Najaf province, and the effect of some physical and chemical environmental factors on the presence and density of fish. Also applying the biodiversity rules, like relative abundance index (Ra), Shannon-Weiner diversity index H, to identify the biological diversity in Kufa river.
Fish Biodiversity
The increase in biodiversity in any environment is attributed to the health of this environment (Deely and Paling, 1999). The study of the biological and environmental aspects is an important strategy to know the composition of the fish community (Al-Rudaini, 2010). It has an important role in understanding the fish communities in the water surface for the sake of their development and addressing the causes that lead to deterioration or lack of productivity (Hussain, 2008), as the dynamics Fish assemblages are regulated by abiotic and biotic factors, such as the interaction between species, which includes competition and predation (Siqueria-Souza, Freitas 2004). Fish surveys are distinguished in the study of fish communities and their importance in giving a clear picture of the nature and composition of fish stocks (Kors’re, 2001).
The importance of fishes
Fish is a staple meal for most people, and a rich source of high-quality protein, as it provides 16% of the animal protein consumed around the world (Allan and Tidwell, 2001), and marine products contain high amounts of fat, and very micronutrients , Humans benefit in many ways from the presence of fish in the ecosystem , as fish have several important roles, including fish contribute significantly to the provision of essential nutrients that support the ecosystem, (Tailamy and samples, 2018), fish is generally low in sugar content and can be eaten by diabetics (Subedi, 2019). Fish proteins are essential in the diet of some densely populated countries where total protein intake is low, and are particularly important in the diets of SIDS (Peterson, 2009).
Environmental factors effect on fish presence
Temperature
The temperature is the main factor in controlling the distribution of living organisms also affects the population density of the community in the environment (Al-Rawi et al, 2002). the temperature directly affects the abundance and distribution of fish, which is clearer that is a negative correlation between the water temperature and the total density of zooplankton (Al-Khalidi 2004).
pH
The pH waters are of great importance to aquatic life through its impact on the natural physiological functions of aquatic organisms (Deebghazy, 2011). Weiner (2000) indicated, that the value of the pH of water affects the organisms, as crustaceans in acidic water suffer from a decline in growth and deformation in Exceeding the exoskeleton, pH hydrogen amount range from 4.5 - 10 impedes the growth of fish
Dissolved oxygen (DO)
Dissolved oxygen is one of the most important chemical variables in the aquatic ecosystem, The temperature, dissolved oxygen, and nutrient ratios in the water are among the most important factors that affect the lives of fish. The level of dissolved oxygen (DO) in the water is one of the important factors in the quality of the water in which fish are raised (Maria and Helen, 2000).
Electrical conductivity and Salinity
Electrical conductivity is a good indicator of productivity and refers to dissolved salts such as sodium chlorides (APHA, 1999), as ions differ in their ability to conduct electrically, but in general, conductivity in natural water is directly proportional to the concentration of ions (Boyd and Tucker, 1988). The salinity value can be extracted from the electrical conductivity value (Angeler et al, 2010). Salinity has a major and direct role in determining the diversity and abundance of organisms in the aquatic environment (Wetzel, 2001).
Nitrates
Nitrogen compounds are one of the basic cellular components in living organisms (Wetzel and likens, 2000). Nitrate is the common form of inorganic nitrogen in the aquatic environment (Smith, 2004). And the presence of nitrates with phosphates in the water leads to rapid growth of algae, but in some aquatic ecosystems, nitrogen is the first determinant of algae growth (Smith, et al, 1999).
Phosphates
It is one of the important elements in order to maintain the health of humans, animals, and plants (Motomizu, 2005). the increase in phosphorus in environmental media can contribute to overgrowth of some aquatic plants (Valderrama, 1981). Which in turn contributes to a decrease in the percentage of dissolved oxygen in the water and the lack of radiation, which negatively affects the organism (Dayton and Holloman and others, 2017), which affects the increase in the sun reaching the depths on fish and other aquatic organisms in the negative concentration of phosphorus in the human body Especially bone blindness, and this increase is one of the causes that can lead to cancer. Phosphorus is found mainly in the environmental media in the form of PO4 phosphate. The method for the determination of phosphorus in aqueous samples in drinking water and industrial wastewater depends on the formation of a complex of molybdate with phosphate or a combined complex of molybdate and phosphate, which is returned using ascorbic acid or any other an amino acid (Lenoble and Dilchat and others, 2013).
Material s and Methods
The study area description
The Euphrates is one of the important rivers in Iraqi, there are several dams on this river, including the Al-Hindiya dam, which the river divided into two branches, the Al-Hindiya River, and the Hilla River, after which the river extends until it reaches the city of Al-Kifl, and in the city of Al-Kifl, the Euphrates River is divided into two branches, the Abbasiya River and the Kufa River, which extends from the city of Al-Kifl to the city of Diwaniyah. The total length of the Kufa River is about 36 kilometers, and the flow is about 375 cubic meters / second. The depth of the water in the river fluctuates greatly and reaches its highest level during the flood seasons at the end of March beginning of April and reaches the lowest water level in the summer months (Al-Haidarey, 2010). Five stations were selected using the Geographical Positioning System (GPS) (Figure1).
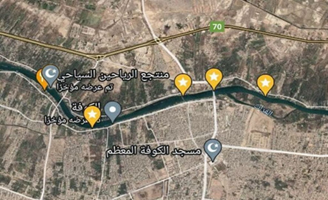
Figure 1: Study stations in the Kufa River
Collection of Fish Samples
The samples were collected from October 2021, until March 2022. At eight in the morning until twelve in the afternoon, it is collected by a fishing net 30 meters long and 2 meters wide from the aforementioned areas, then the required measurements related to weight, length and morphological characteristics were taken.
Water samples collection
Which were collected in 5liter polyethylene containers after washing with distilled water and homogenizing them with sample water several times before filling them for measuring the total hardness. Winkler bottles of 250 ml were used to collect water samples for measuring dissolved oxygen and the biological requirement for oxygen, 2 ml of manganese sulfate solution and 2 ml of basic azide iodide were added to stabilize the dissolved oxygen. Several environmental factors were studied at the study stations and during the study period in the field and laboratory.
Field Measurements
Including water temperature, pH, and electrical conductivity (MS/CM), using a portable digital multi-meter after calibration with standard solutions, and the depth of the water was measured using a plastic ruler divided from 0-400 cm at a depth of 100 cm.
Laboratory measurements
Including Salinity and conductivity which estimated according to the following equation Mackereth et al, (1978) (Salinity = Electrical Conductivity (µS/cm) x 640 x 10-6). and Dissolved Oxygen (DO)was estimated by following the Azid Modification Winkler method described by APHA, (2003). Also, Biological Oxygen Demond (BOD5) was measured It calculates the BOD5 value for the samples River water by equation: (DO2–DO1 = BOD5)
DO1 = dissolved oxygen concentration before incubation (mg/L).
DO2 = dissolved oxygen concentration after incubation (mg/L).
In the other hand the Reactive Nitrate was measured using the indole method (Al-Hijami, 2007), the absorbance was measured at a wavelength of 395 nm using an ultraviolet and visible meter. While the Reactive Phosphate (PO4) was measured at a wavelength of 690 and the absorption of phosphates is measured at a wavelength of 690 nm using a UV-visible spectrophotometer. Results are expressed in µg/L.
Diagnosis of fish
Many types of fish were diagnosed based on the scientific references, and the diagnosis was documented through photographs of each sample. Also, the biological indicators were studied of fish samples including two vital indicators First: Relative abundance index (Ra)this indicator was calculated based on the following equation (Ra=Ns×N×100) (Omori and Ikeda, 1984). Second: Shannon-winner index (H) was calculated from the following Shannon and Weiner equation (H=-∑ni/NLn. ni/N), according to Folder and Sommer, (1999) (Proto Neto, 2003).
Results
Fish density
The highest density of fish was recorded in the fourth station, followed by the first, second and third stations respectively and the lowest density in the fifth station (Figure 2). Also 14 species of fish were diagnosed, including Spondyliosoma cantharus, Aspirus vorax, Carassius carassius, Barbus kersin, Liza Abu, Barbus luteus, Silurus trio’s tegu, Anguilliformes, Bagridae, Mesopotamichthys sharpeyi, Barbus xanthopterin, lburnus mossulensis, Ctenopharyngodon idella and cyprinus Carpio. (Table 1). In first station fish recorded the highest density in November and the lowest density in February. Also Silurus trios tegu was recorded the highest density of all species in October which was 176 followed Spondyliosoma cantharus 140 in January ,in the other hand Spondyliosoma cantharus reaveld third rank of denisty in October and February which was 124 also Silurus trios tegu revealed 123 in December , the lowest density was recorded in October , November ,December, January and February which were zero (0) in Anguilliformes , Bagridae, Mesopotamichthys sharpeyi and Ctenopharyngodon idella respectively. (Table. 1) (Figure. 2).
Table 1: Monthly changes in the density of fish in the first station
| October | November | December | January | February | Species |
| 50 | 47 | 51 | 72 | 79 | cyprinus Carpio |
| 124 | 102 | 121 | 140 | 124 | Spondyliosoma cantharus |
| 73 | 77 | 88 | 79 | 84 | Aspirus vorax |
| 53 | 42 | 53 | 41 | 58 | Carassius carassius |
| 63 | 60 | 57 | 76 | 64 | Barbus kersin |
| 61 | 72 | 80 | 69 | 89 | Liza abu |
| 87 | 64 | 73 | 81 | 72 | Barbus luteus |
| 176 | 117 | 123 | 114 | 85 | Silurus trio’s tegu |
| 0 | 3 | 1 | 4 | 3 | Anguilliformes |
| 0 | 1 | 2 | 0 | 1 | Bagridae |
| 2 | 0 | 0 | 1 | 0 | Mesopotamichthys sharpeyi |
| 3 | 2 | 1 | 2 | 5 | Barbus xanthopterin |
| 20 | 36 | 40 | 33 | 40 | alburnus mossulensis |
| 1 | 0 | 0 | 0 | 1 | Ctenopharyngodon idella |
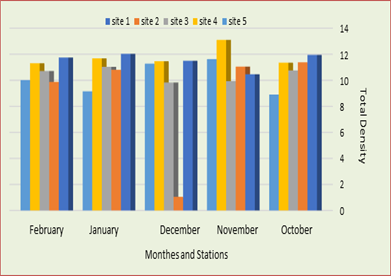
Figure 2: The total density of fish for all study stations during the study months.
In the second location, the highest density was recorded for Spondyliosoma cantharus, Anguilliformes, Silurus trios tegu, and other species appeared in all months except Mesopotamichthys sharpeyi, which disappeared in January and November, and Bagridae, disappeared in November and December, and Anguilliformes, disappeared in November and January, also Barbus xanthopterin and Ctenopharyngodon idella both disappeared in February (Table 2).
Table 2: Monthly changes in the density of fish in the seconed station
| October | November | December | January | February | Species |
| 62 | 59 | 74 | 63 | 52 | cyprinus Carpio |
| 151 | 162 | 101 | 121 | 116 | Spondyliosoma cantharus |
| 75 | 68 | 76 | 65 | 57 | Aspius vorax |
| 63 | 67 | 72 | 69 | 75 | Carassius carassius |
| 59 | 41 | 44 | 59 | 59 | Barbus kersin |
| 57 | 63 | 51 | 68 | 54 | Liza abu |
| 69 | 85 | 81 | 75 | 81 | Barbus luteus |
| 113 | 128 | 102 | 98 | 77 | Silurus trio’s tegu |
| 4 | 1 | 0 | 4 | 2 | Anguilliformes |
| 0 | 0 | 1 | 3 | 5 | Bagridae |
| 3 | 0 | 0 | 0 | 1 | Mesopotamichthys sharpeyi |
| 1 | 3 | 4 | 4 | 0 | Barbus xamthopterus |
| 24 | 19 | 24 | 17 | 14 | alburnus mossulensis |
| 2 | 3 | 4 | 2 | 0 | Ctenopharyngodon idella |
Third location appeared the highest density which were recorded in species Spondyliosoma cantharus, Anguilliformes, Silurus trios tegu, other species, were appeared in all months, except Mesopotamichthys sharpeyi and Anguilliformes which both disappeared in January and November, and Bagridae, disappeared in November and December, also Barbus xamthopterus and Ctenopharyngodon idella are disappeared in October and December (Table 3).
Table 3: Monthly changes in the density of fish in the third station
| October | November | December | January | February | Species |
| 48 | 40 | 37 | 45 | 55 | cyprinus Carpio |
| 112 | 99 | 89 | 99 | 87 | Spondyliosoma cantharus |
| 69 | 53 | 56 | 70 | 51 | Aspius vorax |
| 59 | 45 | 67 | 73 | 61 | Carassius carassius |
| 76 | 87 | 68 | 64 | 64 | Barbus kersin |
| 68 | 74 | 82 | 89 | 77 | Liza abu |
| 88 | 93 | 88 | 93 | 85 | Barbus luteus |
| 104 | 69 | 75 | 99 | 116 | Silurus triostegu |
| 1 | 0 | 1 | 0 | 1 | Anguilliformes |
| 2 | 1 | 3 | 3 | 4 | Bagridae |
| 1 | 4 | 5 | 2 | 3 | Mesopotamichthys sharpeyi |
| 0 | 1 | 0 | 1 | 2 | Barbus xamthopterus |
| 18 | 11 | 19 | 22 | 34 | alburnus mossulensis |
| 0 | 1 | 0 | 2 | 2 | Ctenopharyngodon idella |
In the other hand fourth location revealed the highest density for Spondyliosoma cantharus, Anguilliformes, Silurus triostegu, and the rest of the species, all of which appeared in all months, except for Anguilliformes, which appeared in some months and disappeared in December, January, and November, and Barbus xamthopterus appeared in some months and disappeared in October. the second and February, as shown in Table (4).
Table 4: Monthly changes in the density of fish in the fourth station
| October | November | December | January | February | Species |
| 55 | 61 | 59 | 62 | 49 | cyprinus Carpio |
| 163 | 176 | 98 | 89 | 109 | Spondyliosoma cantharus |
| 62 | 74 | 65 | 79 | 68 | Aspius vorax |
| 44 | 63 | 65 | 49 | 52 | Carassius carassius |
| 55 | 47 | 52 | 48 | 48 | Barbus kersin |
| 70 | 81 | 77 | 83 | 89 | Liza abu |
| 107 | 99 | 101 | 121 | 97 | Barbus luteus |
| 94 | 133 | 111 | 130 | 136 | Silurus triostegu |
| 2 | 0 | 0 | 0 | 2 | Anguilliformes |
| 1 | 3 | 2 | 2 | 2 | Bagridae |
| 2 | 4 | 3 | 2 | 3 | Mesopotamichthys sharpeyi |
| 3 | 0 | 3 | 3 | 0 | Barbus xamthopterus |
| 21 | 44 | 50 | 31 | 22 | alburnus mossulensis |
| 2 | 1 | 2 | 2 | 2 | Ctenopharyngodon idella |
In the fifth location, the highest density was recorded for Spondyliosoma cantharus, Anguilliformes, Silurus triostegu, and all of which appeared in all months, except for Mesopotamichthys sharpeyi, which disappeared in November and October, and Bagridae, which disappeared in February, and Anguilliformes, which disappeared in a month. February and the Barbus xamthopterus disappeared in February, (Table 5).
Table 5: Monthly changes in the density of fish in the fifth station
| October | November | December | January | February | Species |
| 37 | 63 | 65 | 42 | 75 | cyprinus Carpio |
| 107 | 131 | 107 | 102 | 93 | Spondyliosoma cantharus |
| 39 | 67 | 71 | 55 | 66 | Aspius vorax |
| 49 | 50 | 48 | 68 | 70 | Carassius carassius |
| 35 | 55 | 70 | 51 | 51 | Barbus kersin |
| 48 | 62 | 61 | 47 | 50 | Liza abu |
| 82 | 102 | 95 | 72 | 79 | Barbus luteus |
| 115 | 126 | 121 | 89 | 96 | Silurus trios tegus |
| 2 | 4 | 2 | 1 | 0 | Anguilliformes |
| 1 | 2 | 3 | 1 | 0 | Bagridae |
| 0 | 0 | 1 | 4 | 1 | Mesopotamichthys sharpeyi |
| 1 | 1 | 2 | 1 | 0 | Barbus xamthopterus |
| 17 | 34 | 30 | 14 | 19 | alburnus mossulensis |
| 1 | 1 | 1 | 2 | 1 | Ctenopharyngodon idella |
Fish identification
Fourteen species of fish were diagnosed in Kufa river from October 2021 to February 2022 in five locations, which were Cyprinus carpio its feeding on grass mainly, its movement in groups. The weight ranges from 1 kg to 5 kg. Spondyliosoma cantharus its length may reach a meter for an adult fish, but we diagnosed with a length of 20- 25 cm and a weight of about 7-10 fish per kg. Aspius vorax it is distinguished by long head and tapering forward, and the mouth is elongated and reaches the front half of the eye. its length reaches 65 cm, and its weight passed 5 kg. Carassius carassius its cylindrical shape and small head. The weight was 1.5 - 3 Its length 30 - 75 cm. Barbus kersin: it is distinguished by the mouth is directed downwards, the tentacles are large, the head is cylindrical and arched, the fins are yellowish, and it lives near the rocks. Liza Abu It is a small fish, its length is about 10 cm, and one kilogram of it is about 9-12 fish. it contains two radial fins that cause luster in its body at night. Barbus luteus it is the height of the body, usually about a third of the length. The eyes are small, and the snout is prominent for a small mouth in a medium-sized head. The dorsal fin has three primary rays and 11 secondary rays, and the body color is reddish-brown with dark glasses on the back, while the abdomen is silver in color, its length does not exceed 50 cm. Silurus triostegus its large size fish and without scales that do not excrete waste and toxins outside the body. Anguilliformes it is distinguished by shape close to snakes, hiding among rocks and grass. It feeds on garbage and any living creature that can enter its mouth. Bagridae A small type of fish that is not eaten and has a thorn in its fins and small in size. It is believed that it is one of the fish that lives on eating insect larvae in rivers, and it is one of the incoming fish. Mesopotamichthys sharpeyi It is length of about 60 cm and reproduces during the spring. It is characterized by the presence of small squibs on the mouth. It is very strong and fast fish. Its color is silver. Barbus xamthopterus the mouth in this species is facing forward, and the fins are dark. It is a medium-sized fish, up to 80 cm long. Alburnus mossulensis It is a type of fish characterized by the luster of its distinct body and its length is about 30 cm. the weight it is about 12-15 fish per kg, and it is characterized by very clear and large eyes. Ctenopharyngodon idella: It is a species that has the ability to eat grass and cleanse riverbeds and canals of weeds It is grows in large size and quickly, its color is golden-green or brown, its scales are strong, and it is large in size, cylindrical in shape and long.
The total number of fish caught was (16,414) fish during the study period. The highest value of the relative abundance index was recorded in the first location in December. The second rate increased by 21.99% due to the availability of a good environment in that station for the growth of fish, where the physical and chemical environmental factors and the value of nutrients were also present. Also, in the fifth location, it recorded the lowest abundance in the month of October, reaching 16.36%. This means that the composition of the fish population is in a state of great changes in light of the changes in the current aquatic environment as a result of changes in some environmental factors such as high and low temperature, salinity and other factors. This is what (Horn & Allen, 1985) found.
The results of the Shannon Wiener fish index showed that its value ranged between the highest value (0.14) in the first site for each of October, January and February, where the first site is characterized by being an area that contains many plants and good nutrients for fish breeding, as well as positive values for the physical and chemical factors favorable for breeding. And the diversity of fish in it. The lowest value was in the third location (0.02) in October. The third location is distinguished and is located near the drain of Maysan after the confluence of the side branch of the Kufa River. It is one of the largest buffalo breeding areas in the city of Kufa, where some environmental factors were not suitable for the reproduction and diversity of fish. Diversity index values approached a relatively wide range, which reflects the use and exploitation of the area by fish. Quarterly basis and this are the same as indicated by (Allen, 1985).
Environmental Measurements
Water temperature
In the current study, it was recorded that the water temperature in the first station ranged between 17 °C in February and 21.4 °C in October, while in the second station the temperature was 15 °C in January and October, while the temperature was recorded in the third station between 15.5°C in January and 23.1°C in October, also a temperature was recorded in the fourth station between 15°C in January and 22.2°C in November, finally in the fifth location The temperature ranged between 15°C in January and 21°C in November, (Figure 2). The results of the current study showed that the water temperature changes according to the months, and few relative changes in temperature are observed. This is due to the high heat capacity of water compared to other liquids, which is defined as the amount of heat required to raise the temperature of one gram of water by one degree Celsius. The large increase in temperature results in a relatively small rise in the water temperature (Al-Saadi, 2006). The difference in temperature between the study stations may be due to the time of sampling, as temperatures are low at the beginning of the morning and then rise when the time approaches midday. The temperature variation that occurred in the study areas is considered a natural variation as a result of the change in the weather throughout the year, and this is fully consistent with Al-Zurfi, (2010).
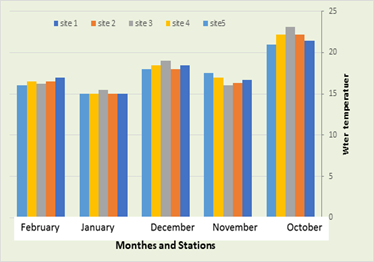
Figure 3
pH (Potential of Hydrogen Ion)
In the current study, it was recorded that pH in first station ranged between 6.3 in January and 8.17 in February. In second station, ranged between 8.1 in October and 8.6 in January, while the pH was recorded in the third station between 6.9 in December and 8.6 in February, in the fourth station recorded an average between 6.5 in January and 8.7 in February, and finally in the fifth location the pH ranged between 6.7 in December and 9 in February, (Figure3). The pH is one of the most important environmental characteristics that have an impact on the metabolism, physiology, and growth of organisms that live in different aquatic environments (Lawson, 2011). Hydrogenation with photosynthesis et al, 2009 (Cupsas). The pH values are a reflection of several life and chemical processes and are of great importance, as several life activities occur only within a narrow range of pH, so any variation outside the acceptable range is fatal for some organisms (Iqbal et al., 2004), in the current study the values were The recorded pH ranged between (9-6.3) as natural waters tend in general to be alkaline, and this is consistent with the study (Al-Haidarey, 2012), as it was noted that the waters of Shatt al-Kufa tend to be alkaline. The highest value of pH was in the second station, due to the excretion of waste in the area, and this is consistent with Al-Zubaidi (2012). Studies have indicated that Iraqi water is alkaline water, including Al-Kinzawi, (2007) and Al-Haidarey, (2009).
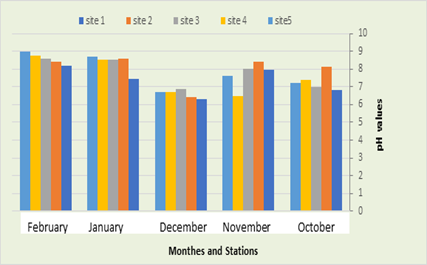
Figure 4
Dissolved Oxygen (DO).
It was recorded that the amount of DO in the first station ranged between 4.6 mg/L in November and 6.6 mg/L in October, in the second station its ranged between 4.2 mg/L in December and 6.6 mg/L In October, while in the third station were 3.5 mg/L in December and 7.4 mg/L in October, while in the fourth station a rate ranging between 4.2 in December and 7.3 in October was recorded. Whereas, in the fifth location, the dissolved oxygen ranged between 4.9 mg/L in February and 7.4 in October, (Figure 4). The values of dissolved oxygen in the current study where the highest value was 6.4 mg / L in December 2021 and the lowest value was 2.5 mg / L in November 2021. It is noted that the values of DO changed monthly as they began to rise in the winter season. This is consistent with Al-Shibli (2014), and the reason for this is due to the decrease in the solubility of gases at higher temperatures, as well as the increase in the activity of microorganisms in the processes of decomposing organic matter, which leads to an increase in oxygen consumption (Al-Zurfi, 2010). And Mahmoud (2008) indicated that the high value of DO is due to good ventilation and continuous mixing, as well as the great role of aquatic plants and phytoplankton.
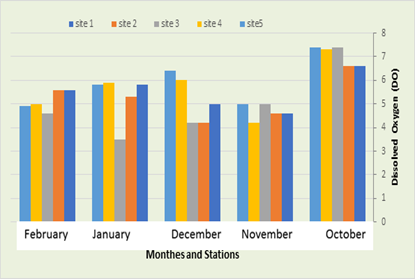
Figure 5
Biological Oxygen Demand (BOD5)
In the current study, it was recorded that BOD in the first station were 1.2 mg/L in October and 5 mg/L in February and January, while in the second station the amount of BOD were 0.8 mg/L in December and 5 mg/L In February, while the BOD recorded in the third station were between 1.9 mg/L in October and 3.8 mg/L in February, while it was recorded in the fourth station an average between 1.7 mg/L in October and 4.6 mg/L in February, while in the fifth location, BOD ranged between 1.6 mg/L in October and 4 mg/L in February, as shown in Figure (5). In the current study, it was recorded that the lowest value was 0.8 mg / L in November in the second station, due to the absence of any industrial activity in that region, as well as the increase in water resources during the winter compared to the summer. The current study showed that the value of the vital requirement for oxygen is low. In winter, the reason for this may be due to the lack of solubility of gases when the temperature rises, and the current study agreed with the study of Al-Khalidi (2012) and Al-Gharabi (2014) in the Diwaniyah River. While the highest value of 5 mg / liter was recorded in January in the third and fourth station in February, and the reason for the water thrown out by the municipality of Kufa may be due to the river water, which contains many organic substances, in addition to the great activity of cafes on the river, which throws out all the owners Food and human excreta directly into the river without any treatment, and this is consistent with the study (Muhammad, 2012), which found that the BOD value is high.
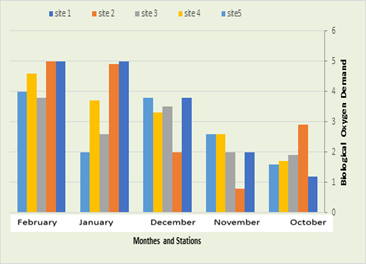
Figure 6
Electrical Conductivity
The results revealed that the amount of electrical conductivity in the first station were 1271 micro-Siemens/cm in November and 1812 micro-Siemens/cm in December, while in the second station the amount of electrical conductivity ranged between 1271 micro siemens/cm in November and 1933 micro siemens/cm in November. /Cm in December, while the electrical conductivity recorded in the third station was between 1375 micro siemens / cm in November and 1698 micro siemens / cm in December, while it was recorded in the fourth station a rate ranging between 1375 micro siemens / cm in October the first and 1672 micro siemens/cm in January, also in fifth location the electrical conductivity ranged between 1395 micro siemens/cm in October and 1733 micro siemens/cm in December, as in Figure (6).
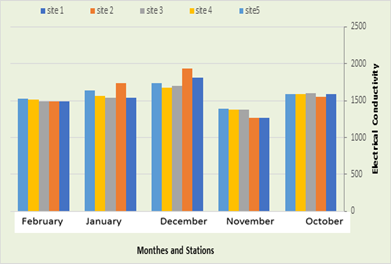
Figure 7
Salinity
The salinity was recorded in the first station were ranged between 0.5 parts per thousand in December and February and 0.5 parts per thousand in October. As for the second station, the amount of salinity ranged between 0.6 parts per thousand in December and February and 0.99 parts per thousand in December. October, while the salinity recorded in the third station ranged between 0.5 parts per thousand in December and February and 1.02 parts per thousand in October, while a salinity recorded in the fourth station ranged between 0.03 parts per thousand in October and 0.88 parts per thousand. In the month of November, while in the fifth site, the salinity ranged between 0.5 parts per thousand in December and 1.02 parts per thousand in the month of October, as in Figure No. (7). One of the water systems most affected by salinity is fresh water, and this may happen due to low water levels or as a result of rising groundwater, as well as to increase evaporation processes in the hot months, and human activities have a significant impact on increasing the concentration of salts (Nielsen et al., 2003). The lowest value (0.5) was recorded in February 2021 in the third and first stations, and in December in all stations except the second, as well as in March. All stations except the fifth and the highest value (0.7) in the month of January 2021 in the second station, as an increase in the salinity value was observed in this month, and the reason may be due to the high temperatures that lead to an increase in evaporation processes, and as a result an increase in the concentration of salts, and as for a decrease in the salinity value in the winter months It is due to the rise in the water level in those months, and thus the increased dilution of salts.
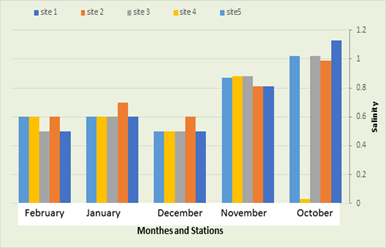
Figure 8
Turbidity (NTU)
In the current study, it was recorded that the amount of cloudiness in the first station ranged between 1.1 in November and 4.4 NTU in October. As for the second station, the amount of cloudiness ranged between 0.99 NTU in October and 4.8 naphthalene in November, while the recorded cloudiness was in the third station, it ranged between 1.31 NTU in February and 6 in October, while in the fourth station an average between 1.33 in February and 7 naphthalene in October was recorded, while in the fifth location the cloudiness ranged between 6.6 in February and 1.34 NTU in the month of October, as in Figure (8). Muddyness is defined as the state of water resulting from the presence of suspended solids such as soil particles, sand, mud, and suspended organic and inorganic materials. It can also be due to the presence of microscopic living bacteria and floating plants, as muddyness increases in running water, as a result of the movement of sediment with the water stream, and this is what happens in Rivers and their value decreases in relatively stagnant waters, as is the case in the marshes and groundwater (Abbawi and Hassan, 1990).
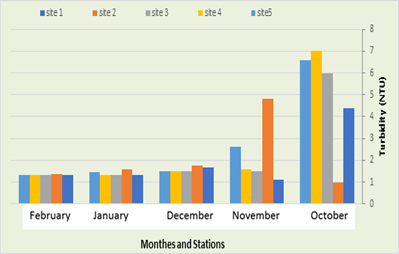
Figure 9
NO3 Nitrates
In the current study, it was recorded that the number of nitrates in the first station ranged between 0.004 mg/l in January and 0.07 mg/l in October, while in the second station the number of nitrates ranged between 0.004 mg/l in January and February and 0.07 in the month of January. October, as shown in the table, while the recorded nitrates in the third station ranged between 0.012 mg / liter in February and 0.099 mg / liter in December, while the fourth station recorded an average between 0.014 mg in February and 0.087 mg in the month November, while in the fifth location, nitrates ranged between 0.012 mg/l in February and 0.087 mg/l in October, as shown in Figure (9). The value of nitrates recorded in the current study ranged between (0.004-0.138) micrograms / liter, which is a low concentration compared to what was recorded by Alkinzawi, (2009) in three marshes in southern Iraq. This may be due to the density of phytoplankton and zooplankton, which leads to the consumption of the largest amount of nutrients, and this was confirmed by AL-Kenzawi, (2007), and this was confirmed and consistent with Al Maulood et al., (1979).
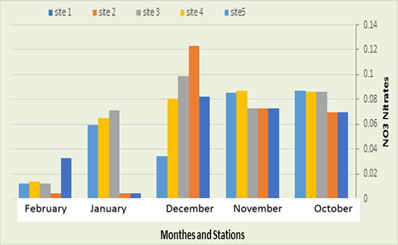
Figure 10
PO4 phosphate
In the current study, it was recorded that the amount of phosphate in the first station ranged between 0.022 mg/liter in December and January and 0.055 mg/liter in February, while in the second station the amount of phosphate ranged between 0.021 mg/liter in December and 0.067 mg/liter. In February, while the phosphate recorded in the third station ranged between 0.021 mg/liter in February and 0.056 mg/liter in October, while it was recorded in the fourth station, a rate ranging between 0.032 mg/liter in January and 0.058 mg in January. February, while in the fifth location, phosphate ranged between 0.45 mg/L in January and 0.07 mg/L in October, as shown in Figure (10). The highest value was 0.167 in November, which is high for phosphorus at the station, and the lowest value was 0.021 in December due to what is discharged from various sources such as residential complexes that contain detergents and wastewater Industrial. Fertilizer run-off, water treatment, tributaries, rainwater, urban waste, agricultural landfills, groundwater, animal waste and its decomposition and the process of nitrogen fixation in the atmosphere (Al-Saadi, 2002). The value of phosphate decreases in the second station due to the spread of phytoplankton and aquatic plants that consume phosphate in large quantities and store it inside their bodies (Al-Essa, 2004; Al-Yasiri, 2009).
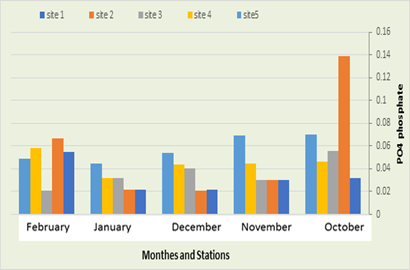
Figure 11
References
- Al – Haidarey, M.S. (2009). Assessment and Sources of Some Heavy Metals in Mesopotamian Marshes Ph.D. Thesis University of Baghdad Iraq, 155.
Publisher | Google Scholor - Al – Haidarey, M. 1. (2010). Duirnal Variation of heavy metals in Al – Kufa River / Najaf fraq. 10 conferences of biogeochemistry of trace element Maxise.
Publisher | Google Scholor - Al – Hadiary, M.J.S. (2012). The relationship between environmental variables and Bacterial community of Al – Kufa River sediments. J. Kufa Unv. of the propag, 666.
Publisher | Google Scholor - Abdul-Sahib, M. I. and Sultan, E.N. (2006). Moult stages and Fortnightly moulting of the penacid shrimp Meta Penaeus affine is, Mar Mes, 11(1):79-87.
Publisher | Google Scholor - Al-Yaseri. S.T.L. Ajeel S.G. and AL-Lmarah, F.G.M. (2014). Contamination of Zooplankton by petroleum hydrocarbons in Shatt Al Arab River, Basrah, Iraq. Intern. J. of Envi. and Water, 3(5):2052-3408.
Publisher | Google Scholor - Anant, J. D. (2011). Statistical approaches for computing diversity and density of Zooplankton with water factor in Mula dam, Rahuri, M.S. Euro. J. of Expe. Biol, 1(2):68-76.
Publisher | Google Scholor - Anderson, R.C (1995). Aaquarium husbandry of the giant Pacific Octopus. Drum and Croaker. 26:14-23
Publisher | Google Scholor - Andries, T. M. (2005). Food intake, growth, and reproduction as affected by day length and food availability in the pond snail Lymnaea stagnalis Amer. Malas Bull, 23:113-120.
Publisher | Google Scholor - Angeler, D.G. Alvarez-Cobelas, M. and Sanchez-Carrillo, S. (2010). Evaluating environmental conditions of a temporary pond complex using rotifer emergence from dry soils. Ecolo. Indic, (10) :545-549.
Publisher | Google Scholor - APHA (American Public Health Association) (1999). Standard APHA 9 Methods for Examination of Water and Wastewater, 20th Edition.
Publisher | Google Scholor - Balayla, D.J. and Moss, B., (2004). Relative importance of grazing on algae by plant associated and open – water micro crustacea (Cladocera). Archive fur Hydrobiol, (161) :199-22.
Publisher | Google Scholor - APHA (American Public Helth Association). (2005). Standard methods for examination of water and waste water, 21st. Ed. Washington DC, USA, (1400)4
Publisher | Google Scholor - Al-Saad, H. T. Hantoush, A. A. Abdullah, S. B. and Abdl-Shahib. I. M. (2000). Petroleum hydrocarbons (PHC) in the muscles of Melanopsis Nodosa in Shatt Al – Arab River. Iraq. Marina Mesopotamia, 15(2): 559-571.
Publisher | Google Scholor - Baloch, W. A. Jafri, S. I. H and Mahar, M. A. (2008). Seasonal Variation and Species Composition of Crustacean Zooplankton (Order: Cladocera) in Manchhar Lake, Sindh, Pakistan. Pakistan J. Zool, 40(2):65-68.
Publisher | Google Scholor - Allen, L.G. (1982). Seasonal abundance, composition and productivity of fish assemblage in upper Newport Bay California. Fish. Bull, 80(4):769-790.
Publisher | Google Scholor - Horn, M.H. and Allen, L.G. (1985). Fish community ecology in southern California Bays and estuaries. In: Ayanez Aroncibia (Ed.). Coastal lagoon towards an ecosystem. Fish community ecology in estuaries Integration, 645.
Publisher | Google Scholor - Al-Zurfi, S.K. (2010). Ecological Study of ibn Najim Marsh Plants in Central Mesopotamia. Iraq. Ph.D. Thesis. Faculty of Science University of Kufa,169.
Publisher | Google Scholor - Braunstein, I. Mankowitz, S. Moshe, Y. and Hershko, A. (2007). Inhibitory associated with anaphase– promoting complex / cyclostome in factors mitotic checkpoint. Proc. Natl. Acad. Sci. USA, (104):4870-4875.
Publisher | Google Scholor - Barbour, M.T. Stribling J.P. and Karr, J.R. (1995). Multimeric approach for establishing and measuring biological condition. In: John J. Mack (2007). Developing a wetland IBI with statewide application after multiple testing iterations. Ecological indicators, 7:864-881.
Publisher | Google Scholor - Bekleyen, A. and İpek, E. (2010). Composition and Abundance of Zooplankton in a Natural Aquarium, Lake Balıklıgol (Şanlıurfa, Turkey) and New Records. J. of Anim and Veter. Adva. 9(4):681-687.
Publisher | Google Scholor - Bowles, H.R. Babcock, L. and Lai, L. (2007). Social incentives for gender differences in the propensity to initate negotiations: sometimes it does hurt to ask. Organizational Behavior and Human Decision processes, 103(1):84-103.
Publisher | Google Scholor - Boyd, C.E. and Tucker, C.S. (1998). Pond Aquaculture Water Quality Management. Kluwer Academic Publishers, London, 541-575.
Publisher | Google Scholor - Ben-Ami, F. and Heller, J. (2005). Spatial and temporal patterns of parthenogenesis and parasitism in the freshwater snail Melanopsis tuberculata. J. Evol. Biol, 18:46-138.
Publisher | Google Scholor - Chapella, G. and Petts, E. (2004). Amphipod Crustacean size spectra: New insights in the relationship between size and Oxygen. Oikos, 612-623
Publisher | Google Scholor - Grzesiuk, M. and Mikulski, A. (2006). The effect of salinity on freshwater Crustaceans. Pol. J. Ecol, 54(4):669-674
Publisher | Google Scholor - Coleman, R. and Pettigrove, V. (2001). Water Way assessment in the western port catchment: the health of the lang river. Water ways group Melbourne water corporation.
Publisher | Google Scholor - Chau, K.W. and Jin, H. (2002). Tow-Layered, 2-Dunsteady Eutrophication Model in Boundary fitted Coordinate System. Mar. Poll. Bull, 45(112):300-310.
Publisher | Google Scholor - Coleman, R. and Pettigrove, V. (2001). Water Way assessment in the western port catchment: the health of the lang river. Water ways group Melbourne water corporation.
Publisher | Google Scholor - Deely, D.M. and Paling, E.I. (1999). Assessing the ecological health of Estuaries in Australia Marine and Fresh Water Research Laboratory. Murdoch University, Australia.
Publisher | Google Scholor - Deibel, D. (1994). Marine bio diversity monitoring: Monitoring protocol for zooplankton. Ocean Science Center, Canada.
Publisher | Google Scholor - Eads, B.D. Andrews, J and Colbourne, J.K. (2008). Ecological genomics I
Publisher | Google Scholor - In Daphnia: stress responses and environmental sex determination. Heredity, 100:184-190.
Publisher | Google Scholor - El-Deeb Ghazy, M.M. Habashy, M.M. and Mohammady E.Y. (2011). Effect of pH on survival, growth and reproduction rates of the Crustacean, Daphina magna. Australian. J. Bas. Appl. Sci, 5(11):1-10.
Publisher | Google Scholor - Ferdous, Z. And Muktadir, A.K.M. (2009). A review: Potentiality of zooplankton bioindicator. Amercian Journal of Applied as Sciences, 6(10):1815-1819.
Publisher | Google Scholor - Grzesiuk, M. and Mikulski, A. (2006). The effect of salinity on freshwater Crustaceans. Pol. J. Ecol, 54(4):669-674.
Publisher | Google Scholor - Haines, T. A. (1981). Acidic precipitation and its consequences for aquatic ecosystems. A review. Trans. Am. Fish. Soc, (110)669-707.
Publisher | Google Scholor - Harris, J.H. (1994). Nutrient loading and algae blooms in Australian waters. A discussion Paper.12194.
Publisher | Google Scholor - Hawkes, H.A. (1975). River Zonation and Classification. Pp.313347 in River Ecolgy (EdB. A Whitton). Black well Scientific Publications. Oxford,725.
Publisher | Google Scholor - Henderson, P.A. (2002). Fresh Water Ostracodes Pisces Conser – vation Ltd: 258.
Publisher | Google Scholor - Herrera, F. A. and Castro, L. (2008). Seasonal variation in grazing of the Copepods Eucalanusin the continental shelf of the southcentral Caribbean Sea, Colombia. Caribbean. J. of Sci, 44(3):361-374.
Publisher | Google Scholor - Hessen, D.O. and Lyche, (1991). Interspecific variations in zooplankton element composition. Arc. Hydrobiol,121:343-353.
Publisher | Google Scholor - Hickman, C. Roperts L. Keen, S. Eisenhour, D. Larson, A. Anson, H. (2011). International Principles of Zoology, Fifteenth Edition, Washington. Florida and Lee University.
Publisher | Google Scholor - Holthuis, L.B. (1980). FAO Species Catalogue. Vol. 1. Shrimps and prawns of the world. An annotated catalogue of species of interest to 49) Jennings, A. E. Conklin, A. R. and Cooper, T. A. (1994), Living and total benthic foraminifera from box cores across the East Greenland Front. Supplement. Paleobios 16, (38). Smith, R. (2004). Current Methods in Aquatic Science, University of waterloo, Canada … Jeppesen, E.
Publisher | Google Scholor - Kasnazany, S. A. S. Barznjy, L. G. K. Fatih, A. A. Mirza, A. N. & Krbchna, S. J. J. (2021). Comparative study related to physico-chemical properties of four tomato cultivars grown in Kurdistan region, Iraq. Kufa Journal for Agricultural Sciences,13(2):41-52.
Publisher | Google Scholor - Sabah R. (2021). Simultaneous HPLC estimation of Amphetamine and Caffeine abuse drugs in Iraqi human addicts. Journal of Advanced Sciences and Engineering Technologies,13:4(1)25-31.
Publisher | Google Scholor - J Mattigatti, S, & Datkhile, K. (2021). Synthesis, characterization and application of green synthesized ag nps in endodontic therapy to reduce microbial biofilm. Uttar Pradesh Journal of Zoology, 42(12):25-30.
Publisher | Google Scholor - Mohammed, D. Enouz, A. J. Areaaer, A. H. J. (2021). Effect of Adding Different Levels of Antioxidant and Imported Ginseng (Panax) Roots to The Diet in The Microbial. Kufa Journal for Agricultural Sciences,13(2):1-5.
Publisher | Google Scholor - Rulla Sabah, Ahmed saad abbas Fatin F. Al-Kazazz, Salam A.H Al-Ameri, Investigation on Glucose and levels of Zn and Cu in Sera of Iraqi Males addicted on Methamphetamine or Tramadol. Journal of Advanced Sciences and Engineering Technologies, 3(2).
Publisher | Google Scholor - ensen, J.P. and Sondergaard, M. (2002). Response of phytoplankton, Zooplankton and fish to reoligotrophication: an 11 – year study of 23 Danish lakes, Aqua, Ecosy. Heal and manage, 5:31-43.
Publisher | Google Scholor - John, Y. Richardson, S.and Negishi, D (2004). Detritus processing, ecosystem engineering and benthic diversity: A test of predator – omnivore interfernce: J. of Animal Ecol, 73:756-766.
Publisher | Google Scholor - Kavaz D. (2023). Characterization, Synthesis, and Evaluation of Antimicrobial, Anticancer Properties of Laurus nobilis-derived ZnO Nanoparticles. Nano World J, 9(3): 55-61.
Publisher | Google Scholor - Supriya V, Poiba VR, Vang Alapati M. 2023. Catalytic Activity of Nanocomposite: Synthesized Electrochemical Sludge using Iron Electrodes and Marine Algae (Fe3 O4 /marine algae NP) for the Degradation of Emerging Pollutant Malathion. Nano World J, 9(2):29-36.
Publisher | Google Scholor - Kassim, A. (1998). The case of a new receiving country in the developing world: Malaysia ‘in Nations, U. (ed.) Technical Symposium on International Migration and Development. (The Hague).
Publisher | Google Scholor - Kefford, B; Nugegoda, D; Metzling, L. and Fields, E. (2006). Validating species sensitivity distributions using salinity tolerance of rivaerine macroinvertebrates in the southern Murray tolerance- Darling Basin (Victoria, Australia). Canadian. J. of Fisher. and Aqu. Sci, 63:1865-1877.
Publisher | Google Scholor - Kubodera, T. and Mori, K. (2005). First–ever observation of alive against squid in the wild. PDF Procedings of the Royal Society B. Bioloical sciences, 272(1581):2583-2586
Publisher | Google Scholor - Hind A A. Samira K H. (2023). Isolation and identification of Proteus mirabilis bacteria from different clinical sources and investigation of some of their virulence factors. Journal Alharf, Issue August, 18:148-160.
Publisher | Google Scholor - Rusul Najm, Jinan M H. (2023). Detection of Virulence Genes of Pathogenic Escherichia coli Isolated from Different Sources, Journal Alharf, 18:130-138.
Publisher | Google Scholor - Lampert, W. and Sommer, U. (2007). Limnoccology (The Ecology of lakes and Streams). Oxford University press.2d Edition, 324.
Publisher | Google Scholor - Mandaville, S.M. (2002). Benthic Macroinvertebrates in Fershwaters- Taxa Tolerance Values, Metrics, and Protocols. Project H – 1, Soli and water Consevation Society of Metro Halifax.xviii 48p. Appendices A - B, 120.
Publisher | Google Scholor - Maria-Helen, Z Micha Loudi, E. Bobori, D. C. and Mourelatos, S. (2000). Zooplankton abundance in the Aliakmon River, Greece. Belg. J. Zool, 130(1):29-33.
Publisher | Google Scholor - Molinero. J. C. Anneville, O. Souissi, S. Balvay, G. and Gerdeax, D. (2006). An anthropogenic and climate forcing on the long - term changes of planktonic rotifers in Lake Geneva, Europe. Journal of Plankon Research, 28(3):287-296.
Publisher | Google Scholor - Malek, E. A. (1974). Medical and Economic Malacology. Academic Press. 68-69.
Publisher | Google Scholor - Madriaga, MG, T. Ruma and Theis, JH. (2007). Autochthonous human paragonimiasis North America. Wilderness Environ Med, 18:5-203.
Publisher | Google Scholor - Mukaratirwa, S. Munjere, I. F. Takawira, M. and Chingwena. G. (1896). fresh water gastropoda species in (2004). Susceptibility of seven Zimbabwe to infection with Gastrodiscus aegyptiacus (Cobbold, 1876) Looss. J South African Vet Assoc, 75:8-186.
Publisher | Google Scholor - Mackie, G. L. (1998). Applied Aquatic Ecosystem concepts. University of Gustom Course pack. 12.
Publisher | Google Scholor - Nielsen, R. D.R. Tarpy and Reeve, H.K. (2003). Estimating effective paternity number in social insects and the effective number of alleles in a population. Molec. Ecol, 12:3157-3164.
Publisher | Google Scholor - Hutchinson, G. E. (1993). A treatise on limnology. Vol. Iv The Zoobenthos. Ed. Y. H. Edmondson. John Wiley and sons, Ins. Xx, 999.
Publisher | Google Scholor - Aguinaldo, C. (2018) Characteristics That All Fish Have in Common, sciencing, Retrieved 19:10.
Publisher | Google Scholor - Jennifer Kennedy (2017),
Publisher | Google Scholor - Harris, J.H. (1994). Nutrient loading and algae blooms in Australian waters A discussion Paper.
Publisher | Google Scholor - Hawkes, H.A. (1975). River Zonation and Classification.Pp.313347 in River Ecology (EdB. Awhitton). Black well Scientific Publications, Oxford, 725.
Publisher | Google Scholor - Zahraa H R, Hussein S N. (2023). Isolation and identification of fungus contaminated with white pepper and detection of Mycotoxins produced from it in Al-Najaf Governorate, Journal Alharf, 18:148-160
Publisher | Google Scholor - New, T.R. (1988). Invertebrate Surveys for conservation. Oxford University press, New York.
Publisher | Google Scholor - Nyakeya. K. Raburu, P. O. Masese, P. O. and Gickuki, J (2009). “Assessment of pollution impacts on the ecological integrity of the kisian and kisat rivers in Lake Victoria drainge basin Kenya. “African Journal of Environmental Science and Techonlogy, 3(4):97-107.
Publisher | Google Scholor - Patel, V. Shukla, S.N. and Patel, V.K. (2013). Studies on the diversity of zooplankton and their seasonal variation in Govindgarh lake at Rewa (M.P), India. Indian J. Appl. Res. 3(11):544-546.
Publisher | Google Scholor - Pollumae. A Kotta, J. (2007). Factors and community Of the Gulf of Finland, with respect to native and introduced predatoy cladoceran interactions Oceanologia, 49:277-290.
Publisher | Google Scholor - Razak, S. A. and Saisho, T. (2011), Cyclomorphism in Bosmina longirostris (Crustacea: Cladocera) from Lake Ikeda. Japan. Sai. Malay, 40:543-547.
Publisher | Google Scholor - Roth, R.A. (2009). Freshwater aquatic biomes Fish Edition. Green Wood Press. London, 237.
Publisher | Google Scholor - Ruppert, E.E. Fox, R.S. and Barnes, R.D. (2004). 7th Edition, Thomson – Brooks / Cole. Invertebrate Zoology.
Publisher | Google Scholor - Saad, M.A.H (1988). Seasonal variation of Physico – chemical condition of Shatt AL – Arab Estuary. Iraq Estuarine and coastal marine science, 6:503.
Publisher | Google Scholor - Sharma, S. Hoque, A.T.M.R. Analuddin, K. and Hagihara, A. (2010). Seasonal foliage dynamics of mangrove Bruguieragy menorrhea (L.) Lamk. In a subtropical region, Manko Wetland, Okinawa Island, Japan. Proc. of the 15th In. Forestry and Environment Symposium Sci, Univ. of Jayewardenepura, Sri, Lanka, 237-244.
Publisher | Google Scholor - Shurin, J.B. Winder, M. Adrian, R. Keller, W. (Bill); Mattews, B. Paterson, A M. Paterson, M.J. Pinel – Alloul, B, Rusak J. A. and Yan, N.D. (2010). Environmental stability and lake zooplankton diversity contrasting effects of chemical and thermal variability. Ecology Letters, 13(4):453-463
Publisher | Google Scholor - Tiberti, R. (2011). Morphology and ecology of Daphnia Middendorf Iana, Fisher 1851 (Crustacea, Daphniidae) from four new populations in the Alps. J. of Limnol, 70(2).
Publisher | Google Scholor - Wang, Y.C. Wu, X.F. Shi, H.X. and Zheng, W.B. (2011). Study on zooplankton communities near coastal power plants in Xiangshan Bay. Washington DC, USA, 1015. J. of Nin. Univ. (NSEE), 24(3):5-10.
Publisher | Google Scholor - Weiner, E.R. (2000). Application of Environmental chemistry. Lewis Publisher, London, New York.
Publisher | Google Scholor - Wetzel, R.G. (2001). Limnology. Lake and River Ecosystems, 3th Edition. Academic Press, an Elsevier Science Imprint, San Francisco, New York, London, 429.
Publisher | Google Scholor - Yıldız, Ş. Altındağ, A. and Borga Ergönül, M. (2007). Seasonal fluctuations in the Zooplankton composition of a eutrophic lake: Lake Marmara (Manisa, Turkey). Turk. J. Zool. 31:121-126
Publisher | Google Scholor - Eisenreich SJ, Bannerman RT, Armstrong DE: (1975). A Simplified Phosphorus Analysis Technique. Environmental Letters, 9(1):43-53.
Publisher | Google Scholor - Lindberg O, Ernster L: (1956). Determination of Organic Phosphorus Compounds by Phosphate Analysis. In: Methods of Biochemical Analysis. Edited by Glick D, Hoboken, NJ, USA: John Wiley & Sons, Inc. 3
Publisher | Google Scholor - Valderrama JC: (1981). The simultaneous analysis of total nitrogen and total phosphorus in Natural waters. Marine Chemistry, 10(2):109-122.
Publisher | Google Scholor - Motomizu S, Li Z – H. (2005). Trace and ultratrace analysis methods for the determination of Phosphorus by flow – injection techniques. Talanta, 66(2):332-340.
Publisher | Google Scholor - Komanwicz 1. Harsikiewicz D. (2016). Determination of total arsenic and amente species in brinking water, surface water, wastewater, and snow from Wielkopolska, Kujawy Pomerania, and Lower Silesia provinces, Poland Environmental Monitoring and Assessment, 188(9):504,
Publisher | Google Scholor - Brahman KD, Kan 16, Afridi FI, Naseem S, Arain SS. Ullah N. (2013). Evaluation of high Levels of fluoride, arsenic species and other physicochemical parameters in Underground water of two sub districts of Therparkar, Pakistani A multivariate study. Water Research, 47(47):1009-1020.
Publisher | Google Scholor - Suger E. Tatar B. Zaray 6, Mihuez V6: (2013). Field separation-based speciation analysis of Inorganic arsenic in public well water in Hungary. Microchemical Journal, 107(Supplement C), 131-135.
Publisher | Google Scholor - Pozabon D, Dressler VL, Gomes Neto JA, Curtius AJ: (1998). Determination of arseme (it) And arsenie (V) by electrothermal atornic absorption spectrometry after complexation and sorption on a C – 18 bonded silica columns. Talants, 45(6):1167-1179.
Publisher | Google Scholor - Lenoble V, Deluchet V. Serpaud B. Bollinger 1 – C: (2003). Arsenite oxidation and arsenate Determination by the molybdene blue method. Talanta, 61(37)267-276
Publisher | Google Scholor