
Research Article
Prediction of Augmented Efficiency between Electric Pulses and Bleomycin on K562 and MIA-PACA2 Cancer Cells Using Adaptive Neuro-Fuzzy Inference System Method
- Salim Mirshahi 1,2*
- Neshat Mirshahi 2
- Sepideh Mirshahi 2
- Kiarash Aryana 3
- Anita Farzaneh Far 2
- Ameneh Sazgarnia 2
- Amirhossein RadmanKian 4
1Department of Mechanical Engineering, Sharif University of Technology, Tehran, Iran.
2Medical Physics Research Center, Mashhad University of Medical Sciences, Mashhad, Iran.
3Department of Mechanical Engineering, Ferdowsi University of Mashhad, Mashhad, Iran.
4Department of Industrial Engineering, University of Tehran, Tehran, Iran.
*Corresponding Author: Salim Mirshahi, Department of Mechanical Engineering, Sharif University of Technology, Tehran, Iran.
Citation: Mirshahi S, Mirshahi N, Mirshahi S, Aryana K, Sazgarnia A, et al. (2024). Prediction of Augmented Efficiency between Electric Pulses and Bleomycin on K562 and MIA-PACA2 Cancer Cells Using Adaptive Neuro-Fuzzy Inference System Method. Clinical Case Reports and Studies, BioRes Scientia Publishers. 5(3):1-9. DOI: 10.59657/2837-2565.brs.24.105
Copyright: © 2024 Salim Mirshahi, this
Copyright: © 2024 Salim Mirshahi, this is an open-access article distributed under the terms of the Creative Commons Attribution License, which permits unrestricted use, distribution, and reproduction in any medium, provided the original author and source are credited.
Received: December 16, 2023 | Accepted: January 24, 2024 | Published: March 01, 2024
Abstract
Cell membranes always respond to electric fields because cell membranes consist of ions and molecules. For many years, the technique of inducing electric pulses into the cell to increase its permeability has been investigated. When rectangular pulses with a train of high voltage (about 1000 V/cm) and low repetition frequency (about 1 Hz) are applied, patients feel an unpleasant sensation, while electroporation (EP) using higher repetition frequency and low voltage (HFLV) has been shown to have a higher inhibition of tumor growth. The current study aimed to predict synergism between EP and Bleomycin (SEPB) affecting K562 and MIA-PACA2 cancer cells and to optimize repetition frequency and electric pulse amplitude for HFLV EP by sampling a wide variety of different sets of pulse specifications on SEPB. Both cell types were exposed to higher frequency (4-6 kHz) and low voltage (50–150 V/cm). The characteristics of electric pulses that generate effective synergism with a small dose of Bleomycin were determined. As an output of the applied electric pulses with arbitrary frequency and voltage, the resulting synergism can be achieved using a theoretical model based on an adaptive neuro-fuzzy inference system (ANFIS). Results showed a significant correlation between experimentally observed and theoretically predicted data regarding the calculated coefficient of determination (R2 = 0.99 for K562 and 0.86 for the MIA-PACA2 cell type). It is concluded that this model is intensely reliable for prediction. This suggests that the model is valid and can calculate the SEPB that is affected by the magnitude of the electric pulse and the repetition frequency. Applying the prior experimental results to future drug delivery or biophysical applications might suggest this approach as a time and resource-saving alternative to conducting more tests.
Keywords: electrochemotherapy; low voltage; cell viability; electro permeabilization; adaptive neuro-fuzzy inference system; electroporation
Introduction
In the last two decades, the application of electric pulses in research areas like drug delivery has been effectively investigated. This approach is called electroporation. Determination of the critical parameters of electric pulse, like amplitude and duration, directs to gain knowledge about the required situation and time of shaping the induced reversible or irreversible influences on the constituting components of the cell membrane (Kim & Lee, 2017; Kotnik et al., 2015; Kotnik et al., 2019; Tajani et al., 2017). The formation of electropores on the cell membrane is contributed to the reversible EP. These pores are shaped during this phenomenon and released in a short time after the EP procedure. The cells are killed by irreversible EP (O’Brien et al., 2018). Electrochemotherapy (ECT) is known as the increase in the transportation of chemotherapy drugs into cancer cells by applying electric pulses. The aim of the ECT is to shape a reversible effect on the cell membrane by high permeabilization (Ringel-Scaia et al., 2019; Ruarus et al., 2018). The specifications of electric pulses and cell type are the two elements that need to be considered in the determination of the threshold effect in permeability and cell killing. The pulse parameters such as amplitude, number of pulses, and frequency are the necessary elements. These parameters should be carefully chosen (Gothelf et al., 2003; Lebar et al., 2002; Rols & Teissié, 1998). Patients feel unpleasant sensations when high voltages are used. Low repetition frequency pulses with high amplitude cause muscle contractions, leading to pain sensations (Miklavčič et al., 2005; Mir, 2006; Pucihar et al., 2002). The application of HFLV ECT has been proposed to decrease the resulting pain sensation due to the use of changed electric pulses in specifications when ECT is operated.
In recent years, choosing specific electric pulses with higher repetition frequency above the frequency of titanic contraction has led to a decrease in the number of induced muscle contractions in number (Miklavčič et al., 2005; Shankayi et al., 2010; Županič et al., 2007). The ECT with HFLV has a significant effect in inhibiting tumor growth (Shankayi & Firoozabadi, 2012; Shankayi et al., 2012). There are mathematical models propounded to predict the cell death affected by drugs or the combination of the drug and drug delivery techniques. The adaptive neuro-fuzzy inference system (ANFIS) is strongly proper for prediction in drug delivery, particularly ECT. Zadeh propounded the theory of fuzzy sets (Li et al., 2015). This method is involved in challenges caused by complex issues. The fuzzy system was based on using existing experiences. The fuzzy sets cannot be learned, but they can be eliminated by utilizing artificial neural networks (ANNs). ANNs are capable of learning (Fang & Chow, 1999). They showed that ANNs make relations between input and output data by modeling the connections of human brain neurons. Nevertheless, the weakness which is contributed to ANNs is that they were not able to indicate a systematic manner among inputs and outputs. Combining fuzzy logic and ANNs leads to overcome the weaknesses of both methods. Jang proposed systems known as ANFIS (Hilberg, 1969; Mirshahi & Rajabi, 2018; Mirshahi et al., 2024; Qiu et al., 2020).
The aim of this work is to investigate the synergism of EP and Bleomycin under different experimental conditions. In the current study, synergism between EP and Bleomycin (SEPB) for samples affected by HFLV EP (4-6 kHz, 50-150V/cm) and Bleomycin, predicted by mathematical model and the comparison with experimental data, were investigated. As a strongly reliable model for prediction, this model is suggested and useful in that it can calculate the SEPB that is affected by the magnitude of the electric pulse as well as the repetition frequency. By applying the prior experimental results to future drug delivery or biophysical applications, this approach might be suggested as a time and resource-saving alternative to conducting more tests.
Materials and methods
In the current study, a mathematical model will be provided based on the experimental results extracted from the experimental work done previously, which are explained below. The content of this paper is based on a theoretical study due to providing a mathematical model.
Cell Lines
The results achieved by Shankayi et al. are selected for this study (Shankayi et al., 2014). They considered two types of cells, including K562 and MIA-PACA2, which were exposed to three different repetition frequencies of 4,5 and 6 kHz and eleven different pulse amplitudes (50-150 V/cm) with increments of 10 V/cm. In this experimental work, Bleomycin was used at 1  concentration. The samples were kept in room temperature for 1 min.
Synergism Formula
A synergism coefficient was determined to estimate the synergistic effect of the electric pulses and bleomycin cytotoxicity. The synergism formula can be considered as follows:
 | (1) |
S is the defined synergistic coefficient between the electric pulses and Bleomycin,  is the percent cell death from combined treatment,
  is the percent of the dead cells of the electric pulses, and
  is the percent of the dead cells of the bleomycin treatment.
Statistical Analysis
Statistical analyses were performed using SPSS for Windows 16.0 (SPSS Inc., Polar Engineering and Consulting). In order to compare SEPB from different input parameters, SEPB for 33 different samples was specified. SEPB for all 33 experiments are shown in Figure 1 and Table 1. They are in the range between 1.123 and 13.066 and between 0.362 and 9.845 for K562 and Mia Paca2, respectively.
Table 1: Calculated SEPB for 33 different samples related to A) K562 cell type and B) MIA-PACA2 cell type.
Applied Electric Field (V/cm) | Frequency kHz | |||||
| Mia-Paca2 | K562 | |||||
| 4 (index) | 5 (index) | 6 (index) | 4 (index) | 5 (index) | 6 (index) | |
| 150 | 4.629192(1) | 7.3766854(12) | 1.37577(23) | 1.557192(1) | 3.8928551(12) | 2.454991(23) |
| 140 | 4.315842(2) | 0.3618501(13) | 1.62607(24) | 1.664461(2) | 2.3170919(13) | 3.32979(24) |
| 130 | 6.503278(3) | 8.8471214(14) | 4.709737(25) | 2.238796(3) | 3.2122438(14) | 1.574409(25) |
| 120 | 8.153939(4) | 7.5235349(15) | 7.264588(26) | 4.903463(4) | 2.5875137(15) | 1.123084(26) |
| 110 | 9.09443(5) | 5.07782(16) | 9.11788(27) | 2.682543(5) | 2.9208718(16) | 4.364225(27) |
| 100 | 2.804324(6) | 6.4610766(17) | 5.228148(28) | 4.218441(6) | 2.0809484(17) | 1.24677(28) |
| 90 | 5.956245(7) | 2.6050136(18) | 9.944563(29) | 6.501519(7) | 2.5374893(18) | 7.429108(29) |
| 80 | 7.885502(8) | 9.845313(19) | 7.425851(30) | 10.56118(8) | 15.06(19) | 13.06642(30) |
| 70 | 2.665584(9) | 7.5829684(20) | 5.927937(31) | 7.859753(9) | 6.798788(20) | 11.51009(31) |
| 60 | 1.559034(10) | 1.6490702(21) | 4.292984(32) | 7.404747(10) | 6.4330285(21) | 7.463579(32) |
| 50 | 4.598202(11) | 7.2097594(22) | 1.982634(33) | 7.788259(11) | 7.2278292(22) | 11.93389(33) |
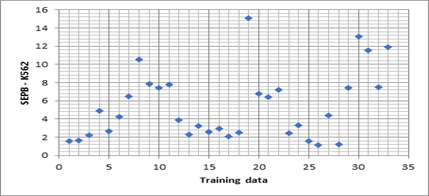
Figure 1: The amount of SEPB for All experiments
Propounding a mathematical model is necessary when the cost of doing experiments is so high, and it lasts a long time to be done. This model is made based on utilizing the experimental data. It led to determining the SEPB of the newly applied electric pulse and injecting Bleomycin into the cell suspension without doing any experiments. In the next section, the way of discovering this model is explained.
Design and training of a fuzzy inference system for the prediction of synergism value
In this section, a mathematical model named fuzzy model is used to predict the SEPB. Figure 2 (A) shows the basic fuzzy structure in general view. In the third layer, a learning algorithm was utilized to build rules. This learning algorithm is called ANFIS model learning. The basic structure of the ANFIS algorithm is displayed in Figure 2 (B). SEPB was considered as an output variable, while the frequency and amplitude of the electric pulses were set as input variables. The structure of the ANFIS consists of 2 inputs and one output.

Figure 2: A) General fuzzy structure (System K562-Synergism: 2 inputs, 1 output, 9 rules; B) Basic ANFIS structure (Qiu et al., 2020)
In this computational method, a Takagi–Sugeno type fuzzy IF–THEN rules was applied (Eq. 2).
 x1 + nx2 + l x1 + nx2 + l | (2) |
Where x1 and x2 are inputs 1 through to 2, respectively, m and n are their respective coefficients, l is the bias value, and  is the output value of the fuzzy logic system. The first layer of this model is responsible for the arrangement the inputs to the next layer. This layer consists of the membership functions (MFs) of the input variable. In addition, each node was defined as an independent function,
  =
=  where
where are MFs (Here, the output of the ith node in layer r is indicated as
  ).
).
| (3) |
 or,
or,
Where x1(x2) is the input through to node i and Pi ( ) is a linguistic label belonging to node i. Moreover,
  is the membership grade of a fuzzy set P. Tri-shaped MFs were defined as below:

The parameters a,b, and c specify the x coordinates of the corners of the underlying triangular membership function. For fuzzifying the inputs, three triangular membership functions are used as illustrated in figure 3. (For the case of K562 cell data).

Figure 3: Fuzzy membership functions for inputs
The second layer is responsible for allocating the weights for each of MF. In this layer, related signals are multipied as follows:
 | (5) |
The firing strength  of a rule is the definition that is represented by each node output.
Ruler layer is the name allocated for the third layer since rules are created in this layer. Each node in this layer computed normalized weights. Normalized firing strengths ( ) are calculated as follows:
 = =  | (6) |
In the fourth layer, based on the inference of the rules, Difuzzifying is applied. Then, outputs are computed as indicated below:
 | (7) |
In this layer, From layer 3 is utilized.
  is the parameter set of this node. These linear parameters are identified by backpropagation and a least-squares estimation.
The final layer computes the output as the summation of all difuzzified input as represented below:
 | (8) |
In this mathematical model, the learning algorithm is used to specify the parameters in ANFIS. In this system, parameters getting the membership functions are determined by backpropagation learning and least mean square estimation is used to specify the consequent parameters (Babu & Suresh, 2013; Subramanian & Suresh, 2012; Verbeke et al., 2014).
In order to evaluate the performance of the results achieved by the fuzzy model, the coefficient of determination (R2), correlation coefficient, and root mean square error (RMSE) are employed. The data set consists of n data members indexed with y1, …, yn, and the predicted data are indexed with f1,…, fn. Then, the mean of observed data is calculated as follows:
 | (9) |
Total sum of squares can be caluclated as below:
 (10) (10) |
Sum of squared residuals are as below:
 (11)
(11)
Then, the coefficient of determination is obtained as follows:
 | (12) |
Root mean square error can be calculated as:
 (13)
(13)
Results
Numerical results (ANFIS)
In this mathematical model, based on utilizing the experimental data, rules are trained (for the case of K562 and Mia Paca2 cell data). In this study, 32=9 rules were created for the selected number and type of the membership functions. As a result, a total number of 3 parameters were optimized. In this system, some rules are as follows:
1. If (Frequency is in1mf1) and (Amplitude is in2mf1) then (SEPB is out1mf1) (1)
2. If (Frequency is in1mf1) and (Amplitude is in2mf2) then (SEPB is out1mf2) (1)
3. If (Frequency is in1mf1) and (Amplitude is in2mf3) then (SEPB is out1mf3) (1)
4. If (Frequency is in1mf2) and (Amplitude is in2mf1) then (SEPB is out1mf4) (1)
5. If (Frequency is in1mf2) and (Amplitude is in2mf2) then (SEPB is out1mf5) (1)
6. If (Frequency is in1mf2) and (Amplitude is in2mf3) then (SEPB is out1mf6) (1)
7. If (Frequency is in1mf3) and (Amplitude is in2mf1) then (SEPB is out1mf7) (1)
8. If (Frequency is in1mf3) and (Amplitude is in2mf2) then (SEPB is out1mf8) (1)
9. If (Frequency is in1mf3) and (Amplitude is in2mf3) then (SEPB is out1mf9) (1)
The performance of this model for training is displayed in Figure 4 (A). This fuzzy model was designed to predict the SEPB in different applied electric fields and frequencies. The sensitivity of the parameters regarding achieved SEPB respectively is shown in Figure 4 (B). The results extracted from the fuzzy model are displayed. The result is displayed by a color bar placed at the right hand of each graph. As it is clear, the results shown are only the reagent of real SEPB, not accurate results. Therefore, higher numbers in the color bar are the meaning of higher SEPB in real conditions.

Figure 4: (A): Comparison of theoretical and experimental results for the training results. B) Results achieved by ANFIS for K562 cell type
The obtained results show the binary effects of the parameters, including electric field specifications on SEPB. For instance, it can be seen from figure 4 (B) that using a simultaneously applied electric field higher than 100 and frequency around 4.5 leads to higher SEPB. The correlation coefficients for the results of the ANFIS model are computed as illustrated in Tables 2 (A) and (B), and RMSEs are equal to 0.305 and 1.182 for K562 and Mia Paca2, respectively. As displayed in Figure 5 (A) and (B), this mathematical model showed an R2 = 0.99 and 0.86 for K562 and Mia Paca2, respectively. In addition, the comparison of the theoretical and the experimental results are displayed in Figures 5 (C) and (D).
Table 2: Correlation coefficients for created ANFIS model related to A) K562 cell type B) MIA-PACA2 cell type.
| A) K562 cell type | |||
| Electric Field | Frequency | SEPB | |
| Electric Field | 1 | -0.469 | 0.3959 |
| Frequency | -0.469 | 1 | -0.715 |
| SEPB | 0.3959 | -0.715 | 1 |
| B) MIA-PACA2 cell type | |||
| Electric Field | Frequency | SEPB | |
| Electric Field | 1 | 0.1727 | -0.595 |
| Frequency | 0.1727 | 1 | -0.352 |
| SEPB | -0.595 | -0.352 | 1 |

Figure 5A: K562 cell type
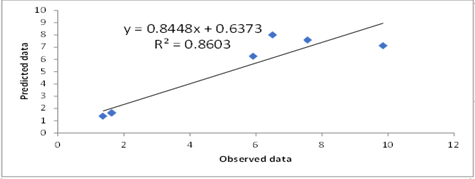
Figure 5B: MIA-PACA2 cell type.
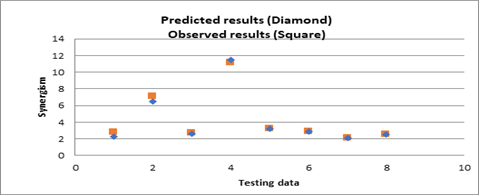
Figure 5C: K562 cell type

Figure 5D: MIA-PACA2 cell type
Figure 5 - R2 and Regression line for created ANFIS model related to A) K562 cell type B) MIA-PACA2 cell type. Comparing the theoretical and the experimental results to evaluate the fuzzy model related to C) K562 cell type and D) MIA-PACA2 cell type. The percent cell viability and relative synergism in combined treatments were the characteristics to compare the results. A relative synergism was computed as follows: “percent cell death from combined treatment divided by the sum of the cell death from individual treatment agents.” If a relative synergism is higher than 1, it indicates the additional effects of combined treatments in comparison with the sum of the individual effects of treatment agents. More synergism of therapeutic agents can be achieved by higher values of this ratio, leading tumor cell death or preventing cell proliferation. Regarding the three frequencies used in the current study, it can be seen from Figure 4 (B) that using simultaneously higher value of applied electric field (particularly, higher than 100) and lower frequency in the range (particularly, around 4.5) leads to higher SEPB.
Evaluation of the model
It is obvious that the model that is introduced with a higher R2 value is the better model in the prediction of the system’s behaviour. Based on the R2values achieved above, these values are strongly reliable for the prediction of the SEPB. Given the lack of enough testing data, a restricted number of the tests were considered, covering the entire of working range regarding the fuzzy model. Another reason that can be propounded is that the working range of the model is not wide, and the aim of this study is to prove that there is a relationship between the inputs and the output values. The validation of the efficacy of the model regarding the R2 and RMSE values was approved.
Discussion
The cell membrane has selective permeability, and this means that the cell membrane allows certain molecules to enter the cells. The cell membrane as an impermeable barrier is one of the most important controversial issues in treatments such as gene therapy chemotherapy. Therefore, this problem leads to a decrease in the effectiveness of such treatments. However, there are several physical and chemical approaches to the problem of cell permeability. Chemical methods have some controversial issues, such as the impracticality of all impermeable molecules and all types of cells. In addition, this procedure usually involves changing the specifications of the molecules to be transferred. In addition to the advantages of electroporation, there are some limitations, including the unpleasant sensations that patients feel when high voltage is applied because high-amplitude electrical impulses induce muscle contractions that cause painful sensations. In this study, the limited amount of experimental data forced the authors to evaluate the mathematical model qualitatively rather than quantitatively, considering the entire working area. As may be clear, the scope of the model is not wide. Therefore, the purpose of this study is to find out and accept that there is a significant relationship between the input and output parameters. For example, Fig. 4(B) shows that when an electric field greater than 100 and a cycle frequency of 4.5 are used simultaneously, a higher SEPB is obtained.
Conclusion
Using experimental data, a fuzzy model was trained by the ANFIS learning algorithm. This model was employed to describe the SEPB. The results of the current study showed that the high R2 by the model was mentioned. It seems that the model is strongly reliable for prediction. With the help of this model, the prediction of SEPB can be possible in different applied electric fields and different frequencies. Based on the aim of this study, there is a good relationship between the inputs and the output values regarding the fuzzy model. This mathematical approach for prediction is proposed in the field of electrochemotherapy to save time and money.
List of abbreviations
ANFIS Adaptive Neuro-Fuzzy Inference System
ECT Electrochemotherapy
EP Electroporation
HFLV Higher Repetition Frequency and Low Voltage
R2 Coefficient of determination
RMSE Root Mean Square Error
SEPB Synergism between EP and Bleomycin
Declarations
Declaration of Competing Interest
The authors declare that they have no known competing financial interests or personal relationships that could have appeared to influence the work reported in this paper.
Funding Sources
This research did not receive any specific grant from funding agencies in the public, commercial, or not-for-profit sectors.
Authorship Statement
Salim Mirshahi: Software, Data Curation, Conceptualization, Writing - Original Draft, Writing - Review & Editing. Neshat Mirshahi: Formal analysis, Writing - Original Draft, Investigation, Software. Sepideh Mirshahi: Methodology, Writing - Original Draft. Kiarash Arayana: Methodology, Writing - Review & Editing, Resources. Anita Farzaneh Far: Writing - Review & Editing, Resources. Ameneh Sazgarnia: Project administration, Supervision, Writing - Review & Editing.
References
- Babu, G. S., & Suresh, S. (2013). Meta-cognitive RBF network and its projection based learning algorithm for classification problems. Applied soft computing, 13(1):654-666.
Publisher | Google Scholor - Fang, Y., & Chow, T. W. (1999). Blind equalization of a noisy channel by linear neural network. IEEE transactions on neural networks, 10(4):918-924.
Publisher | Google Scholor - Gothelf, A., Mir, L. M., & Gehl, J. (2003). Electrochemotherapy: results of cancer treatment using enhanced delivery of Bleomycin by electroporation. Cancer treatment reviews, 29(5):371-387.
Publisher | Google Scholor - Hilberg, W. (1969). From approximations to exact relations for characteristic impedances. IEEE Transactions on Microwave Theory and techniques, 17(5):259-265.
Publisher | Google Scholor - Kim, K., & Lee, W. G. (2017). Electroporation for nanomedicine: a review. Journal of Materials Chemistry B, 5(15):2726-2738.
Publisher | Google Scholor - Kotnik, T., Frey, W., Sack, M., Meglič, S. H., Peterka, M., et al. D. (2015). Electroporation-based applications in biotechnology. Trends in biotechnology, 33(8):480-488.
Publisher | Google Scholor - Kotnik, T., Rems, L., Tarek, M., & Miklavčič, D. (2019). Membrane electroporation and electropermeabilization: mechanisms and models. Annual review of biophysics, 48:63-91.
Publisher | Google Scholor - Lebar, A. M., Troiano, G. C., Tung, L., & Miklavcic, D. (2002). Inter-pulse interval between rectangular voltage pulses affects electroporation threshold of artificial lipid bilayers. IEEE transactions on nanobioscience, 1(3):116-120.
Publisher | Google Scholor - Li, J., Mei, C., Xu, W., & Qian, Y. (2015). Concept learning via granular computing: a cognitive viewpoint. Information Sciences, 298:447-467.
Publisher | Google Scholor - Miklavčič, D., Pucihar, G., Pavlovec, M., Ribarič, S., Mali, M., et al. (2005). The effect of high frequency electric pulses on muscle contractions and antitumor efficiency in vivo for a potential use in clinical electrochemotherapy. Bioelectrochemistry, 65(2):121-128.
Publisher | Google Scholor - Mir, L. M. (2006). Bases and rationale of the electrochemotherapy. European Journal of Cancer Supplements, 4(11):38-44.
Publisher | Google Scholor - Mirshahi, S., & Rajabi, O. (2018). A Mathematical Model Based on an Adaptive Neuro-Fuzzy Inference System for Matrixes Including Indomethacin. J Appl Pharm, 9(58):1-6.
Publisher | Google Scholor - Mirshahi, S., Vahedi, B., Aryana, K., & Sazgarnia, A. (2024). Cancerous cell viability affected by synergism between electric pulses and a low dose of silver nanoparticle: An adaptive neuro-fuzzy inference system. Medicine in Novel Technology and Devices, 21, 100280.
Publisher | Google Scholor - O’Brien, T. J., Bonakdar, M., Bhonsle, S., Neal, R. E., Aardema Jr, et al. (2018). Effects of internal electrode cooling on irreversible electroporation using a perfused organ model. International Journal of Hyperthermia, 35(1):44-55.
Publisher | Google Scholor - Pucihar, G., Mir, L. M., & Miklavčič, D. (2002). The effect of pulse repetition frequency on the uptake into electropermeabilized cells in vitro with possible applications in electrochemotherapy. Bioelectrochemistry, 57(2):167-172.
Publisher | Google Scholor - Qiu, J., Ma, M., & Wang, T. (2020). Event-triggered adaptive fuzzy fault-tolerant control for stochastic nonlinear systems via command filtering. IEEE Transactions on Systems, Man, and Cybernetics: Systems, 52(2):1145-1155.
Publisher | Google Scholor - Ringel-Scaia, V. M., White, N. B., Lorenzo, M. F., Brock, R. M., Huie, K. E., et al. (2019). High-Frequency Irreversible Electroporation (H-FIRE) is an Effective Tumor Ablation Strategy that Induces Immunologic Cell Death and Promotes Systemic Anti-Tumor Immunity. Elucidating the Role of Pattern Recognition Receptors in Understanding, Treating, and Targeting Cancer, 132.
Publisher | Google Scholor - Rols, M.-P., & Teissié, J. (1998). Electropermeabilization of mammalian cells to macromolecules: control by pulse duration. Biophysical journal, 75(3):1415-1423.
Publisher | Google Scholor - Ruarus, A. H., Vroomen, L., Puijk, R., Scheffer, H., Zonderhuis, B., Kazemier, G., van den Tol, M., Berger, F., & Meijerink, M. (2018). Irreversible electroporation in hepatopancreaticobiliary tumours. Canadian Association of Radiologists Journal, 69(1):38-50.
Publisher | Google Scholor - Shankayi, Z., Firoozabadi, S., & Hassan, Z. S. (2014). Optimization of electric pulse amplitude and frequency in vitro for low voltage and high frequency electrochemotherapy. The Journal of membrane biology, 247, 147-154.
Publisher | Google Scholor - Shankayi, Z., & Firoozabadi, S. M. (2012). Antitumor efficiency of electrochemotherapy by high and low frequencies and repetitive therapy in the treatment of invasive ductal carcinoma in Balb/c Mice. Cell Journal (Yakhteh), 14(2):110.
Publisher | Google Scholor - Shankayi, Z., Firoozabadi, S. M., & Hassan, Z. M. (2010). The effect of rectangular electric pulse number in electrochemotherapy by low voltage and high frequency on breast tumors in Balb/c mice. Cell Journal (Yakhteh), 12(3):381-384.
Publisher | Google Scholor - Shankayi, Z., Firoozanadi, M., & Hassan, Z. (2012). Comparison of low voltage amplitude electrochemotherapy with 1 Hz and 5 kHz frequency in volume reduction of mouse mammary tumor in Balb/c mice. Koomesh, 13(4).
Publisher | Google Scholor - Subramanian, K., & Suresh, S. (2012). A meta-cognitive sequential learning algorithm for neuro-fuzzy inference system. Applied soft computing, 12(11):3603-3614.
Publisher | Google Scholor - Tajani, A. S., Haghighizadeh, A., Soheili, V., Mirshahi, S., & Rajabi, O. (2017). In vitro bioequivalence study of 8 generic and 3 brands of sertraline-HCl tablets in Iran market. Biomedical and Pharmacology journal, 10(3):1109-1116.
Publisher | Google Scholor - Verbeke, W., Martens, D., & Baesens, B. (2014). Social network analysis for customer churn prediction. Applied soft computing, 14, 431-446.
Publisher | Google Scholor - Županič, A., Ribarič, S., & Miklavčič, D. (2007). Increasing the repetition frequency of electric pulse delivery reduces unpleasant sensations that occur in electrochemotherapy. Neoplasma, 54(3):246-250.
Publisher | Google Scholor