Research Article
Pathophysiology of Heart Failure with Preserved Ejection Fraction
- Trainini Jorge 1
- Mayra Patricia Hernández López 2*
- Bastarrica María Elena 3
- Trainini Alejandro 1
- Valle Cabezas Jesús 4
- Carreras Costa Francesc 5
- David Viladés Medel 5
- Lowenstein Jorge 6
- Mora Llabata Vicente 7
- García Fernández Miguel Angel 8
1President Perón Hospital, Buenos Aires, Argentina. National University of Avellaneda, Argentina.
2Specialized Heart Diagnostic Center, MAC Hospital, Irapuato, Guanajuato, Mexico.
3University Cardiologist. Ministry of Health, Argentina.
4Naval Engineer, National Institute of Aerospace Technology, General Sub directorate of Naval Systems, Madrid, Spain.
5Co-Director of the Cardiac Imaging Unit, Clínica Creu Blanca, Barcelona. Honorary director of the Cardiac Imaging Unit. Hospital de la Santa Creu i Sant Pau, Barcelona. CIBERTCV-ISCIII-ELEM Biotech, Spain.
6Medical Research Institute, Buenos Aires, Argentina.
7Dr Peset Hospital, Valencia, Spain.
8Complutense University, Madrid, Spain.
*Corresponding Author: Mayra Patricia Hernández López, Specialized Heart Diagnostic Center, MAC Hospital, Irapuato, Guanajuato, Mexico.
Citation: Jorge T., López M. P. H., Elena B. M., Alejandro T., Jesús V. C., et al. (2024). Pathophysiology of Heart Failure with Preserved Ejection Fraction, Journal of Clinical Cardiology and Cardiology Research, BioRes Scientia Publishers. 3(2), 1-8. DOI: 10.59657/2837-4673.brs.24.029
Copyright: © 2024 Trainini Jorge, this is an open-access article distributed under the terms of the Creative Commons Attribution License, which permits unrestricted use, distribution, and reproduction in any medium, provided the original author and source are credited.
Received: March 22, 2024 | Accepted: May 01, 2024 | Published: May 10, 2024
Abstract
Background: Identify the relationship between the parameters that determine the deterioration of the protodiastolic phase of left ventricular suction with heart failure with preserved ejection fraction.
Material and Methods: Group I: Ten patients without heart disease; Group II: Ten patients with heart failure and preserved ejection fraction. Sinus rhythm in all. Doppler echocardiography was analysed: Cardiac cycle (ms); Left ventricular systole (ms); Protodiastolic phase of left ventricular myocardial contraction (ms); Left ventricular diastole (ms); Right ventricular systole (ms); Protodiastolic phase of right ventricular myocardial contraction (ms); Right ventricle diastole (ms); Relative wall thickness (%); Left ventricular mass (g/m2); Ratio E/E´; Left ventricular ejection fraction (%); Volume left atrium (ml/m2); Pulmonary arterial pressure (mmHG); Left ventricular end-systolic volume (ml).
Results: In all patients in the Group II there is a longer time of the protodiastolic phase of myocardial contraction of the left ventricle: 134 ms, compared to the group without heart disease (Group I): 83ms (p<0.01). An increase in left ventricular mass was found in Group II with an average of 106 gr/m2 in relation to the normal group (67 gr/m2) (<0.01); Relative wall thickness, which went from 0.33% to 0.49% (<0.01) and left atrial volume, which reached 43 ml/m2 for a control group value of 19 ml/m2 (<0.01).
Conclusion: The mechanism of heart failure with preserved ejection fraction is mainly due to left ventricular suction dysfunction, excessively prolonged during the protodiastolic phase, compared to the control group, which would lead to increased pressures filling of the cardiac chambers.
Keywords: heart failure; cardiac suction; myocardium; protodiastolic phase
Introduction
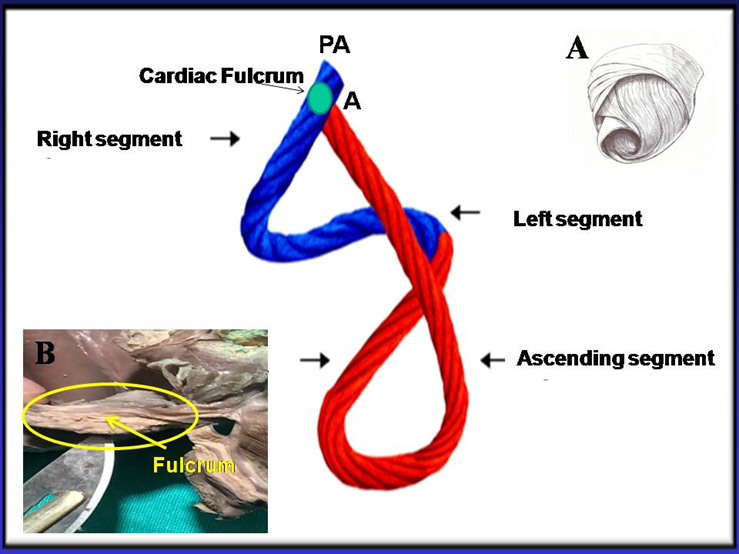
In the traditional model, cardiac filling is only determined by venous pressure. Actually, atrial pressure is too low to explain this situation. Based on this “key doubt” in relation to the classical explanation, the concept of active suction pump was developed, mechanically supported by the helical organization of cardiac myocardial fibers and their electromechanical activation sequence (Figure 1) [1].
Figure 1: Cord model of the helical myocardium that simplifies the spatial structure. It illustrates the different segments forming this structure. In blue: Basal loop. In red: Apical loop. PA. Position of the pulmonary artery; A: Position of the aorta. A: The helical myocardium is detailed. B: the cardiac fulcrum (myocardial support) is observed in a human heart of cartilaginous histology.
The results of previous investigations [2-5] led us to consider that cardiac function consists of three essential phases. According to our investigations between systole (300 ms) and diastole (400 ms) a contraction phase is inserted with an average duration of 83 ms in the left ventricle (LV) and 30 ms in the right ventricle (RV), which represents a coupling between the two and produces the protodiastolic phase of myocardial contraction (PPMC), with ventricular contraction and energy consumption [6]. The suction produced in the PPMC cannot be explained by a passive mechanism, given the low gradients attained at the atria input, and should be considered as a key element to facilitate venous return in complementarity with the systolic impulse of the opposite ventricle.
This suction in the PPMC, due to the low gradients attained at the atrial entry, must be considered the fundamental element for venous return in complementarity with the systolic impulse. This is supported by the subatmospheric pressures (“depressions”) recorded in these chambers during the PPMC. The driving role of the atria (“atrial kick”) is minimal. Its power is 1% relative to that of the ventricle. Obviously, this low gradient is related with a need for active ventricular suction [1,7]. Since a variation in the ventricular suction mechanism could be an initial, even subclinical, stage of ventricular dysfunction, the aim of this analysis has been to identify whether there is a relationship between the parameters that determine left ventricular protodiastolic phase of myocardial contraction (LVPPMC) impairment and heart failure with preserved ejection fraction (HFpEF). This should be categorized with an ejection fraction above 50%, with still not well-known underlying mechanisms for the initiation and development of this type of heart failure.
Material and Methods
The study population consisted of two groups (Table 1).
Table 1: Echocardiographic values.
| Phase | Group I (normal (n:10) | Group II HFpEF (n:10) | P Value |
| Cardiac cycle (ms) | 783 ± 129 | 872 ± 155 | 0.05 |
| Left ventricular systole | 346 ± 44 | 370 ±87 | 0.05 |
| LVPPMC (ms) | 83 ± 16 | 134 ±19 | 0.01 |
| Left ventricular diastole (ms) | 354 ± 111 | 377 ± 129 | 0.05 |
| Right ventricular systole | 297 ± 25 | 325 ± 76 | 0.05 |
| RVPPMC (ms) | 30.8 ±5 | 28.10 ± 10 | 0.05 |
| Right ventricular diastole (ms) | 349 ± 110 | 387 ±117 | 0-05 |
| RWT (%) | 0.33 ±0.03 | 0.49 ± 0.06 | 0.01 |
| LVM (gr/m2) | 67.3 ± 13.33 | 106.3 ± 25.21 | 0.01 |
| E/E’ ratio | 6.38 ± 1.45 | 16.13 ± 6.47 | 0.01 |
| LVEF (%) | 62 ± 3.5 | 64 ± 5 | 0.05 |
| LAV (ml/m2) | 19.2 ± 4.07 | 43.9 ± 14.60 | 0.01 |
| PAP (mmHg) | 22.7 ± 6.76 | 32.9 ± 15.89 | 0.08 |
| Left ventricular end-systolic volume (ml) | 32.8 ± 7.84 | 25.6 ± 12.67 | 0.05 |
References:ms: milliseconds; LVPPMC: Left ventricular protodiastolic phase of myocardial contraction; RVPPMC: Right ventricular protodiastolic phase of myocardial contraction; RWT: relative wall thickness; LVM: Left ventricular mass; LVEF: Left ventricular ejection fraction; LAV: Left atrial volume; PAP: Pulmonary artery pressure.
Group I: ten (10) patients (5 male, 5 female) without heart disease, with average age of 72.7 years and body surface area of 1.80 m2.
Group II: ten (10) patients (6 female, 4 male) with heart failure and HFpEF, with average age of 81.1 years and body surface are of 1.86 m2.
Patients provided their informed consent for this study and the investigation was previously approved by the Ethics Committee. All patients were in sinus rhythm with electrocardiograms that showed no abnormality. They were studied with Doppler echocardiography (Vivid IQ Premium ultrasound system). The variables analyzed were: Cardiac cycle (ms); Left ventricular systole (ms), LVPPMC (ms); Left ventricular diastole (ms); Right ventricular systole (ms), RVPPMC (ms); Right ventricular diastole (ms); Relative wall thickness (%); Left ventricular mass (LVM) (gr/m2); E/E’ ratio; Left ventricular ejection fraction (%); Left atrial volume (LAV) (ml/m2); Pulmonary artery pressure (PAP) (mmHg); and End-diastolic volume (ml).
Statistics
The descriptive characteristics of participants included in the study were analyzed using mean ± standard deviation or median ± interquartile range, according to their normal or non-normal distribution for continuous variables and with frequencies for categorical variables. The Shapiro-Wilk test was used to evaluate the normality of data distribution. Paired Student’s t test, linear regression or analysis of variance (ANOVA) were used for quantitative bivariate analysis, as appropriate, and Pearson’s chi-square test, Fisher´s exact test or logistic regression for the analysis of dichotomous variables. A two-tailed p<0>
Results
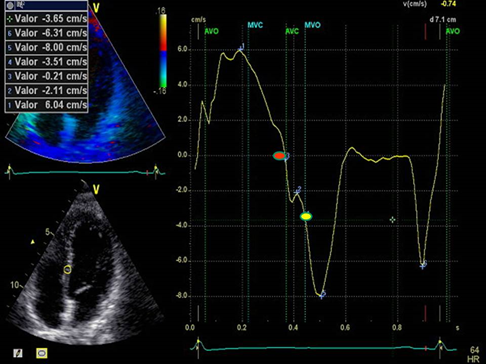
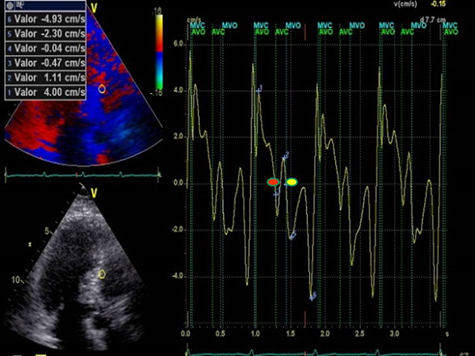
Table 1 shows the results of the echocardiographic variables in the two groups. It was seen that all patients with HFpEF (Group II) exhibited a more prolonged LVPPMC time: 134 ms, compared with the group without heart disease (Group I) lasting a significantly lower time: 83 ms (pLessthan0.01) (Table 2) (Figures 2 and 3), respectively.
Table 2: Relationship of percent left ventricular cardiac cycle, systolic and diastolic duration with respect to the protodiastolic phase of myocardial contraction.
| Phase | Group I (normal (n:10) | Group II HFpEF (n:10) |
| Systole / LVPPMC ratio (%) | 23 | 36 |
| Diastole / LVPPMC ratio (%) | 23 | 35 |
| Cardiac cycle / LVPPMC ratio (%) | 10 | 15 |
Figure 2: LVPPMC curve in a normal patient. The red dot indicates the beginning of the phase and the yellow dot its completion. Duration: 80 ms; left ventricular mass: 67 gr/m2; relative wall thickness: 0.33%.
Figure 3: LVPPMC curve in a patient with HFpEF. The red dot indicates the beginning of the phase and the yellow dot its completion. Duration 160 ms; left ventricular mass: 106 gr/m2; relative wall thickness: 0.49%.
Concomitantly, an increase of LVM was also found in Group II with an average of 106 gr/m2 compared with the normal group (67 gr/m2) (pLessthan0.01). Similarly, the relative wall thickness increased from 0.33% to 0.49% (pLessthan0.01) and LAV reached 43 ml/m2 for a control group value of 19 ml/m2 (pLessthan0.01). In this analysis (Table 1) it is clear that the cohort baseline values are different (pLessthan0.05 for all comparisons), with the HFpEF group exhibiting higher significant values for LVM, E/E’, PAP and LAV. Regarding total cardiac cycle, systolic and diastolic duration, the cohorts had similar baseline values (pgreaterthan0.05 for all comparisons), except for left ventricular suction time, which was higher in HFpEF patients (pLessthan0.01).
Discussion
Heart Failure with Preserved Ejection Fraction. A significant increase of LVPPMC time was found in Group II patients with HFpEF compared with the group without heart disease (Group I) (plessthan0.01). Moreover, in these cases the tissue strain curve loses its sharp slope and becomes irregular needing a more prolonged time to generate the necessary pressure difference to open the mitral valve. This variable correlates with the E/E’ ratio, since in Group I this was 6.38 compared with Group II that reached a value of 16.13 (plessthan0.01) (Table 1). We also observed that the diastolic duration (passive filling phase without energy consumption) was maintained with scant variation in the two groups (354 ms in the normal group vs. 377 ms in HFpEF), confirming that the altered suction mechanism occurring in the LVPPMC mainly participates of the dysfunctional process. The increase of LVM, relative wall thickness and LAV in Group II, all with plessthan0.01 significance, are measurements that corresponded with an increase of pulmonary artery pressure to 32 mmHg in group II compared with Group I with 22 mmHg (plessthan0.08). These concepts would explain why a pulmonary wedge pressure ≥15 mmHg or a left ventricular end-diastolic pressure ≥16 mmHg is found in HFpEF.
The possible interpretation is that as the left ventricular mass increases it does not reach suitable detorsion in a normal time to generate a drop in pressure with adequate slope to open the mitral valve. Regarding the increase in LAV, it must be understood that the atria are volume compensatory chambers that avoid ventricular overload. This increased LAV in HFpEF patients should be considered as a deficit of left ventricular suction, and is probably a mechanism to reduce the increase in wall tension and prevent a significant increase of atrial pressure. This observation, present in all the patients with this pathology, is clinically accompanied by dyspnea at rest or during exertion. In the LV, evection fraction and end-systolic volume are normal in both groups, implying that the altered values corresponding to the LVPPMC are indicating the moment of the cardiac cycle where the pathophysiological change occurs. The left ventricular cardiac cycle, systolic, PPMC and diastolic durations were measured in both groups. The data collected (Table 2) is coherent with the investigation findings, showing that in patients with HFpEF, LVPPMC duration is prolonged in relation to the total cardiac cycle, systole and diastole, where similar values are present in both groups. This would demonstrate the possibility that patients with HFpEF evidence their problem in the LVPPMC, as it needs a longer time to achieve an adequate intraventricular pressure to open the mitral valve.
Protodiastolic Phase of Myocardium Contraction
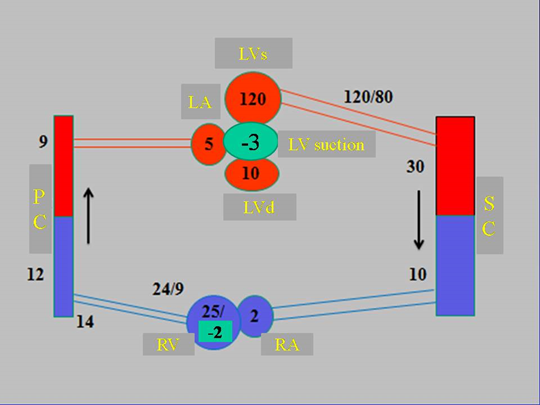
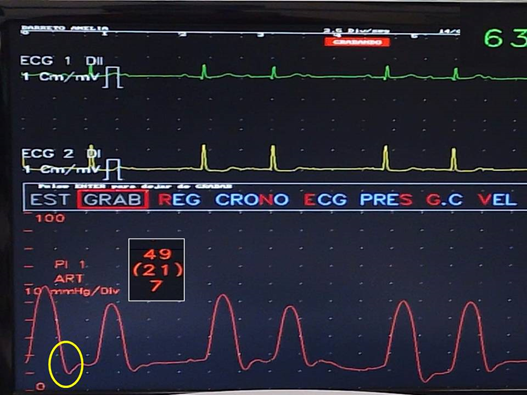
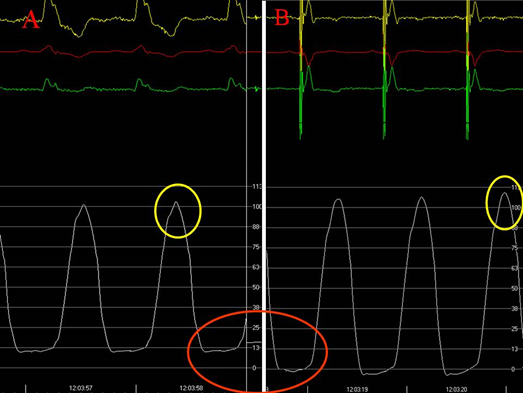
In the circulatory cycle, there is only one period that attains negative pressure in ventricular chambers at a defined moment. This phenomenon is only produced during the PPMC in which pressure drops to -3mmHg, according to our measurements in patients undergoing three-dimensional electroanatomic mapping (3D-EAM) and a resynchronization procedure (Figure 4) [1,8].
Figure 4: Diagram of the circulatory system with pressure values throughout its course. Pressures are expressed in mmHg. References: LVs: LV in systole; LA: left atrium; LVd: LV in diastole; PC: pulmonary capillary; RV: right ventricle; RA: right atrium; SC: systemic capillary.
This phase is active and isovolumic. Between aortic valve closure and mitral valve opening and hence, between pulmonary valve closure and tricuspid valve opening, there is a sudden drop of intraventricular pressure with energy consumption that may reach negative values. It is during this phase that the muscle contraction of the final portion of the ascending segment in its insertion into the cardiac fulcrum –myocardial support- elicits myocardial lengthening-detorsion with the ventricular chambers closed [9]. This contraction of the septum, as it is of ventricular interdependence, determines, as we shall see, the PPMC in both ventricles. Thus, the post systolic contraction of the ascending segment at the septal level implies ventricular wall lengthening with concomitant detorsion in both chambers, producing the PPMC suction phase. This physiological action is the cause of the drop in intraventricular pressure (“depression”) capable of reaching negative values in both the RV and LV (Figures 5 and 6).
Figure 5: Right ventricle recording. The drop in intraventricular pressure during the RVPPMC is observed in one patient (yellow circle).
Figure 6: Left intraventricular pressure with resynchronization therapy. A. Resynchronization device turned off. B. In the same patient, a drop in left ventricular diastolic pressure is observed after resynchronization is restarted. 1) The yellow circle points out the increase of systolic arterial pressure in B with respect to A. 2) The red circle shows the negative intraventricular pressure in B.
After semilunar valves closure, the time the PPMC lasts depends on the pressure drop required to open the atrioventricular valves. And this implies, in addition to the corresponding circuit with its set of pressures, a faculty of the intrinsic muscular state of the myocardium to achieve the necessary detorsion in the generation of the intraventricular pressure drop. The RV suffers less from the functional decrease in the PPMC as its wall has half the thickness and one sixth of the hemodynamic values of the LV, in addition to being less exposed to myocardial hypertrophy. We have seen it in echocardiographic studies of patients with HFpEF who presented myocardial hypertrophy.
Interpretation
Historically, the ventricular expansion process has not had the thorough analysis it deserves, the real meaning of diastolic filling being ignored in the physiological mechanism. In this regard, only systole has been given the category of being an active phase, with muscle contraction and energy consumption. As expressed so far, how should we refer to diastolic filling? As cause or consequence of the expansion? As a result, would it be produced by venous pressure or by an active mechanism of myocardial suction? Traditionally, venous pressure has been considered the cause of atrioventricular valve opening. However, the maximum pressure that occurs at the aorta and pulmonary artery outlet decreases constantly until minimum values are reached at the atrial entry. Here a necessary reflective point opens: can the RV have a suction phase despite having half the thickness of the LV? Let us recall that the relationship of pressure and resistance between the LV and RV is 6:1, that is, the RV is proportional to 15% of the LV. In the face of a lower resistance, the pulmonary valve in relation to the force to which it is subjected, opens before the aortic valve [4,10], which is fundamental in the complementarity of the ventricles in a dynamic interaction between ejection and suction.
The suction phenomenon appears as a necessary element, as its lack in both ventricles would stop flow at the slightest difficulty. Thus, this investigation indicates that the ventricles cannot be studied independently, but rather, both the systemic and pulmonary circuits should be analyzed with the intervention of both chambers, exploring both impulse and suction and, what is even more important, their synchronization, whose causes could be due to both the interrelated sequence in muscle activation and pressure variations in the circuits. The spatial arrangement of the continuous helical myocardium clearly indicates that the propulsion is given by the ventricular cavity walls that define this structure. Formed by two loops, basal (right and left segments) and apical (descending and ascending segments), the muscular unit they constitute are the walls of the ventricles, to which it provides propulsion power [7,9]. It is not the ventricles, mere cavities, that display this action but their muscular walls that make up the helical continuity of the myocardium as a single mass and that give it its leading role. The atria are outside this morphology and therefore lack adequate walls to propel their contents; they have a reservoir function and act as decompression chambers for the sharp blows produced by the sudden closure of the atrioventricular valves.
In the classical concept, there was only one active function in each ventricle, systole, with a positive pressure that determined it was the cause of venous return. This is not justified with what has been observed; on the contrary, venous pressure is fundamentally a consequence and not a cause of ventricular expansion, according to the values of the pressure gradient displayed by the venous circuit. This fact is supported by observing the moment in the PPMC in which the filling pressure, both in the systemic and pulmonary circuits, tends to have a suction action.
The pressure of the circulatory circuit decreases from the aorta to the venous end. This drop in pressure determines a very low venous pressure, with a mean value between 0 and 2 mmHg in the venae cavae], so it is expressed in cm of water. The ventricles, made up of resistant muscles, do not expand with low venous pressure and much less due to atrial contraction, with their very thin walls, which also lack an adequate structure to prevent blood backflow. Venous pressure is not the cause of ventricular expansion but its consequence. As deduced from our investigations, we must admit that blood entering the ventricles is the result of suction due to the contraction of both ventricular walls during the PPMC. A fluid moves along a tube in response to a pressure gradient. Therefore, the pressure gradient must be greater than 10 mmHg to generate flow, due to energy losses in the system. When the vascular duct lacks this gradient, flow ceases. This is called “critical closing pressure”.
Blood pressure fluctuates around a mean value of 90 mmHg. Pulmonary pressures have an average of 22/8 mmHg with a mean pressure of 13 mmHg. On the other hand, the pressure difference between the pulmonary capillaries and the left atrium is 4-6 mmHg. Thus, a low-pressure gradient allows the same amount of blood to pass through the pulmonary circuit as through the general circuit, which has a gradient of 90 mmHg, due to the complementarity between ejection and suction energies. In addition, the power of the left atrium is only 1% that of the LV, so noticeable effects as pump function cannot be expected from it. The left atrium distends in the face of a LV suction deficit, but no notable effects of flow impulse can be expected. Obviously, this low gradient could not generate a sudden ventricular filling without the need for active ventricular suction [4]. As explained, this suction phase between systole and diastole lasts around 83 ms and is active in its muscle contraction with an intraventricular pressure drop below zero [1,5]. In echocardiographic studies, the duration of mean systolic strain between the systolic and post systolic phases is 88±7.1 ms analogous to the ascending segment activation times in the LVPPMC obtained in our investigation [2,3]. Tyberg [1], using mitral valve balloon occlusion in a dog, showed that during diastole the LV decreases its pressure below zero. As a result, the heart is a dynamic suction pump, but to be effective the elastic recoil must be limited to allow an effective subsequent systole.
Limitations
The fundamental drawback of this research is that it is based on an insufficient number of patients, and this study must continue with an increase in number.
Conclusions
Based on the results obtained, it can be interpreted that the HFpEF mechanism is mainly due to ventricular suction dysfunction, excessively prolonged during the LVPPMC, compared with control groups. This would increase the filling pressures of cardiac chambers with the ensuing dyspneic symptomatology characteristic of these patients.
Abbreviations
LV: left ventricle; RV: right ventricle; PPMC: protodiastolic phase of myocardial contraction; LVPPMC: left ventricular protodiastolic phase of myocardial contraction; HFpEF: heart failure with preserved ejection fraction; LVM: left ventricular mass; LAV: left atrial volume; PAP: pulmonary artery pressure; 3D-EAM: three-dimensional electroanatomic mapping
Declarations
Authors’ contributions
Trainini Jorge: Project director; Mayra Patricia Hernández López: Echocardiography; Trainini Alejandro: Anatomy; Bastarrica María Elena: Cardiology; Valle Cabezas Jesús: Cardio mechanics
Carreras Costa Francesc: Cardiology; David Viladés Medel: Statistics; Lowenstein Jorge: Echocardiography; Mora Llabata Vicente: Cardiology
García Fernández Miguel Angel: Cardiology
Availability of data and materials
Not applicable.
Financial support and sponsorship
None.
Conflicts of interest
All authors declared that there are no conflicts of interest.
Ethical approval and consent to participate
Not applicable.
Consent for publication
Not applicable.
References
- Buckberg GD, Coghlan HC, Torrent Guasp F. (2001). The structure and function of the helical heart and its buttress wrapping. V. Anatomic and physiologic considerations in the healthy and failing heart. Sem Thorac Cardiovasc Surg, 132:358-385.
Publisher | Google Scholor - Trainini JC, Elencwajg B, López-Cabanillas N, Herreros J, Lago N. (2015). Electrophysiological Bases of Torsión and Suction in the Continuous Cardiac Band Model. Anat Physiol, 5:S4-001.
Publisher | Google Scholor - Trainini JC, Elencwajg B, López-Cabanillas N, Herreros J, Lowenstein J, et al. Ventricular torsion and cardiac suction effect: The electrophysiological analysis of the cardiac band muscle. Interventional Cardiol 2017, 9 (1), 45-51.
Publisher | Google Scholor - Hyun Suk Yang HS, Mookadam F, Khandheria BK, Chandrasekaran K. (2022). Torsion and segmental rotation of the right ventricle in normal subjects on 2D speckle tracking echocardiography. Ultrasonido Clínico; 7(2): 95-102.
Publisher | Google Scholor - Trainini JC, Lowenstein JA, Beraudo M, Mora Llabata V, Carreras-Costa F, et al. (2022). Fulcrum and Torsion of the Helical Myocardium. Editorial Biblos, Buenos Aires.
Publisher | Google Scholor - Trainini J, Beraudo M, Wernicke M, Lowenstein J, Carreras-Costa F, et al. (2021). Physiology of the Helical Heart. Int J Anat Appl Physiol. 7(5):195-204.
Publisher | Google Scholor - Torrent-Guasp F, Ballester M, Buckberg GD, Carreras F, Flotats A, et al. (2001). Spatial orientation of the ventricular muscle band: physiologic contribution and surgical implications. J Thorac Cardiovasc Surg, 122:389-92.
Publisher | Google Scholor - Elencwajg B, López-Cabanillas N, Cardinali EL, Barisani JL, Trainini J, et al. (2012). The Jurdham procedure endocardial left ventricular lead insertion via a femoral transseptal sheath for cardiac resynchronization therapy pectoral device implantation. Heart Rhythm, 9:1798-1804.
Publisher | Google Scholor - Trainini JC, Lowenstein J, Beraudo M, Wernicke M, Trainini A, et al. (2021). Myocardial torsion and cardiac fulcrum (Torsion myocardique et pivot cardiaque). Morphologie, 105:15-23.
Publisher | Google Scholor - Mangione S, Sullivan P, MD Michael Wagner MS. (2022). Physical diagnosis. Secrets. Elsevier Ed.
Publisher | Google Scholor

