Research Article
Palatability enhancement of Oral Rehydration Salt through 2-6μm Mid-infrared Ray Irradiation
1Veterinary hospital, Theni, Tamil Nadu, India.
2Veterinary hospital, Vadakupudhu Palayam, Erode, Tamil Nadu, India.
3Assistant Professor, Department of Botany, The Standard Fireworks Rajaratnam College for Women, Sivakasi, Virudhunagar (Dt), Tamil Nadu, India.
*Corresponding Author: Umakanthan T., Veterinary hospital, Theni, Tamil Nadu, India.
Citation: Umakanthan T, Madhu Mathi M., Umadevi U. (2024). Palatability enhancement of Oral Rehydration Salt through 2-6μm Mid-infrared Ray Irradiation. Scientific Research and Reports, BioRes Scientia Publishers. 1(1):1-9. DOI: 10.59657/2996-8550.brs.24.004
Copyright: © 2024 Umakanthan T, this is an open-access article distributed under the terms of the Creative Commons Attribution License, which permits unrestricted use, distribution, and reproduction in any medium, provided the original author and source are credited.
Received: January 26, 2024 | Accepted: February 09, 2024 | Published: February 16, 2024
Abstract
Oral rehydration salts (ORS) are used to balance the acute loss of ions and glucose which occurs due to diarrhoea and vomiting. ORS is generally unpalatable; hence acceptability is not full intention. For this reason, we want to enhance the palatability hence acceptable too. We developed a 2-6μm mid-infrared generating atomizer (MIRGA) and irradiated the ORS. In this research, we successfully potentiated the inherent characteristics of ORS using the safe and non-ionizing wavelength range (2-6μm mid-infrared rays). We also examined the effect of MIRGA on various changes and sensory attributes improvements of ORS, in particular chemical bonds, molecular and nanoparticle arrangement, morphology, etc. MIRGA technology was found to be safe, rapid and economical to potentiate the characteristics of ORS, thereby reducing the required dosage and enhancing palatability for eager consumption, hence rapid rehydration. This is discussed in detail.
Keywords: MIRGA; 2-6μm mid-infrared; oral rehydration salt; irradiation, potentiation ; palatability; enhancement; rehydration; safe; economy
Introduction
Composition of Oral rehydration salt (ORS) is Sodium chloride 13%, Glucose anhydrous 66%, Potassium chloride 7%, Trisodium citrate dihydrate 14%. ORS has saved the lives of millions of children with acute diarrhoea since 1978 (David, 2017). ORS is a first-line treatment for dehydration in children. Studies on the improvement of sensory attributes of ORS have varied outcome. However, the regularly used ORS are unpalatable hence reduced acceptance by children (Pieścik-Lech et al., 2012). Here, we subjected the marketed ORS to 2-6μm mid-infrared emitted from MIRGA and enhanced the sensory attributes hence palatability improved. The details are demonstrated here.
Materials
MIRGA (patent no.: 401387) is a 20 ml pocket sized atomizer (Supplementary file – figure F1) containing inorganic water-based solution in which approximately two sextillion cations and three sextillion anions are contained. During spraying, depending on pressure (vary with the user) applied to plunger, every spraying generates 2-6µm mid-IR. Design of the MIRGA and emission of 2-6µm mid-IR has been presented in detail by Umakanthan et al., 2022a; Umakanthan et al., 2022b; Umakanthan et al., 2023c; Umakanthan et al., 2023d. Every time spraying emits 0.06ml which contains approximately seven quintillion cations and eleven quintillion anions. (Details about MIRGA available in supplementary text T1). The inorganic compounds used in the generation of MIR are a perspective for biomedical applications (Tishkevich et al., 2019; Dukenbayev et al., 2019). It is also a new synthesis method for preparation of functional material (2-6 µm mid-IR) (Kozlovskiy et al., 2021; El-Shater et al., 2022). It is well known that the combination of different compounds, which have excellent electronic properties, leads to new composite materials, which have earned great technological interest in recent years (Kozlovskiy and Zdorovets, 2021; Almessiere et al., 2022). We have trialed commercially available ORS in India. Trained sensory expert panel (n=6) was employed to examine palatability.
Methods
MIRGA spraying is performed from 0.25 to 0.50 meter towards the sachet (polythene, paper) containing ORS (Method of MIRGA spraying in Supplementary file – video V1). This distance is essential for the MIRGA sprayed solution to form ion clouds, oscillation and mid-IR generation (see Discussion), which can penetrate the intervening sachet (Pereira et al., 2011; Prasad, 2005), act and modify the inside ORS’s chemistry favorably. Close-range spraying will not generate energy. Twelve experimental and one control ORS sachets were used. Experimental sachets were numbered 1, 2, 3, up to 12, and the sachets were sprayed with MIRGA. The sachets received the number of sprayings corresponding to their numbers, for example, sachet #1 received 1 spraying and sachet #2 received 2 sprayings and so on. After spraying, from each sachet a sample was taken and sensory testing done. The sensory panel experts rated samples using an acceptability index based on a hedonic scale with a 9-point nominal structure: 1 - Dislike extremely, 2 - Dislike very much, 3 - Dislike moderately, 4 - Dislike slightly, 5 - Neither like nor dislike, 6 - Like slightly, 7 - Like moderately, 8 - Like very much, 9 - Like extremely (Wichchuki et al., 2014; Everitt, 2009). The control and two sprayed (enhanced palatability), 6 sprayed (more enhanced palatability) and 12 sprayed (reduced palatability) samples were subjected to various instrumentations. Every trial was replicated using a specific marketed ORS brand. Neither different brand not batches were mixed and trailed. Input of extra energy (mid-IR) should naturally denature the target, here ORS. Hence, we used more sprayings (12) until ORS inherency was denatured. Instruments used study the changes were:
- Chemical compound transformation–Gas chromatography–mass spectrometry (GC-MS)–Agilent technologies, 7820 GC system, 5977E MSD, DB-5Column, over temp 100-270 ℃, Detector MS, Flow rate 1.2, Carrier gas Helium.
- Chemical bond changes–Fourier-transform infrared spectroscopy (FTIR)–JASCO FT-IR 4200 plus spectrophotometer with ATR (range 4000–400cm⁻¹ at 298 K).
- Structural changes–Powder x-ray diffraction (PXRD)–Rigaku RINT 2500 X-ray diffractometer (CuKα anode; λ=1.541 Ao). Samples scanned at 40kV and 30mA from 50-350 2θ values and analyzed using PDXL2 software (Rigaku).
- Configurational changes–Transmission electron microscopy (TEM)–FEI TechnaiSpirit G2, HT 120KV, Electron source LaB6, Netherlands.
- Nuclear resonances–Proton nuclear magnetic resonance (1H-NMR)–300MHz AVANCE II spectrometer with 5mm BBO probe, recorded at 298.15K using the standard pulse sequence library of TopSpin 3.2, data processed by TopSpin 3.2 software, of Bruker Biospin, Switzerland.
Results
Hedonic scoring
After MIRGA spraying the sensory attribute changes were sensed within 5 minutes. Six sprayings enhanced sensory attributes making the ORS more palatable but 12 sprayings reduced the palatability. In every trial, the samples used were from the same source, the difference among them is, only the number of sprayings they received (Table 1).
Table 1: Sensory profiling of oral rehydration salt samples
| No of sprayings | Sensory attributes | ||
| Sourness | Sweetness | Saltiness | |
| Control | 5 | 5 | 5 |
| 1 | 6 | 5 | 5 |
| 2 | 7 | 8 | 6 |
| 3 | 7 | 8 | 7 |
| 4 | 8 | 8 | 7 |
| 5 | 8 | 8 | 7 |
| 6 | 8 | 9 | 8 |
| 7 | 7 | 8 | 8 |
| 8 | 5 | 7 | 5 |
| 9 | 4 | 5 | 4 |
| 10 | 2 | 3 | 4 |
| 11 | 2 | 3 | 3 |
| 12 | 1 | 2 | 1 |
Instrumentation results (raw data of instrumentations in Supplementary file – Data D1).
Figure 1:GC-MS of oral rehydration salt samples
Control: shows numerous peaks.
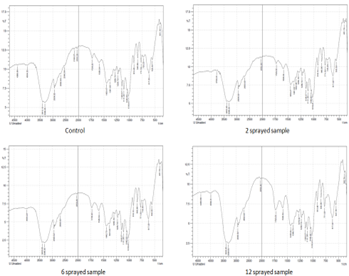
2 sprayed sample: The key differences between this sample and the control are missing peak at ~2.6 min, lower intensity peak at ~4 min, missing peaks at 7.9 min, 11.2 min, and an apparent reduced peak intensity at 16.7 min. These differences are related to slightly enhanced flavors of this sample compared to the control.
6 sprayed sample: The GCMS pattern is different than the control within the noise. The key differences are the missing peak around 7.9 min and 10 min. These changes are related to significantly enhanced flavors compared to the control.
12 sprayed sample: The GCMS pattern is different than the control pattern with the key difference as missing peak around 10 min. This change is related to reduced flavors than that in control. MIRGA spraying has increased the anti-oxidant properties (Rt min 3.22), the sugar (Glucose anhydrous) (Rt min 6.05), eliminated the plasticizers (Rt min 7.91 and 11.2) present in packing material and eliminating the Benzyl benzoate (Rt min 9.8) (Table 2).
Figure 2:FTIR of oral rehydration salt samples
Table 2: GCMS analysis of Oral rehydration salt samples
| Rt (min) | Name of compound | % Area present in each sample | Remarks | |||
| Control | 2 sprayed | 6 sprayed | 12 sprayed | |||
| 2.37 | Limonene | 1.92 | 3.46 | 8.60 | 6.61 | It is a suggested structure due to some characteristic fragments and chromatographic peak shape |
| 3.22 | 4H-Pyran-4-one, 2,3-dihydro-3,5-dihydroxy-6-methyl- | 10.38 | 30.70 | 6.5 | 24.49 | Natural compound with antioxidant properties |
| 4.0 | 5-hydroxymethyl furfural | 6.24 | ND | ND | 20.49 | |
| 6.05 | Possible sugar | 6.55 | 5.49 | 26.04 | 19.8 | |
| 7.91 | Diethyl phthalate | 8.03 | ND | ND | ND | plasticizer |
| 9.8 | Benzyl benzoate | 32.9 | 81.45 | ND | ND | Compound used as fragrance ingredient, artificial flavour, preservative and solvent |
| 11.2 | Dibuthyl phthalate | 17.5 | 3.71 | 2.18 | plasticizer | |
| 11.7 | Phthalic acid analogue | plasticizer | ||||
| 16.68 | Column bleeding | m/z=207 | ||||
| 16.8 | Phthalic acid analogue | ND | 3.16 | 0.0 | plasticizer | |
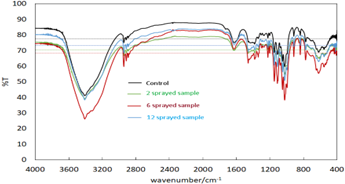
Control Sample: The broad signal in the range of 3200-3600cm-1, seen amongst others in the functional group region, is associated with the stretching vibration of O-H.
2 sprayed sample: There is no significant change in the fingerprint region compared to the control sample. In the functional group region however, in addition to a shift in the background signal, there is a signal drop of around 9% in the O-H stretching vibration at 3200-3600 cm-1, hence depreciating the O-H bond. (Tsai et al., 2017)
6 sprayed sample: There is no significant change in the fingerprint region compared to the control and 2 sprayed samples. In the functional group region however, in addition to a shift in the background signal, the signal shift in the O-H stretching (Alvarez et al., 2012) vibration at ~ 3200-3600cm-1 increases again such that in the 12 sprayed sample the signal is around 5% higher than the control sample.
12 sprayed sample: There is no significant change in the fingerprint region compared to the control and 2 sprayed samples. In the functional group region however, in addition to a shift in the background signal, the signal shift in the O-H stretching vibration at ~ 3200-3600cm-1 drops again such that it goes back to the same level as the control sample.
The average transmission signal drops as the sample goes to 2 and 6 number of sprayings, but it rises again at 12 sprayings. Therefore, the overall absorption by the sprayed samples in the mid-infrared spectrum is a mix and complex behaviour depending on the number of sprayings. The observed changes in the O-H stretching vibration, is interpreted as to the 6 sprayed sample being more favorable than the control, and the 2 sprayed and 12 sprayed samples being less favorable.
Figure 3: PXRD of oral rehydration salt samples
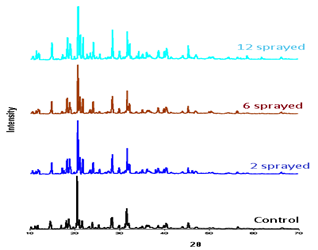
Patterns show samples are highly polycrystalline materials. Maximum intensity for each pattern is observed at 2θ: 20.60. The relative intensity of peaks at 2θ: 14.62; 18.74; 31.63 and 28.36 in two sprayed sample is greater than control sample. In six sprayed sample these increases are slight; the highest increase is observed in 12 sprayed sample. These intensities increments are due to the atomic increase in the diffraction planes by molecular rearrangement(Xu et al., 2017) (Table 3).
Figure 4: HR-TEM of oral rehydration salt samples
Table 3: PXRD analysis of ORS
| Relative intensity (I/Imax) % | ||||
| 2θ | Control | 2 sprayed | 6 sprayed | 12 sprayed |
| 14.62 | 15 | 22 | 22 | 32 |
| 18.74 | 20 | 30 | 33 | 41 |
| 20.60 | 100 | 100 | 100 | 100 |
| 31.63 | 39 | 48 | 47 | 53 |
| 28.36 | 23 | 38 | 37 | 56 |
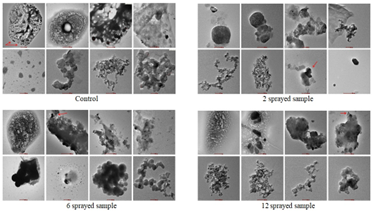
Control: Some particles are foam like with evident hole. Aggregates diameter ranges 200–700 nm. Nanoparticle’s size is homogeneous within the same cluster. Three clusters of nanoparticle sizes are 40–50 nm, 70–80 nm, and 10–20 nm.
2 sprayed sample: Surface morphology and shapes of aggregates are partially different from control, particularly sponge-like. Also surface extension of aggregates is lower, sample matrix is partially preserved. Nanoparticles size range is 10–40 nm. Crystals present, hexagonal particles also present having regularly sized sides: shorter sides range 140–180 nm, while longer one’s range 200–300 nm.
6 sprayed sample: Surface morphology similar to 2 sprayed sample, surface extension of aggregates is far lower than in control and 2 sprayed samples; aggregates are twenty times lower than in 2 sprayed sample. Amorphous-shaped aggregate type small dark areas are visible. Semi-spherical particles 700–800 nm observed. Nanoparticles are observed in two different arrangements: one in clusters and the other as individual particles. Nanoparticles in the chain-like cluster ranged 10–30 nm and 40–80 nm and nest-like cluster ranged 10–100 nm.
12 sprayed sample: Shows peculiar features, ellipsoidal particles 0.3–1.2 µm and 0.2–1 µm, flat fragments in aggregates, which is a possible ongoing process of crystallization due to the MIRGA spraying. Nanoparticles ranged (from left to right of bottom images): 10–50nm, 10–20nm, 10–50nm, 50–70nm.
Spraying changed the sample matrix structure and surface morphology of the aggregates and of particles in the micrometer scale while there were minor changes concerning the nanoparticulate fraction (Esmaeili, 2015). Micrometer particles absent in control, but observed in sprayed samples. Compared to the control, surface morphology and the area of large aggregates are found to have altered by spraying and are comparable among the MIRGA sprayed samples specifically concerning the surface morphology. One exception to this trend is the 12 sprayed sample. This one had amorphous-shaped peculiar flat fragments which were not observed in the 2 and 6 sprayed samples. Similarly, sub-micrometer aggregates observed in the control were absent in the sprayed samples.
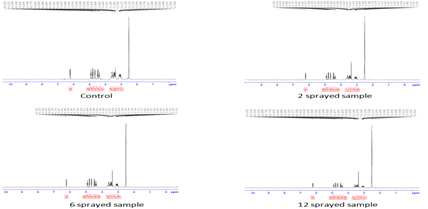
Figure 5:1H-NMR of oral rehydration salt sample
The objective of this analysis is to highlight differences in the spectra of the samples relative to the control (Tab 4).
Table 4: NMR shifts (ppm)
| Control | 2 sprayed | 6 sprayed | 12 sprayed | Typical Assignment |
| 6.2 (doublet) | 6.2 (doublet) | 6.2 (doublet) | 6.2 (doublet) | PhOH, Amide RCONH, Aromatics |
| 4.9 (triplet) | 4.9 (triplet) | 4.9 (triplet) | 4.9 (triplet) | PhOH, R2C=CH2 |
| 4.85 (doublet, shoulder) | 4.85 (doublet, low int) | 4.85 (doublet, low int) | 4.85 (doublet, low int) | PhOH, R2C=CH2 |
| 4.8 (doublet) | 4.8 (doublet) | 4.8 (doublet) | 4.8 (doublet) | PhOH, R2C=CH2 |
| 4.65 (doublet) | 4.65 (doublet) | 4.65 (doublet) | 4.65 (doublet) | PhOH, ROH, R2C=CH2 |
| 4.45 (doublet) | 4.45 (doublet) | 4.45 (doublet) | 4.45 (doublet) | PhOH, ROH, R2C=CH2 |
| 4.35 (triplet) | 4.35 (triplet) | 4.35 (triplet) | 4.35 (triplet) | PhOH, ROH, R2C=CH2, Esters, |
| 4.25(triplet, low int) | - | - | - | PhOH, ROH, R2C=CH2, Esters, PhO-CH |
| 3.55 (triplet, sp) | 3.55 (triplet, sp) | 3.55 (triplet, sp) | 3.55 (triplet, sp) | ROH, Esters, Alcohols, Ethers |
| 3.45 (7) | 3.45 (7, resolution) | 3.45 (7, resolution) | 3.45 (7, resolution) | ROH, Esters, Alcohols, Ethers |
| 3.35 (singlet) | 3.35 (singlet) | 3.35 (singlet) | 3.35 (singlet) | ROH, Esters, Alcohols, Ethers |
| 3.05 (mult) | 3.05 (mult) | 3.05 (mult) | 3.05 (mult) | ROH, R2NH, Ethers |
| 2.75 (singlet) | 2.75 (singlet) | 2.75 (singlet) | 2.75 (singlet) | R2NH, ROH, NC-CH, Sulfides |
| 2.5 (singlet) | 2.5 (singlet) | 2.5 (singlet) | 2.5 (singlet) | R2NH, ROH, NC-CH, Sulfides |
| 2.3 (singlet) | 2.3 (singlet) | 2.3 (singlet) | 2.3 (singlet) | R2NH, ROH, NC-CH, Sulfides, Alkynes |
Control: The H-1 NMR spectra indicate the possible presence of various chemical constituents.
2 sprayed sample: The two key differences when compare to the control are intensity of the doublet at 4.85 ppm and resolution of the multiple at 3.45 ppm. These differences are related to the slightly enhanced flavor of this sample.
6 sprayed sample: The key differences in this sample are similar to that of the 2 sprayed sample, intensity of the doublet at 4.85ppm and resolution of the multiple at 3.45 ppm. In addition, a triplet at around 4.25ppm is much less intense in the 6 sprayed spectrum compared to the control spectrum. This additional change contributed to the more enhanced flavor of this sample.
12 sprayed sample: The key difference between the 12 sprayed and control which are related the reduced flavor are the intensities of the peaks at 2.75ppm and 2.3ppm.
Discussion
Economical, safe and highly acceptable ORS is helpful in acute gastro-enteritis and in minimizing the antibiotics intake (Szajewska et al., 2000) and life risk. The lesser acceptance of ORS is its intrinsic factor, the sodium chloride – salty taste – which is important for rehydration (Pieścik-Lech et al., 2012). A few studies were done to enhance the flavor of ORS with variety of fruit juices but which in turn decreased the sodium chloride contents (Loo et al., 2004). Ultimately, no studies successfully focused the sensory attributes and acceptability. This study has employed mid-infrared on ORS. Invention background, definition, technique of mid-IR generation from MIRGA, toxicological study on MIRGA, safety of the MIRGA sprayed usables and primeval and future scope of MIRGA have been described by Umakanthan et al., 2022a (detailed discussion on MIRGA available in supplementary text T2). The instrumentations done on ORS showed the changes in chemical bond parameters, followed by configuration and eventually physicochemical changes. Thus economical, easy, safe and rapid improvement of sensory attributes of ORS. 2-6 μm mid-infrared is biologically safer wavelength in infrared spectrum (Prasad, 2005). The mid-IR caused vibrational motions in ORS and altered the chemical bond parameters (Agarwal et al., 2014; Mohan, 2004) which caused the changes in physics and chemistry of ORS (Yi, 2012; Esmaeili, 2015; Atkins et al., 2011), and enhanced the sensory attributes. Such enhanced taste increased the palatability of ORS to children, hence fast rehydration. The results in this study is line with the favorable results obtained using MIRGA in coffee, tea, cocoa, edible salts and terminalia by Umakanthan et al., 2022a; Umakanthan et al., 2022b; Umakanthan et al., 2023c; Umakanthan et al., 2023d. In MIRGA technology, 6 spraying had enhanced the sensory attributes and made ORS more palatable, on contrary 12 sprayings made the ORS less palatable than the non-sprayed control. This study also indicates that each spraying exerts its typical effect on the chemistry of ORS, thereby on its palatability. This indirectly means that, depending on children’s requirement for acceptance, spraying number can be performed. GCMS study also proved the increased antioxidant property, glucose and eliminated the harmful plasticizers present in packing material and Benzyl benzoate.
Conclusion
Through sensory attribute test and different laboratory tests demonstrated herein is enhancement of sensory attributes and palatability of ORS effected by applied mid-IR. Also enhanced antioxidants and sugar simultaneously eliminating plasticizers and benzyl benzoate. More palatability would encourage more eager consumption of ORS, hence faster rehydration and less risk to life. Possibilities are viable for the inherent characteristic enhancement of other oral salts/ pharmaceuticals thereby dose, economy and host stress reduction.
Declarations
Author contribution
Umakanthan: Conceptualization, Methodology, Supervision, Validation.
Madhu Mathi: Data curation, Investigation, Visualization, Writing - Original draft preparation.
Umadevi: Project administration, Resources
Umakanthan, Madhu Mathi: Writing- Reviewing and Editing.
Competing interest
In accordance with the journal’s policy and our ethical obligation as researchers, we submit that the authors Dr.Umakanthan and Dr.Madhu Mathi are the inventors and patentee of Indian patent for MIRGA (under-patent no.: 401387) which is a major material employed in this study.
Data and materials availability
All data is available in the manuscript and supplementary materials.
Supplementary file available at: https://docs.google.com/document/d/1sTCP-AcCFrxPHyqa64gq1cW-AQmWXWLQ/edit?usp=sharing&ouid=111101387151809704391&rtpof=true&sd=true
Funding
The authors received no specific funding for this research.
References
- David, M. (2017). A simple recipe for saving lives. Science.
Publisher | Google Scholor - Pieścik-Lech, M., Szymański, H., & Szajewska, H. (2012). Efficacy and safety of a new apple-flavoured oral rehydration solution in children with acute gastroenteritis: a double-blind randomized controlled trial. Acta Paediatrica, 101(10):e458-e464.
Publisher | Google Scholor - Umakanthan, Mathi M. (2022). Decaffeination and improvement of taste, flavor and health safety of coffee and tea using mid-infrared wavelength rays. Heliyon, e11338:8(11).
Publisher | Google Scholor - Umakanthan T, Mathi M, (2022). Quantitative reduction of heavy metals and caffeine in cocoa using mid-infrared spectrum irradiation. Journal of the Indian Chemical Society, 100(1).
Publisher | Google Scholor - Umakanthan, T., & Mathi, M. (2023). Increasing saltiness of salts (NaCl) using mid-infrared radiation to reduce the health hazards. Food Science & Nutrition, 11:3535-3549.
Publisher | Google Scholor - Umakanthan, Madhu Mathi. (2023). Potentiation of Siddha medicine using Muppu (Universal Potentiator). International Journal of Pharmaceutical Research and Applications, 8(4):2070-2084.
Publisher | Google Scholor - Tishkevich D I, Korolkov I V, Kozlovskiy A L, Anisovich M, Vinnik D A. et al. (2019). Immobilization of boron-rich compound on Fe3O4 nanoparticles: Stability and cytotoxicity, J. Alloys Compd., 797:573-581.
Publisher | Google Scholor - Dukenbayev K, Korolkov I V, Tishkevich D I, Kozlovskiy A L, Trukhanov S V, et al. (2019). Fe3O4 nanoparticles for complex targeted delivery and boron neutron capture therapy. Nanomaterials, 494.
Publisher | Google Scholor - Kozlovskiy A L, Alina A, Zdorovets M V. (2021). Study of the effect of ion irradiation on increasing the photocatalytic activity of WO3 microparticles. J. Mater. Sci.: Mater. Electron. 32:3863-3877.
Publisher | Google Scholor - El-Shater R E, Shimy H E, Saafan S A, Darwish M A, Zhou D. et al. (2022). Synthesis, characterization, and magnetic properties of Mn nanoferrites, J. Alloys Compd., 928:166954.
Publisher | Google Scholor - Kozlovskiy A L, Zdorovets M V. (2021). Effect of doping of Ce4+/3+ on optical, strength and shielding properties of (0.5-x) TeO2-0.25MoO-0.25Bi2O3-xCeO2 glasses, Mater. Chem. Phys, 263:124444.
Publisher | Google Scholor - Almessiere M A, Algarou N A, Slimani Y, Sadaqat A, Baykal A, et al. (2022). Investigation of exchange coupling and microwave properties of hard/soft (SrNi0.02Zr0.01Fe11.96O19)/(CoFe2O4)x nanocomposites, Mat. Today Nano, 100186.
Publisher | Google Scholor - Pereira M F, Shulika O. (2011). Terahertz and Mid Infrared Radiation: Generation, Detection and Applications. Springer Science + Business Media B.V. The Netherlands.
Publisher | Google Scholor - Prasad N S, (2005), Optical communications in the mid-wave IR spectral band. Springer Science Journal. Opt. Fiber commun. Rep. 2:558-602.
Publisher | Google Scholor - Wichchukit S, O’Mahony M, (2014). The 9-point hedonic scale and hedonic ranking in food science: some reappraisals and alternatives. Journal of the Science of Food and Agriculture, 95(11):2167-2178.
Publisher | Google Scholor - Everitt M, (2009). Consumer-Targeted Sensory Quality. Global Issues in Food Science and Technology, 117-128.
Publisher | Google Scholor - Tsai S R, Hamblin M R. (2017). Biological effects and medical applications of infrared radiation, J. Photochem. Photobiol. B. 170:197-207.
Publisher | Google Scholor - Alvarez A, Prieto M, (2012). Fourier Transform Infrared spectroscopy in Food Microbiology. Springer Science & Business Media, 3.
Publisher | Google Scholor - Xu R, Xu Y. (2017). Modern Inorganic Synthetic Chemistry, 2nd edn., Elsevier B.V, Netherlands, 124.
Publisher | Google Scholor - Esmaeili K. (2015). Viremedy, Homeopathic Remedies, and Energy Healing Remedies as Information - including Remedies; A Synopsis, 43.
Publisher | Google Scholor - Szajewska H, Hoekstra JH, Sandhu B. (2000). Management of acute gastroenteritis in Europe and the impact of the new recommendations: a multicenter study. J Pediatr Gastroenterol Nutr, 30:522-527.
Publisher | Google Scholor - Loo, D.M., Graaf, F.V., & Ten, W.E. (2004). The effect of flavoring oral rehydration solution on its composition and palatability. Journal of pediatric gastroenterology and nutrition, 39(5):545-548.
Publisher | Google Scholor - Agarwal C M, Ong J L, Appleford M R, Mani G, (2014). Introduction to Biomaterials: Basic Theory with Engineering Applications. Cambridge university press, 81.
Publisher | Google Scholor - Mohan J, (2004). Organic Spectroscopy: Principles and Applications, 2nd edition, Alpha science international Ltd. Harrow, 19.
Publisher | Google Scholor - Yi G, (2012). Semiconductor Nanostructures for Optoelectronic Devices: Processing, Characterization and Applications. Berlin, Heidelberg: Springer-Verlag, 198
Publisher | Google Scholor - Atkins P, Paula J. (2011). Physical Chemistry for the Life Sciences, Oxford university press. Oxford, 365
Publisher | Google Scholor

