Research Article
Ontologies for Supporting Traffic Behaviour, Critical Gap, and Conflict Models at Unsignalized Intersection Routes
- Fajaruddin Mustakim 1*
- Mohammad Nazir Ahmad 2
- Azlan Abdul Aziz 2
- Saifulnizan Jamian 3
- Azwan Mahmud 2
- Rabiah Abdul Kadir 1
- Riza Sulaiman 1
1Universiti Kebangsaan Malaysia Institute, IR4.0, 43600, Bangi, Selangor, Malaysia.
2Faculty of Engineering and Technology, Malaysia Multimedia University, Malaysia.
3Universiti Tun Hussein Onn Malaysia, 86400, Batu Pahat, Johor, Malaysia.
*Corresponding Author: Fajaruddin Mustakim, Universiti Kebangsaan Malaysia Institute, IR4.0, 43600, Bangi, Selangor, Malaysia.
Citation: Mustakim F., Mohammad N. Ahmad, Azlan A. Aziz, Jamian S., Mahmud A. et al. (2023). Ontologies for Supporting Traffic Behaviour, Critical Gap, and Conflict Models at Unsignalized Intersection Routes. Clinical Case Reports and Studies, BRS Publishers. 2(3); DOI: 10.59657/2837-2565.brs.23.028
Copyright: © 2023 Fajaruddin Mustakim, this is an open-access article distributed under the terms of the Creative Commons Attribution License, which permits unrestricted use, distribution, and reproduction in any medium, provided the original author and source are credited.
Received: March 31, 2023 | Accepted: April 14, 2023 | Published: April 21, 2023
Abstract
Background: The challenge arises from management of big data in transportation can be identified by ontological approach. Road accidents are regarded as a significant cause of both harm to humans and financial damage in many countries. In Malaysia, there were 567,516 accidents in 2020 alone. This translates into a daily average of 13 people killed due to traffic accidents in the country. Here, our work focuses on gap patterns, critical gap analysis, gap acceptance of right-turning motorists (RTMs) and serious conflict model on Malaysia Rural Roadways at three-leg unsignalized intersections.
Methods: In early stage, traffic volume, motorist turning manoeuvre and speed study are implemented to identify the traffic behaviour at selected intersection. Three unsignalized intersection (UI) was involved namely (UI2), (UI 9), and (UI10). In the development of logistic regression models, five different datasets were used in this study: right-turning motorist (RTM) at unsignalized intersection UI2 (259 dataset), right-turning motorist at UI 9 (239 dataset), right turning motorist at UI 10 (314 dataset), right turning motorist combined model (812 dataset) and serious conflict lane change (351 dataset). Determination of critical gap was carried out at each unsignalized intersection 2, 9 and 10. Meanwhile gap-pattern analysis at each intersection used visualization spatial plot. In addition, this work investigated logistic regression method, artificial neuron network and structural equation modelling.
Results: Gap pattern three was discovered to be a vulnerable gap pattern. Furthermore, this research reveals that the attributes of the gap three pattern, motorcycles rider, speed limit exceeding 50 kph and RTMs where motorcycles stop near passenger cars in minor roads encourage serious conflict. Moreover, this study proposes novelty tool for identifying hazardous unsignalized intersection by using visualization spatial plot between approach speed and gap.
Keywords: ontology; traffic behaviour; critical gap; serious conflict; logistic regression; artificial neuron network; structural equation modelling
Introduction
Ontology is a set or cluster of conceptual rules. The researchers nowadays, have effort and concentrating to establish ontology in variety of traffic information and explore general characters of traffic data (Li Wan et. al) [1]. Preece et al [2], described the ontology combination and similarity verification in semantic fusion integration can be crystallize from semantic compilation of ontology to develop urban traffic ontology model.
Previous research by Victorovic et al. [3], suggested time-sensitive data coming from multi-sensory platforms using traffic data ontology approach, would be suitable solution for transportation planner. Hwang [4], found some ontologies have been developed for connected traffic data ontology from sensory platforms. However, there is still some space for improvement specifically to apply general guideline in the development of the domain.
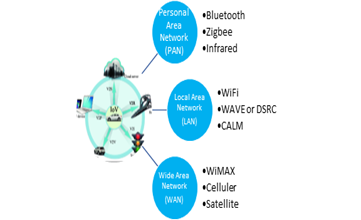
Previous study (LI Ruimin et al) [5], revealed that information fusion technology has capabilities connecting variety of data traffic such as traffic volume, speed, gap between car, vehicle classification, level of service, weather condition, GPS navigation, traffic video and so forth to city infrastructure. By using the remote control and assist from management information fusion, it has been shown that the traffic flow efficiency and integration of comprehensive information sharing can be improved (Yang et al) [6]. A sensor is typically an electronic device which detects and responds to changes within the sensor’s environment (Janowicz et al., 2019) [7]. The modifying interaction will hold the property value, and the process that determines this value is referred to as an observation. Loop detectors monitor the vehicles’ existence and gather objects from specific areas of the road. This process of sampling is repeated in the observation stage. An actuation is defined as an observation that causes certain actions; meanwhile, the device that performs the actions is known as an actuator. In smart cities, varieties of sensors come from Bluetooth, Wi-Fi, thermal and 3D cameras whose big amount of data are organized on the Web. With the big data collected on the Web, consequently, is beneficial in smart mobility studies and smart cities planning (Janowicz et al., 2019) [7]. The density of traffic user and connected vehicles is increasing rapidly. Thus, appropriate approach to accommodate network service to connect the big number of vehicles is required. The network services should be user friendly, robust, and workable information sharing between motorist and other devices. Internet of Thing (IOT) and VANETs share a similar platform. Among the trials faced by ontology researchers and engineers is to determine the new ID or giving a name to vehicular communication technologists as Internet-of-Vehicles (IoV). Based on this scope, the IoV can be categorised into three networks: Personal Area Network (PAN), Local Area Network (LAN), Wide Area Network (WAN) (Jawhar et al., 2018; Gasmi and Aliouat, 2019) [9]. Three networks have different types of service that are briefly discussed below. Figure 1 shows Internet-of-Vehicles (IoV) in different network technologies.
Figure 1: Internet-of-Vehicles (IoV) in different network technologies
Personnel area network (PAN) is suitable for low bandwidth and energy consumption communi-cations. Typically, vehicle to sensor (V2S) utilises ZigBee which supports low-cost communication technology for short-range information exchange. Vehicle to personnel (V2P) or vehicle to human (V2H) communication, on the contrary, is related to Bluetooth short-range communication. For infrared communication, a PAN method, which transfers data at a lower speed in comparison to Bluetooth, is considered. Consequently, infrared signal has limitation regarding the interruption by obstacles and within short distances (Anwer and Guy, 2014) [10].
Wireless Access in Vehicular Environments (WAVE) technique is the most popular for Land Area Network (LAN) service. WAVE or Dedicated Short-Range Communications (DSRC) is a system that delivers effective and dependable radio communications for V2V, V2R, or V2I direct connectivity (Jian and Zhu, 2019) [11]. WAVE technology is operated with two device system call vehicle onboard units (OBU) and on roadside units (RSU) (Chhabra et al., 2015) [12]. RSUs units are typically installed in roadside infrastructure, such as traffic signals, poles, road signs, and electronic boards. WAVE devices are capable to reach communication range of about 300 to 1000 meters for vehicles moving at speed of 10 to 200 kph (Chhabra et. al., 2015) [12].
(Zekri and Jia, 2018) [13] discovered that WiFi technology for motorist communication incorporates roadside units as wireless access points and supports motorist communication within their coverage areas. WiFi service provide V2I and V2V communication. It has limited WiFi coverage to less than 100 meters and does not support fast motorists.
Worldwide Interoperability for Microwave Access (WiMAX) is another type of LAN service. WiMAX offers up to a distance of 50 km vehicle communication to the Internet and high bandwidth connectivity. Therefore, vehicle to everything (V2X) communication is compatible with this WiMAX service.
Cellular network services possess high mobility speeds and can support a variety of long-range radio-waved motorist communications (Anwer and Guy, 2014) [10]. The system includes cellular services like 2G, 3G, and 4G/LTE technologies with different bandwidths, delays, and transmission speeds. (Gasmi and Aliouat, 2019) [9] considered cellular network (4G/LTE) are practical communication technology for V2V communication.
Satellite Communications use Microwaves or low-power radios to transmit data over long distances. Satellite capabilities can be utilised to arrange for long-distance wireless networks that link many cities. Subsequently, it can be utilized in vehicle positioning in VANETs, via Global Positioning System (GPS).
(Bermudez-Edo et al., 2016) [14] revealed the development of IoV ontology from the developed internet of things (IoT) ontology can be beneficial because of the similarity in term of concept and technologies between the two domains. Ontology established for the IoT domain includes three principal classifications: object, system, and services. Objects are any entity in IoT environment. A unit of abstraction for every physical thing for sensing is referred to as a system. The system has mechanism and sub-systems. As for any service offered by IoT devices is called a service. (Chhabra et al., 2015) [12] found that ontological studies have adopted VANET data in certain mobility applications. Vehicle routing, the concept, and entities in connected roadways and IoT technologies have not been conducted in the context of transportation ontology and smart cities. In the future, ontology researchers and engineers will face a major challenge of defining concepts and entities in IoV, sensor technology, and future connected roadways requirements.
Human negligence somehow has been recognised as the leading cause of most traffic accidents, but road-related factors must not be ignored either. Traffic accidents are rarely the result of a single cause. Human error is usually always associated with technical deficiencies in traffic safety equipment. For instance, traffic accidents caused by motorists crossing from minor roads onto mainstream roads at unsignalized intersections are normally linked to traffic attitude and dangerous road safety equipment like without opening signalized, channelization, and road median. Hence, to lessen accidents, there is a need to consider engineering countermeasures, smart transportation, and self-driving vehicles as the future of road transportation. Autonomous vehicles will reduce traffic congestion by at least 50% by O.I Olayode et al., (2020) [15].
Based on police statistical records obtained from Polis Di Raja Malaysia (PDRM) [16], from 18th March 2020 to 18th February 2021, the number of motorcycles crashes in Malaysia was 8,932 cases. About 33.8% or 3,020 cases involving motorcycles resulted in fatalities, while 15.1% (1,351 cases) involved serious injuries. 47.3% (4,223 cases) and 3.9% (338 cases) of the recorded cases resulted in minor injuries and damage respectively. Abdul Manan and Varhelyi [17] revealed that motorcycles accounted for the greatest number of death rate on rural Malaysian roads (61%), followed by main roads (62%), and straight roads (66%). Abdul Manan et al., [18] claimed that the causes of motorcyclist death rate in Malaysia involve straight road sections, access points, main or side roads, males, age 21 to 30, speeding, and wet roads (2011). Fajaruddin et al., [19] studied accident prediction models applying the regression method. The study concluded that the factors influencing traffic accidents on rural roads involve several access points, approach speed, motorcyclists, and passenger vehicles. A past study by Din et al., (2013) [20] made use of the multiple linear regression approach to analyse accidents that cause death and critical injuries. The study found that right turn motorcyclists crossing from secondary roads onto main roads, as well as several access points greatly resulted in road accidents, and that the number of accidents can be reduced greatly by installing traffic signals and road dividers.
Nagalla et al., (2017) [21] conducted support vector machines, random forest, and decision tree algorithms to predict traffic gap acceptance or rejected judgment at uncontrolled unsignalized intersections. Three 4-legged unsignalized intersections were selected and data observation was analysed to develop the models. The essential of this study is to analyse the traffic behaviour factor that encourages serious conflict by using binary regression method and provide a suitable approach to evaluate vulnerable unsignalized intersection.
Methods
This study located at Malaysia Federal Route 50 has four lanes two ways partial divided road. Total stretch of the roadway from Batu Pahat to Ayer Hitam is about 40 km. The existing road consist high density of access road or unsignalized intersection. It is because, location of the route crossing several housing area, industrial hub, and commercial building. In year 2021, it has capacity providing approximately 74,862 veh/day and up to 7,429 veh/hr. The design speed for this route is around 100 kph. The method applies in this study including site investigation, video recording, traffic behaviour analysis, critical gap, speed study, gap pattern, development of right turn model and conflict model. Binary regression or logistic regression and artificial neuron network has been implemented in the models. Ontology approach, supply chain and visualization concept will incorporate in this paper to support traffic management system.
Data collection
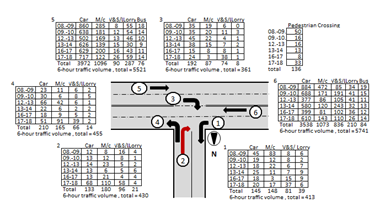
Video cameras were located at selected unsignalized intersections (UI) and data collection was concentrated on all traffic manoeuvre behaviour as illustrated in Figure 2. Data of vehicles, classified by type, like cars, motorbikes, lorries, and public transport were gathered from hourly traffic volume (disaggregated according to every type of motor vehicle), occurring on every road section (UI2, UI9, and UI10) at the chosen unsignalized intersections (UI2, UI9, and UI10).
Data on conflict situation, approach speeds, vehicle flow, and pedestrian crossings were simultaneously collected. Once the recording was finished, all the video cams were brought to the laboratory for further microscope analysis. The selection of UI2, UI9, and UI10 were based on two aspects; firstly, by accidents blackspot ranking recorded on UI2, UI9, and UI 10 [22] and secondly on the road safety facilities provided on those UI. UI2 was a three-leg unsignalized junction. It has concrete dividers, right turn channelization, and traffic lights approximately 100 meters from the intersection in the middle of the mainstream road as shown in Figure 11. UI9 was a three-leg junction and traffic signal located around 100 meters from the intersection. UI9, did not equip concrete road median and right turn channelization. Meanwhile UI10, was a three-leg junction connecting four lanes on a major road with a two lanes minor road as illustrated in (Figure 2 and Figure 10). It has no traffic safety facilities such as traffic signal, concrete road median and right turn channelization. Figure 2 shows the traffic volume manoeuvres and pedestrian crossing at UI10. Traffic volume manoeuvres (Figure 2) and speed distribution (Figure 3) used in UI10 were based on traffic safety measures and it has been identified as vulnerable unsignalized intersection in perspective of gap three pattern, average gap acceptance and critical gap (Figure 13).
Figure 2: The traffic volume manoeuvres count at the (UI 10) T-junction.
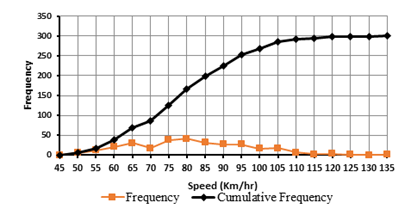
Figure 3: Distribution of speed at UI10
Traffic Volume
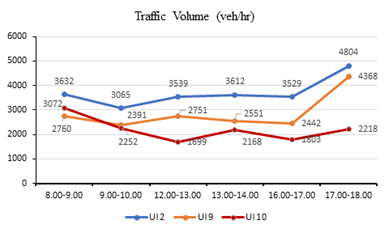
Traffic count was collected at three unsignalized intersection UI 2, UI 9 and UI 10 using video cameras. Traffic data carried out in this paper were based on hourly traffic volume and focusing at three peak hours namely morning (8:00-10:00), midday, (12:00-14:00) and afternoon, (16:00-18:00). Figure 4, illustrate the highest traffic volume was during afternoon at (16:00-18:00) stated 4,804 veh/hr, 4,368 veh/hr and 2218 veh/hr for UI 2, UI 9 and UI 10 respectively. Consequently, second highest traffic volume was during morning at (8:00-10:00) recorded 3,632 veh/hr, 3,072 veh/hr and 2,760 veh/hr for UI 2, UI 10 and UI 9 respectively. Consciencely, third highest traffic volume was during midday at (13:00-14:00) obtained 3,612 veh/hr, 2,551 veh/hr and 2,168 veh/hr for UI 2, UI 9 and UI 10 respectively.
Figure 4: Traffic volume fluctuation over six hours survey during a typical weekday.
Right Turn Volume
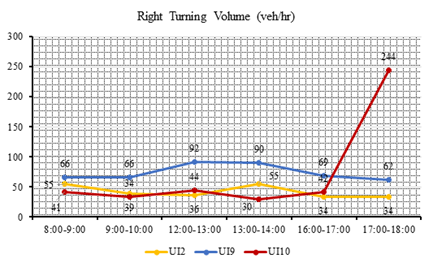
Right turning volume in this section define as right turn motorist from minor road onto major road at selected intersection (Figure 2). As mention before in previous section, the traffic count was based on hourly traffic turning volume (veh/hr) at three peak hours (8:00-10:00), (12:00-14:00) and (16:00-18:00). (Figure 5) describe three pattern turning volume over six hours duration. Right turning flow at UI 10 recorded in uniform trend with 41 veh/hr, 39 veh/hr, 44 veh/hr, 55 veh/hr, 42 veh/hr and drastically increase stated 244 veh/hr. Consequently, both turning flow at UI 2 and UI 9 generally represent stable turning movement and less fluctuation, comparing with UI 10.
Figure 5: Turning volume fluctuation over six hours survey during a typical weekday
Speed Distribution
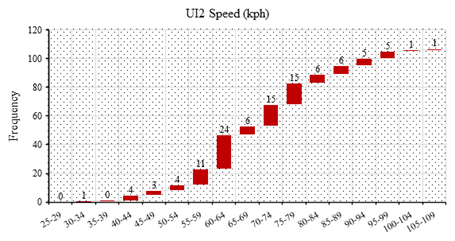
As mention before speed study data were analysis form the video camera that recorded on the selected intersection. In unsignalized intersection 2, 107 vehicles sample speed has been analysed. The second vehicle speed that allowed right turn motorist (RTM) from minor road onto major road were selected. Average motorist speed in the intersection was 75kph. Figure 6, shown the distribution of speed at UI 2. The higher frequency of speed range (60kph-64kph) recorded 24 motorists. Speed between (70kph -74kph) and (75kph- 79kph) share same number of frequencies 15. Meanwhile speed range (55kph-59kph) stated third higher with 11.
Figure 6: Distribution of speed at UI2.
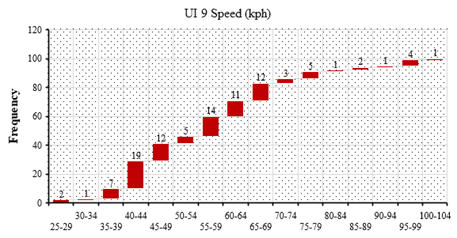
Figure 7, shown the distribution of speed at UI 9. The higher frequency of speed range (40kph-44kph) recorded 19 vehicles. Meanwhile speed range (55kph-59kph) stated second higher with 14 sample. Speed between (45kph -49kph) and (65kph- 69kph) share same number of frequencies 12. Average motorist speed obtained in UI9 was 57 kph.
Figure 7: Distribution of speed at UI9.
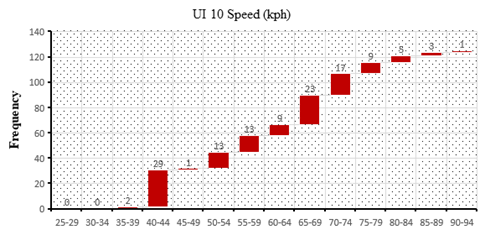
Figure 8, shown the distribution of speed at UI 10. The higher frequency of speed range (40kph-44kph) recorded 29 vehicles. Consequently, speed range (65kph-69kph) stated second higher with 23 sample. Meanwhile, speed between (70kph -74kph) received third higher with 17 frequencies. Average motorist speed obtained in UI0 was 58 kph.
Figure 8: Distribution of speed at UI10.
Speed Cumulative Distribution
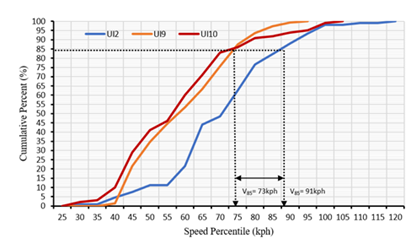
Approaching speed was defined by the 85th percentile speed measured at approximately 50-meters range from the selected unsignalized intersection. This study decided to use 85th percentile rule to support establish speed limits on the selected UI. The speed cumulative frequency distribution at three deferent intersections, were shown in Figure 9. The 85th speed has been established using two method, cumulative distribution graph curve and analysis dataset using SPSS at unsignalized intersection 2 (UI2), UI 9 and UI 10. In SPSS 26, select analyse, descriptive statistics and frequencies to determine the 85th speed percentile. Both approaches give a same result. The operating speed (V85) obtained at UI 2 stated the highest 91kph. Meanwhile, UI 9 and UI 10 share the same 85th speed percentile with 73kph. The different operating speed was quite large between three sites. The variable speed 50kph has found significant contribute to serious conflict in the Model 5 and discussed in section 4.2.2. Implementing speed limit under 50kph, would be appropriate in reducing traffic conflict occur at selected intersection. This should be effective when 85% of drivers speeding below the speed limit.
Figure 9: Speed cumulative distribution curve for UI2, UI9 and UI10
Gap Acceptance
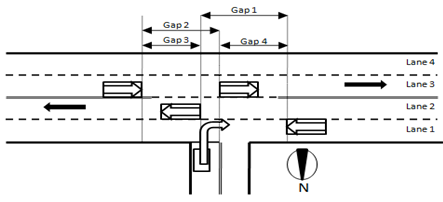
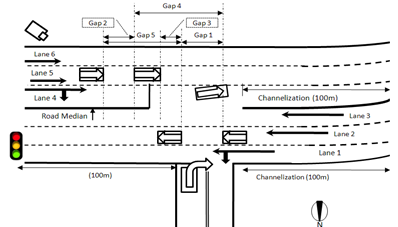
The gap pattern types for right-turning vehicles (RTMs) were introduced by Din et al., (2013) [20]. Figure 10 displays four gap pattern types for right-turning vehicles at UI9 and UI10. On the contrary, Figure 11 exhibits five gap pattern types for RTMs at UI2. The types of gaps are in both figures are explained as follows:
- Gap one: the gap between two vehicles in lane one or lane two. This involves the first vehicle overtaking the RTM and the second vehicle to permit the RTM to go right.
- Gap two: the gap between a pair of vehicles in lane three.
- Gap three: the gap between the first vehicle in lane one or lane two, which has just overtaken the RTM while the second vehicle is in lane three.
- Gap four: the gap between the first vehicle in lane three, which has just overtaken the RTM while the second vehicle is in lane one or two.
- Gap five: the gap between the first vehicle in lane one or lane two, overtaking the vehicle at the front of the line, and then staying behind the second vehicle in lane five.
Figure 10: Four gap pattern types for accepted or rejected gap by vehicle- turning right at the UI9 and UI10 unsignalized T-Junctions.
Figure 11: Five gap pattern types for accepted or rejected gaps by vehicle- turning right at the UI2 unsignalized T-Junctions.
Change Lane Conflict
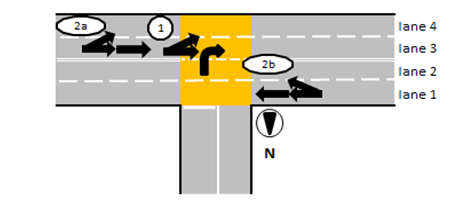
As displayed in Figure 12, conflict types in these studies were summarised into two classes: lane changing as a result of rear-end conflict and lane changing as a result angle conflict. Firstly, a changed lane due to rear-end conflict occurs when a minor road’s right-turns vehicle moves on to the mainstream road. The vehicles in lane three will permit the RTM by reducing speed. In contrast, the tailing vehicle has the tendency to be involved in a rear-end conflict situation by the change of lanes from lane three to lane four, as presented in Figure 12. Second, angle conflict occurs when RTM crosses the secondary road into the main road. The vehicles from the left side lane three are in a potential collision, i.e., lane changing conflict as a result of an angle conflict, as illustrated in Figure 12. ThirdTop of Form
TThi, the lane changing crash circumstance happens because of the nose to tail conflict due to RTM’s entering the main road from the intersection. As exhibited in Figure 12, the motorists in lane one has the possibility to be involved in a physical-conflict as a result of the sudden lane changing caused by the nose to tail conflict between the first and second following vehicles.
Figure 12: Types of traffic conflicts at unsignalized T-junctions. 1= lane changing as a result of angular conflict; 2a and 2b= lane changing as a result of nose to tail conflict.
Results
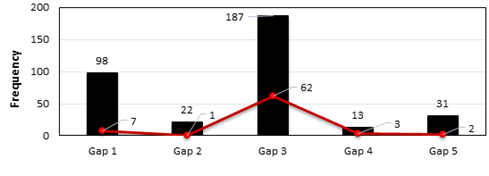
Figure 13 shows the frequency of accepted gaps for each type of gap pattern and number of lane change conflicts at all three intersections (UI2, UI9 and UI10). Gap three patterns demonstrate the maximum accepted gap (187) as well as the highest number of lane change conflicts (62). Contrariwise, the gap two patterns produced the least lane change conflicts with one case.
Figure 13: Frequency gap obtained from each type of gap pattern in all UI.
Average gap and critical gap analysis
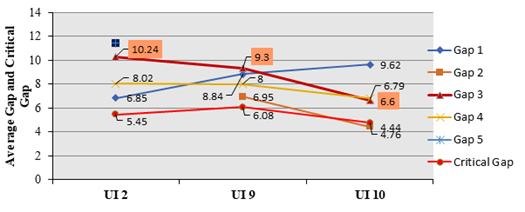
The average gap in each type of gap pattern in all unsignalized intersections (UI) is summarised in Figure 14. Concentrating on the gap three pattern and critical gap, there is a decreasing trend of average gap from UI2 recorded (10.24), UI9 (9.3), and UI10 (6.6). Similarly, the gap two and gap four patterns show a declining trend. Likewise, critical gap obtained at UI2 (5.45 seconds), UI9 (6.08 seconds) and UI10 (4.76 seconds) show reducing trend except for UI9 critical gap. The determination of critical gap for each unsignalized intersection, have been discussed in section 4. In contrast, the average gap for the gap one pattern indicates an increasing trend from UI2 (6.85), UI9(8.84), and UI10 (9.62). The UI2 intersection has road safety infrastructure such as right turn channelization, concrete road dividers, and traffic signals approximately 100 metres before the unsignalized T-junction as illustrated in Figure 11. However, the UI9 and UI10 intersections are not furnished with any road safety infrastructure.
Figure 14: Average gap pattern and critical gap analysis for intersections in all unsignalized Intersection (UI).
Distribution of accepted gap and rejected gap
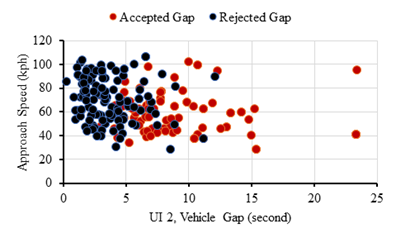
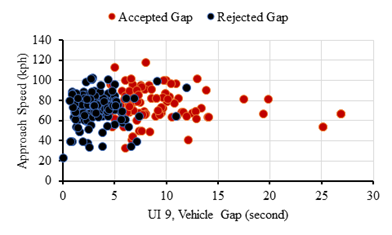
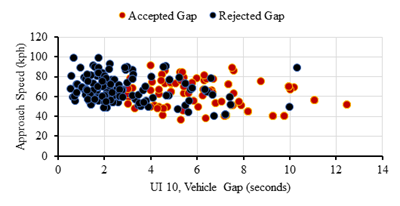
The study has selected three unsignalized Intersection (UI) namely UI 2, UI 9 and UI 10. Figure 15, Figure 16, and Figure 17 shown the distribution of gap accepted and gap rejected against approach speed in form of spatial plot at UI 2, UI 9 and UI 10 respectively. The second vehicles on the major road that allowed RTMs had an average accepted approach speed of 57 kph, 75 kph and 58 kph at UI 2, UI 9 and UI 10 respectively. Consequently, average accepted gap for all the right-turning vehicles at UI 2, UI 9 and UI 10 was 9.46 seconds, 9.28 seconds, and 6.85 seconds. Consciencely, average rejected gap at UI 2, UI 9 and UI 10 was 3.59 seconds, 3.25 seconds, and 2.82 seconds.
Figure 15: Plot of spatial gap and approach speed at Unsignalized Intersection 2 (UI 2)
Figure 16: Plot of spatial gap and approach speed at Unsignalized Intersection 9 (UI 9)
Figure 17: Plot of spatial gap and approach speed at Unsignalized Intersection 10 (UI 10)
Analysis of change lane conflict and gap acceptance frequency
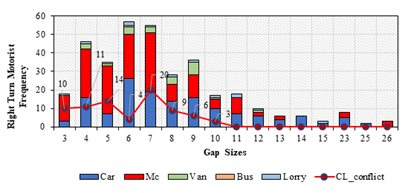
Figure 18 illustrates the categories of crossing vehicle (RTMs) rate according to gap sizes, putting together all three unsignalized intersections. Gap sizes 7 and 6 show the highest frequency (more than 50) of gap acceptance. The intersection has recorded 35 cases of lane changing with major collisions with gaps of less than six seconds and 42 cases of lane changing with minor collisions with gaps of 7-10 seconds.
Figure 18: Accepted gap frequency for right turning motorists engaged in lane changing conflicts at unsignalized T-Junctions
Development of Critical Gap Models, RTM Model, SCLC Model
Firstly, this section discovers the determination of critical gap at UI 2, UI 9, and UI 10 by using logistic regression method. Secondly development of right turning motorist (RTM) model, combined all unsignalized intersection (UI). Thirdly, concentrating the serious conflict lane change model. The models consist of 5 dataset Model 1 (259 dataset), Model 2 (239 dataset), Model 3 (314 dataset), Model 4 (812 dataset) and Model 5 (351 dataset). Models 1, 2, and 3 purpose for determine the critical gap at UI2, UI9 and UI 10. Meanwhile Model 4, objective to identify the significance variable influence the RTMs. Furthermore, Model 5 intention to explore the behavior of serious conflict due lane change at combined UI. The dependent variable in Model 1, Model 2, Model 3 and Model 4 was RTM, and set to 1 and 0 if otherwise. Meanwhile dependent variable in Model 5 was serious conflict lane change, which was set to 1 and 0 otherwise. To suit the data and relate the effects of various factors on all models, logistic regression was created. Additionally, a stepwise selection strategy was adopted to determine the intervals at 99%, 95% and 90%. The models were built and validated using SPSS Statistic 26 software. All model attributes are described in Table 1.
Table 1: Attributes of serious conflict models.
| Abbr. | Description |
| RTM | RTM=1 if motorist turned right at a gap, but 0 if not. |
| Gap | Gap which is rejected or accepted (sec). |
| Car | Car=1 if the RTM is car, and 0 if otherwise. |
| Mc | Mc=1 if the RTM is motorcycle, and 0 if otherwise. |
| Rider | Rider= 1 if the RTM is rider, and 0 if otherwise. |
| Van | Van= 1 if the RTM is van, and 0 if otherwise. |
| Lorry | Lorry= 1 if the RTM is lorry, and 0 if otherwise. |
| Bus | Bus= 1 if the RTM is bus, and 0 if otherwise. |
| McN | McN=1 if the RTM is a motorcycle stopping near car passenger in minor road, and 0 if otherwise. |
| CLAc | Changing lane as a result of Angular conflict = 1 if changing lane as a result of angular conflict happened, and 0 if not. |
| CLNTc | Chaning lane as a result of Nose to Tail conflict = 1 if changing lane as a result of Nose to Tail conflict happened, and 0 if not. |
| SCLC | Serious conflict lane change = 1 if SCLC occurred, and 0 if otherwise. |
| Gap1 | If the gap was gap pattern 1 in Fig. 4, Gap1=1, but 0 if not. |
| Gap2 | If the gap was gap pattern 2 in Fig. 4, Gap2=1, but 0 if not. |
| Gap3 | If the gap was gap pattern 3 in Fig. 4, Gap3=1, but 0 if not. |
| Gap4 | If the gap was gap pattern 4 in Fig. 4, Gap4=1, but 0 if not. |
| Gap5 | If the gap was gap pattern 5 in Fig. 5, Gap5=1, but 0 if not. |
| SPLT50 | SPLT50 =1 if speed limit less than 50 kph and 0 if otherwise. |
| Chanlz | If channelization facility in unsignalized intersection, so Chanlz = 1, but 0 if not. |
| TSignal | If all vehicles in unsignalized intersection, so TSignal=1, but 0 if not. |
As mention before, Model 1, Model 2, and Model 3 purpose to calculate the critical gap at UI 2, UI 9, and UI 10. Model 1 consist 259 datasets, which have 107 accepted gaps and 152 rejected gaps. Model 2 content 239 dataset (100 accepted gaps, 139 rejected gaps). Model 3 involved 314 dataset (144 accepted gaps, 170 rejected gaps). Model 4 have 812 dataset (351 accepted gaps, 461 rejected gaps). Probability at the randomly selected RTM will accept gap, using logistic function as in equation below:
Where = constant, , , and = is the regression coefficient, , , and = other dependent variables. Previous researcher (Gattis et. al., 1998) [23] have justify the critical gap is that gap for which the probability of accepting is 0.5. As shown below, logit function in equation (1) can be transferred into a linear equation:
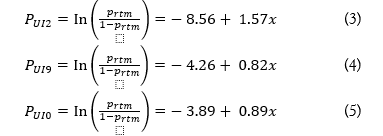
Logic function or logistic regression as in equation (2) is applied for to the same dataset as shown in Table 2, the following predictive equation for UI 2, UI 9 and UI 10 are established:
Table 2: Logistic Regression Models for Critical Gap and Right Turn Motorist (RTMs)
| Attributes | Model 1 | Model 2 | Model 3 | Model 4 |
| UI 2 | UI 9 | UI 10 | All | |
| (simple) | (simple) | (simple) | (detail) | |
| Constant | -8.56 | -4.26 | -3.89 | -5.35 |
| (50.58) *** | (64.44) *** | (87.30) *** | (187.29) *** | |
| Gap | 1.57 | 0.70 | 0.82 | 0.96 |
| (48.81) *** | (58.55) *** | (89.18) *** | (201.97) *** | |
| SCLC | - | - | - | 4.18 |
| (28.95) *** | ||||
| Rider | - | - | - | 0.59 |
| (5.73) ** | ||||
| TSignal | - | - | - | -0.67 |
| (6.36) *** | ||||
| Chanlz | - | - | -0.83 | |
| (3.04) * | ||||
| N | 259 | 239 | 314 | 812 |
| NagelkerkeR2 | 0.82 | 0.61 | 0.60 | 0.72 |
| H.R-Right Turn | 88% | 75% | 76% | 83% |
| H.R-Total | 92% | 83% | 84% | 87% |
*, **, ***=Significant at 90%,95%, and 99% levels, respectively
The resulting variables specified in Model 4 were gap, rider, serious conflict lane change (SCLC), traffic signal (TSign) and channelization (Chanlz). Meanwhile, the significant variables in serious conflict lane change model (SCLC) were gap 3 patterns, motorcycle, motorcycle stop near passenger car on minor road (McN) and speed limit less than 50 kph (SPLT50). In Model 4, a positive sign of rider and serious conflict lane change indicates that RTM likely to shorter gap acceptance. Conversely, a negative sign in the traffic signal and channelization can be interpreted to mean that RTM likely to accept longer gap.
Critical Gap
As exhibited in Table 2, the estimation of critical gaps for RTMs was defined by an acceptable gap with a probability of equal to 50%. Model 1 (Equation 3), Model 2 (Equation 4) and Model 3 (Equation 5) were employed to estimate the critical gap for UI 2, UI 9, and UI 10 by including = 0.5 for each model. Table 3 shown the summary of critical gap. The result of critical gap for UI2, UI9 and UI 10 were 5.45 seconds, 6.08 seconds, and 4.76 seconds, respectively. All the critical gap in each UI did not comply with United Stated Highway Capacity Manual (USHCM 2000) [24] and Malaysia Highway Capacity [25] which is 7.5 seconds and 7.0 seconds respectively.
Table 3: Critical gap for three unsignalized intersection
| Right Turning Motorist (RTMs) | Critical Gap (tc) (seconds) |
| Unsignalized Intersection 2 | 5.45 |
| Unsignalized Intersection 9 | 6.08 |
| Unsignalized Intersection 10 | 4.76 |
| USHCM 2010 | 7.5 |
| JKR Malaysia Highway Capacity Manual | 7.0 |
Serious Conflict Model using Logistic Regression and Artificial Neuron Network
Logistic Regression
In Model 5, the positive sign for gap three pattern showed that serious conflict was likely to occur in the gap three pattern. Negative signs of SPLT50 can be interpreted as serious conflicts often occurred when vehicles had approaching speeds of more than 50 kph. Meanwhile, the positive sign when RTMs were motorcycle (rider) and RTM were motorcycle stopping near passenger car in the minor roads (McN) causing frequent serious conflict (Table 5). McN attributes in the model stated 36 cases, with an average waiting time of 23 seconds.
Artificial Neuron Network
The association between the input and output was represented by the artificial neural networks. This method is used in the framework of regression, which requires a more complex methodology like probit or logit. For the study, SPSS 26 software was used to conduct the analysis as it had the capability to perform artificial neural network analysis. The process requires both dependent and independent variables to be entered. Then, it is critical to choose the program route. Three processes are involved in this process: analysis, neural networks and multilayer perceptron. In this section, serious conflict lane change (SCLC) was the dependent variable, and the other predictors were represented as covariates. Following that, in the network structure section, the description, diagram and synaptic weights must be selected. In addition, the thick model summary, classification results and independent variables important analysis are required in the network performance path. It is possible to address which parameters have a significant role by comparing the result to the beta coefficient, level of significance, Nagelkerke R2 and hitting ratio in the logistic regression method.
Development of serious conflict model in this study were implementing Artificial Neuron Network (ANN). Table 5 shows the processing summary of the model using 351 datasets. Training processing for serious model involved 253 data, meanwhile testing processing consisted of 98 data. Area under curve (AUC) is a useful statistical summary of the network in the ANN model. The serious conflict model obtained AUC 0.84 which meant the model exhibited useful predictions. In the training process, correct prediction model stated 91% and testing process, correct prediction model received 90%. Training time taken about 0:00:00.06.
Table 5: Serious conflict lane change model.
| Attributes | Logistic Regression Method (LRM) Serious Conflict Lane Change Model 5 | Artificial Neuron Network (ANN) Serious Conflict Lane Change Model 6 | Attributes | ||
| Beta | Wald | Normalized Importance | Importance | ||
| Gap 3 | 2.76 | 13.52*** | 100.00% | 0.374 | Gap 3 |
| Rider | 1.14 | 6.94*** | 55.00% | 0.206 | Rider |
| McN | 1.35 | 4.73** | 53.10% | 0.199 | McN |
| SPLT50 | -1.44 | 7.05*** | 59.40% | 0.222 | SPLT50 |
| Constant | -4.81 | 40.54*** | - | - | Constant |
| Total Sample | 351 | 351 | Total Sample | ||
| Nagelkerke R2 | 0.27 | 0.84 | AUC | ||
| Hitting Ratio-Total | 91% | 253/98 | Training/Testing | ||
| - | - | 91.00% | Training | ||
| (Correct Pred) | |||||
| - | - | 90.00% | Testing | ||
| (Correct Pred) | |||||
| - | - | 00:00.1 | Training Time | ||
| *, **, ***=Significant at 90%,95%, and 99% levels, respectively | |||||
All the parameter in the model have more than 50% normalized importance. In Serious Conflict Model, it appears that the variable related to gap three patterns achieve (100%) normalized importance and had a greater effect on serious conflict. This was followed by approach speed over 50kph (59.40%), consequently motorcycle rider (55%) and RTM motorcycle stop near passenger car on minor road (53.10%).
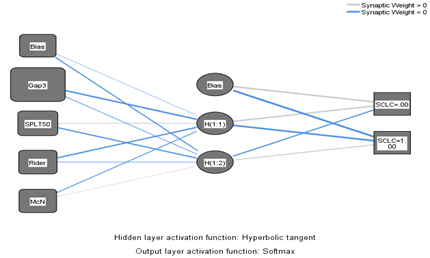
Multilayer perceptron (MLP) is one of the common neural network models. MLP basic structure consist of one input layer, one or more hidden layer and one output layer. Each layer connected one or several nodes. Input layer has many nodes and represent of independent variables and similarly, with output layer has many nodes that represent dependent variables. Figure 19, shown the neuron network structure for conflict model.
Figure 19: Schematic view of the neural network structure
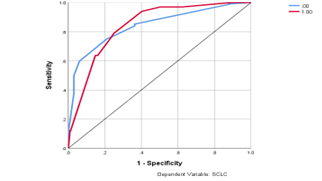
Usually, tables used for analysis represent only value without graphical. However, ROC curve presented a visualization of the specificity and sensitivity for all possible cut-offs. The plot graph easily to understand and gave influential result. Figure 20, illustrate the ROC curve. In the graph, sensitivity represented the number of positive cases correctly classified and specificity represent the number of negative cases incorrectly classified positive. Both lines were on the top left corner close to 1, which indicates that the model is best fit.
Figure 20: ROC curve
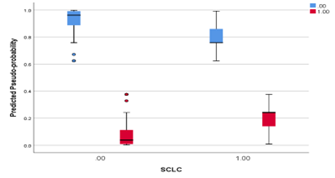
Figure 21, represent the probabilities of predicted pseudo and the result are shown in Table 5. The arrangement box illustrated the predicted pseudo-probability of the fitting classified cases of categories, “0” and “1”. The unfitting classified cases of both categories were observed under the cut point 0.5.
Figure 21: Predicted Pseudo-Probability.
Structural Equation Modelling
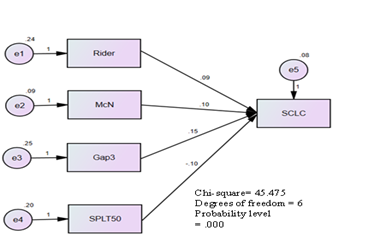
The dataset use in serious conflict due lane change (SCLC) model for logistic regression and artificial neuron network are the same dataset implement in structural equation modelling. The development of the structural equation modelling (SEM) was utilizing IBM SPSS AMOS 23 software. Table 6, shown the outcomes result for each variable in the model. The detail such as parameter estimate, standard error (S.E), critical ratio (C.R) and level of statistical significance (P) are described in Table 6. All five variable namely motorcycle rider (Rider), gap three pattern (Gap3), speed limit less than 50 kph (SPLT50) and motorcycle stop near the passenger car (McN) were highly statistical significance at 99%, except for McN variable received 95% significance level. Meanwhile, each parameter shows positive sign, excluding SPLT50 obtain negative sign. This output indicates the similarity of significant level and sign –/+, for each parameter between logistic regression and structural equation modelling. Consequently, SEM and ANN have visualization presentation in structural network.
Table 6: Result of Conflict SEM
| Estimate | S. E | C.R | P | Label | |
| SCLC <--- Rider | .092 | .030 | 3.071 | .002 | Parameter 1 |
| SCLC <--- McN | .103 | .048 | 2.139 | .032 | Parameter 2 |
| SCLC <--- Gap3 | .150 | .029 | 5.098 | *** | Parameter 3 |
| SCLC <--- SPLT50 | -.103 | .033 | -3.160 | .002 | Parameter 4 |
The value of chi-square in the model is 45.5, and it was statistically significant base on the chi-squared test. The root mean square residual (RMR) index has a value of 0.019, the index of (RMR) less than 0.08 mean the index is quite good (Hu and Bentler, 1998). The goodness of fit index (GFI) and adjusted goodness of fix index (AGFI) index obtained 0.95 and 0.90 respectively. Each index has close to 1.0 indicate the conflict model has perfect fit (Hair et al 2010). Final structure of the conflict model shown in Figure 22.
Figure 22: Structural Equation Modelling Network
Discussion
- Even though traffic volume at UI 2 and UI 9 stated the maximum number (Figure 4) comparing with traffic volume at UI 10. However, UI 10 has been classified as vulnerable intersection base on the average gap acceptance and critical gap (Figure 10). This might be UI 2 and UI 9 has safety facilities such as road divider, right turn channelization and relatively close to traffic signal.
- Figure 5 shown UI 10 stated the highest right turning motorist during afternoon (17:00-18:00) with 244 veh/hr meanwhile UI 9 and UI 2 obtained 62 veh/hr and 34 veh/hr respectively. This behaviour analysis describes the higher the turning volume (veh/hr) the more hazardous situation at UI, if without any traffic safety infrastructure.
- Despite of having minimum operating speed (V85) 73kph at UI 10 comparing with UI 2 (V85) 91kph as shown in Figure 9. The intersection UI 10 remain as a vulnerable unsignalized intersection in several perspective such as safety infrastructure, critical gap, higher turning volume, number of motorcycle and gap three patterns. Therefore, by implementing speed limit under 50kph might help reducing the conflict for right turn motorist as well as accident frequency.
- The motorcycle rider, appear to be significance variable in both right turning model (Model 4) and serious conflict model (Model 5) with 99% confident level. This indicate that RTM is rider likely to accept shorter gap and might trigger serious conflict with others vehicle. Meanwhile UI 10, was classified as the most hazardous unsignalized intersection base on the critical gap 4.75 seconds as compare with Malaysia Highway Capacity [24] 7.0 seconds and USHCM 2010 [25] 7.5 seconds. Furthermore gap 3 patterns, reveal as dangerous type of gap acceptance for right turning motorist with found significance in (Model 5) at 99% confidence level.
- This study suggests the element in gap three pattern such as average gap acceptance (Figure 14), distribution of accepted gap and rejected gap inform plot of spatial at UI 10 (Figure 17) and determination of critical gap at UI in section 4 might be appropriate tool of measurement for the traffic safety planner or authorities in identifying the hazardous unsignalized intersection in the rural or urban region. Despite of traffic approach consideration like number of causalities, level of service (LOS) and number traffic crossing, ontological approach in serious conflict due lane change and visualization spatial plot at UI 10 also can be implement in decision making for improving the UI condition.
- This study like to recommend an installation of video camera at hazardous intersection could benefit the traffic planner and researcher in understanding the traffic behaviour, scrutinize the problem and suggest the appropriate strategies to overcome the traffic conflict and ensure the efficiency of traffic flow. Consequently, using ontology, supply chain and visualization approach might assist the traffic data management in term of decision making and security. In addition, controlling traffic via artificial intelligent can improve the traffic flow, reducing traffic conflict, respond accident quickly and provide priority to emergency vehicles.
Conclusion
A far as this research concern the behaviour of serious conflict due lane change attribute was gap three patterns, approach speed over 50 kph, RTM is motorcycle rider, accepted gap associate with conflict less than 6 seconds and RTM is motorcycle stops near passenger car on minor road.
The study found gap three pattern stated highest normalized importance variables (100%) for Artificial Neuron Network Model. As well as all Logistic Regression Models with significant level of (99%). Speed limit over 50kph, right turn motorist is rider and motorcycle stop near passenger car obtained normalized important 59.40%, 55% and 53.10% respectively. Meanwhile in regression model all parameter achieved significant level 99% excluding motorcycle stop near passenger car with 95%.
This suggests that a combination of both methods, ANN and LRM, could be complementary, especially in explaining the outcomes and determine critical gap while this combination may be a sustainable hydrodynamic in the application of artificial neuron networks in other research.
To avoid serious conflict, due to the situation of motorcycles as RTMs stopping near passenger cars, it is essential to develop segregations lane and box between motorcycles and other vehicles at unsignalized intersections. To reduce the number of serious conflict due to lane change, speed limits under 50 kph probably implemented and enforced at all unsignalized T-junctions. Road safety facilities such as right turning channelization on primary roads are recommended, implementing intelligent traffic signal and encourage installing video camera at high-risk unsignalized intersection. Those action is necessary to avoid traffic conflict, thus reducing the number of serious conflicts and causalities.
In this study, the present researcher recommends using the ontology, visualization spatial plot, average gap three pattern, and critical gap as measurements or research instruments to determine risky unsignalized T-Junctions, particularly roads in rural or urban areas. Visualization using spatial plot between approach speed and distribution gap (accepted and rejected) at UI 10 has been recognize as a novelty tool in identifying critical UI.
In the light of this research work, the work has ability to make a basic comparison between three scientific statistical approach (logistic regression, artificial neuron network and structural equation modelling). Those method has their own advantage and disadvantage, that can be complement each other. This finding might benefit researcher to discover more understanding about those analytic method and implementation in the further research work.
The motivation of this study is to introduce ontology approach in transportation which concentrating on right turning motorist, conflict situation and lane change at unsignalized intersection. The challenge of the ontology researcher is to identify new id for right turning motorist to vehicular communication in internet-of-vehicle (IoV).
Acknowledgement
This work was supported by the Ministry of Higher Education, Malaysia FRGS/1/2019/TK08/MMU/03/1 and TMRND Grant MMUE/190012.
References
- LI Wan-long, FANG Wei, ZHENG Shan-hong. (2007). “Key technology study of ontology-based information integration.” Journal of Northeast Normal University (Natural Science Edition), 39:41-45.
Publisher | Google Scholor - Preece A, Hui K, Gray A, (2001). “KRAFT: an agent architecture for knowledge fusion,” International Journal of Cooperative Information Systems, 10:171-195.
Publisher | Google Scholor - Viktorovi´c, M.; Yang, D.; de Vries, B. (2020). Connected Traffic Data Ontology (CTDO) for Intelligent Urban Traffic Systems Focused on Connected (Semi) Autonomous Vehicles. Sensors, 20:2961.
Publisher | Google Scholor - Hwang, S. (2023). Ontology-Based Spatial Clustering Method: Case Study of Traffic Accidents 2003.
Publisher | Google Scholor - LI Ruimin, LU Huapu, SHI Qixin. (2005). “Study on Intelligent Transportation Integrated Information Platform”. Central South Highway Engineering, 30:30-33.
Publisher | Google Scholor - YANG Zhao-sheng, WANG Shuang, MA Dao-song. (2006). “Review of Basic Traffic Data Fusion Methods”. Journal of Highway and Transportation Research and Development, 23:111-116.
Publisher | Google Scholor - Janowicz K, Haller A, Cox SJ, Le Phuoc D, Lefrancois ¸ M. (2019). Sosa: A lightweight ontology for sensors, observations, samples, and actuators. Journal of Web Semantics 56:1-10.
Publisher | Google Scholor - Jawhar I, Mohamed N, Al-Jaroodi J (2018). Networking architectures and protocols for smart city systems. Journal of Internet Services and Applications, 9(1):26
Publisher | Google Scholor - Gasmi R, Aliouat M. (2019) Vehicular ad hoc networks versus internet of vehicles-a comparative view. In :2019 International Conference on Networking and Advanced Systems (ICNAS), IEEE, 1-6
Publisher | Google Scholor - Anwer MS, Guy C. (2014). A survey of vanet technologies. Journal of Emerging Trends in Computing and Information Sciences, 5(9):661-667
Publisher | Google Scholor - Jiang R, Zhu Y. (2019). Wireless Access in Vehicular Environment. Springer International Publishing, Cham, 1-5
Publisher | Google Scholor - Chhabra S, Bali RS, Kumar N. (2015). Dynamic vehicle ontology-based routing for vanets. Procedia Computer Science, 57:789-797
Publisher | Google Scholor - Zekri A, Jia W (2018). Heterogeneous vehicular communications: A comprehensive study. Ad Hoc Networks, 75:52-79
Publisher | Google Scholor - Bermudez-Edo M, Elsaleh T, Barnaghi P, Taylor K. (2016). Iot-lite: a lightweight semantic model for the internet of things. In 2016 Intl IEEE Conferences on Ubiquitous Intelligence & Computing, Advanced and Trusted Computing, Scalable Computing and Communications, Cloud and Big Data Computing, Internet of People, and Smart World Congress (UIC/ATC/ScalCom/CBDCom/IoP/SmartWorld). IEEE, 90-97
Publisher | Google Scholor - O.I Olayode., L.K Tartibu., M.O Okwu. (2020). Application of Artificial in Traffic Control System of Non-autonomous Vehicles at Signalized Road Intersection, Science Direct Procedia CIRP 91, 194-200.
Publisher | Google Scholor - Ed.Kuala Lumpur (2021). PDRM, “Laporan Tahunan PDRM 2021 (Royal Malaysia Police Annual Report, 2021)”.
Publisher | Google Scholor - Abdul Manan, M.M., and Andras Varhelyi. (2012). Motorcycle fatalities in Malaysia., International Association of Traffic and Safety Science, 36(1):30-39.
Publisher | Google Scholor - Abdul Manan, M. M., Ho, J. S., Syed Tajul Arif. et al. (2017) Factors associated with motorcyclists’ speed behaviour on Malaysian roads. Transportation Research Part F: Traffic Psychology and Behaviour, 50:109-127.
Publisher | Google Scholor - Fajaruddin M., and Fujita, M. (2011). Development of Accident Predictive Model for Rural Roadway. An International Journal of Science, Engineering and Technology, 58.
Publisher | Google Scholor - Fajaruddin, M., Fujita, M., and Wisetjindawat, W. (2013). Analysis of Fatal-Serious Accidents and Dangerous Vehicle Movements at Access Points on Malaysia Rural Federal Roads. Japan Society of Civil Engineers Journal (D3), 69(4):286-299.
Publisher | Google Scholor - Nagalla, R., Pothuganti, P., and Pawar. D. S. (2017). Analyzing Gap Acceptance Behavior at Unsignalized Intersections Using Support Vector Machines, Decision Tree and Random Forest. ScienceDirect, Procedia Computer Science. 109C:474-481.
Publisher | Google Scholor - Fajaruddin, M., Azlan A. A., Motohiro, F., Wisinee, W., Mohammad. et al. (2021). An Analysis of Right-Turning Vehicles and Gap Acceptance Behaviour on Malaysia Rural Roads. International Journal of Road Safety 2(1):45-53.
Publisher | Google Scholor - Gattis, J.L.S.T., (1998). Gap acceptance at non-standard controlled intersections. University of Arkansas, Mack-Blackwell National Rural Transportation Study Center. Fayetteville, AR.
Publisher | Google Scholor - Highway Capacity Manual. (2010). Transportation Research Board of the National Academies. Washington D.C.
Publisher | Google Scholor - Jabatan Kerja Raya (JKR), Arahan teknik jalan no. 11/87 (1987). A Guide on Geometric Design of Road, Ministry of Work Malaysia, Kuala Lumpur.
Publisher | Google Scholor - Hu, L., & Bentler, P. M. (1998). Fit indices in covariance structure modelling: Sensitivity to under parameterized model misspecification. Psychological Methods, 3:424-453.
Publisher | Google Scholor - Hair, J. F. (2010). Multivariate data analysis: a global perspective. Upper Saddle River, New Jersey, USA: Person Prentice Hall.
Publisher | Google Scholor

