Research Article
Monitoring the trends of Carbon Monoxide and Tropospheric Formaldehyde in The State of Edo using Sentinel-5P and Google Earth Engine from 2018 – 2023
- Uwadea Gracious Aigbogho *
- Alex Enuneku
- Chika Floyd Amaechi
- Oziofu Ayamezimi Ehinlaiye
Department of Environmental Management and Toxicology, Faculty of Life Sciences, University of Benin, Benin.
*Corresponding Author: Uwadea Gracious Aigbogho, Department of Environmental Management and Toxicology, Faculty of Life Sciences, University of Benin, Benin.
Citation: Aigbogho.U. G, Enuneku.A, Amaechi.C. F, Ehinlaiye.O.A. (2024). Monitoring the trends of Carbon Monoxide and Tropospheric Formaldehyde in The State of Edo using Sentinel-5P and Google Earth Engine from 2018 – 2023. Clinical Case Reports and Studies, BioRes Scientia Publishers. 7(1):1-10. DOI: 10.59657/2837-2565.brs.24.172
Copyright: © 2024 Uwadea Gracious AIGBOGHO. Umoru, this is an open-access article distributed under the terms of the Creative Commons Attribution License, which permits unrestricted use, distribution, and reproduction in any medium, provided the original author and source are credited.
Received: August 02, 2024 | Accepted: August 29, 2024 | Published: September 20, 2024
Abstract
This research was carried out to assess the concentrations of Carbon monoxide (CO) and Formaldehyde (HCHO) in The State of Edo, Southern Nigeria. Secondary data collection method was used for the assessment and levels of CO and HCHO was extracted annually from Google Earth Engine using information from Sentinel-5-P satellite data (COPERNISCUS/S5P/NRTI/L3_). A comparison of the levels of CO and HCHO was done from the year 2018 to the year 2023. Results showed that the annual mean concentrations of CO ranged from ‘0.0467056 mol/m2’ to ‘0.05341641 mol/m2’, the highest concentrations were found in the year 2018 and the lowest were found in the year 2023; the implications of this higher concentration are that it may lead to the formation of carboxyhemoglobin thereby decreasing the capacity of the blood to transport oxygen, lung cancer, heart problems, respiratory conditions and damage to other organs. Annual mean concentrations of HCHO ranged from ‘0.000189265 mol/m2’ to ‘0.00021871 mol/m2’ which may be due to biomass burning and methane combustion, and can cause nasopharyngeal cancer in humans. Constant monitoring of the air quality and atmospheric pollutants to ensure early detection of a decrease or increase in the concentration of atmospheric pollutants, implementation of an air pollution control policies, spatial data collection, air quality modelling, hotspot identification and source distribution using the geographic information system (GIS), promotion of cleaner technologies including the use of low-emission vehicles, renewable energy sources, energy efficient processes, public awareness and education on the impact of atmospheric pollutants and the human contributions to the increasing production of atmospheric pollutants is highly recommended.
Keywords: geographic information system; spatial distribution; google earth engine; air pollution; carbon monoxide; formaldehyde
Introduction
Air pollution is one of the world's greatest concerns today both in developed and/or developing countries (Saxena and Sonwani, 2019). According to World Health Organization, air pollution has one of the utmost environmental threats to health (W.H.O., 2022), and it is the discharge of pollutants into the atmosphere, these pollutants have negative effects to the health and wellbeing of humans and the planet en bloc (N.R.D.C., 2023). Air pollution can have serious expenses, drawbacks and concerns for the health and wellbeing of humans and equally callously distresses the natural bio-complex network and ecosystems as a whole, it has several impacts and they include the formation of acid rain, smog, ozone depletion, global warming etc. (Ashfaq and Sharma, 2012). Formaldehyde (HCHO) is a combustible, bleak and colorless gas at room temperature and has a sharp, pungent and suffocating smell (Dan et al.,2020), is very soluble in water, alcohols, and other polar solvents (Subasi, 2020) with a relatively short lifespan of a few hours (Freitas and Fornaro, 2022). HCHO is a volatile organic compound and Volatile Organic Compounds (VOCs) are compounds that easily disperse in the atmosphere and have a high vapour pressure with low boiling points (Carroll and Kirschman, 2022). HCHO is a significant trace gas in the atmosphere (Freitas and Fornaro, 2022), and a valuable indicator of biogenic, pyrogenic and anthropogenic hydrocarbon emanations in the atmosphere, as it is an intermediary product of the oxidation of a massive amount of non-methane volatile organic compounds (De Smedt et al., 2010). It is one of the commonly found carbonyl in the troposphere, is a transitional result of the oxidation of several VOCs, and it plays a vital role in numerous photochemical processes both as a source and a sink of free radical (Wu et al., 2023), the atmospheric concentration of HCHO increases with increasing urbanization and industrial pollution (Yuan et al., 2023). HCHO is frequently found in the environment as a result of naturally occurring processes, such as forest fires, and is emitted into the atmosphere through industrialized emissions, incineration, and the combustion of fuel etc. (C.A.R.B., 2020). It is also a constituent of several usable and consumable everyday domestic products such as antiseptics, medicines, cosmetics, dish-washing liquids, fabric softeners, shoe-care agents, carpet cleaners, glues and adhesives, lacquer (Kim et al., 2011). The main source of HCHO in remote atmosphere is via the oxidation of methane (CH4) and the photochemical oxidation of VOCs in the troposphere (Guo et al., 2021). Carbon monoxide (CO) is a colorless, invisible, mild, odorless, tasteless and toxic gas formed as a result of the partial combustion of carbonaceous fuels such as wood, natural gas and petrol, charcoal kerosene and can be detrimental when inhaled in large sums (Penney et al., 2010), it results from a diversity of natural (volcanoes and burning of biomass) and anthropogenic sources (automobile and industrial fossil fuel combustion) (Saxena and Sonwani, 2019). CO is particularly unsafe because of its ability to go undetected with a non-specific characteristic appearance, and because it is impossible to see, taste or smell the toxic fumes, CO can kill before you are conscious or realize it is in your home, victims exposed to CO may get sick or die before recognizing that they are exposed to it (Sircar et al., 2015). The effects of CO exposure differ significantly amongst individuals based on factors such as age, general health, the concentration and duration of exposure (United States Environmental Protection Agency, 2000). Common indicators of exposure to CO include headache, dizziness, fatigue, nausea, vomiting, and chest pain (Sircar et al., 2015). Exposure to CO can have a range of health impacts, from mild effects on the heart and nervous system at low concentrations to unconsciousness and death at higher concentrations following either acute or chronic exposure (Raub et al., 2000). The chief adverse effect of CO is on the health of humans where it combines with the component of the blood known as haemoglobin. The resultant substance, carboxyhemoglobin, has been stated to seriously cause vastly harmful effect on the human blood circulatory system (Okedere et al., 2021). Google officially introduced Google Earth (GE) in 2005 as a “geobrowser”, and Google Earth Engine (GEE) a cloud computing platform with significant computational competencies was released in 2010 (Zhao et al., 2021) and developed to hoard and process vast data sets (at petabyte-scale) for analysis and decisive decision making (Mutanga and Kumar, 2019). The cloud computing-based GEE platform is useful for monitoring air pollutants and chemical components in the atmosphere (Halder et al., 2023). GEE offers a scalable, cloud-based, geospatial retrieval and processing platform, this platform necessitates an account to right to use, and it is free for educational and research purposes, offers access to the enormous majority of freely and easily available, public, multi-temporal remote sensing data and offers unrestricted cloud-based computational command for geospatial data inquiry (Yang et al., 2022). It also offers contact with satellite and other ancillary data, cloud computing, and algorithms for processing great sums of data with relative easiness, offers improved chances for undertaking earth observation studies (Kumar and Mutanga, 2018). Industrialization and urbanization, as well as the quest for a better life has significantly affected the environment and increased the concentration of atmospheric pollutants in The State of Edo over the years. Significant changes in the climate pattern have also been experienced over the years and this could be due to vehicular emissions as the use of vehicles increased over the years or via industrial pollution or combustion emissions. One of the biggest issues with today's environment and public health is vehicle emissions, particularly in developing nations like Nigeria (Raji et al., 2021).
The aim of this study was to extract levels of CO and HCHO from 2018 to 2023 using Google Earth Engine, to compare the variations of CO and HCHO in The State of Edo from 2018 to 2023, and to determine the impact of urbanization and industrialization on the levels of CO and HCHO in The State of Edo, Nigeria.
Materials and Methods
Study Area
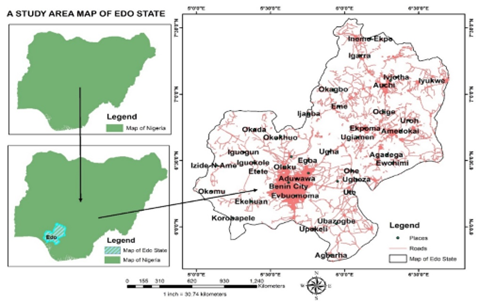
The study area The State of Edo (Figure 1) was created on the 27th of August, 1991, by the President Badamosi Babangida government and was expunged from the earlier Bendel State to gratify the people’s distress for a state of their own (Ogunleye, 2010). The State of Edo which is located in the south-south geopolitical region of the country Nigeria with Benin City as its capital. It is confined by latitude (06° 11″ N, 06° 27″ N; Southern and Northern boundaries) and longitude (005° 31″ E and 005° 44″ E; Western and Eastern boundaries) (Akinnibosun et al., 2023). The State of Edo experiences a typical tropical climatic condition usually with dualistic main seasons: the distinct wet (rainy) which lasts from April to November and the dry seasons which lasts from December to March (Ogunleye, 2010). It also experiences a high temperature, humidity and significant rainfall, making it appropriate for agriculture, farming and cultivation but also vulnerable to weather-related problems such as flooding.
Figure 1: A map of the study area depicting several locations in the State of Edo Data type and source
The type of data employed for this research is the RASTER data, a secondary data. A secondary data which is an information obtained directly from the google earth engine as its source. GEE is a virtual platform made to allow remote sensing users easily achieve vast data analyses without increasing the request for local computing resources (Ermida et al., 2020). This study relied only on the RASTER data gotten from GEE using information from satellite data (COPERNISCUS/S5P/NRTI/L3_), GEE combines a multi-petabyte catalog of satellite imagery and geospatial datasets with planetary-scale analysis capabilities (Earth engine data catalogs). The Sentinel 5P satellite houses the passive grating imaging spectrometer called the TROPOspheric Monitoring Instrument (TROPOMI). Data gotten from Sentinel 5P and those generated from field measurements have been seen to display substantial relationship which affirms the value of data gotten from the Sentinel 5P repository.
Method of data collection
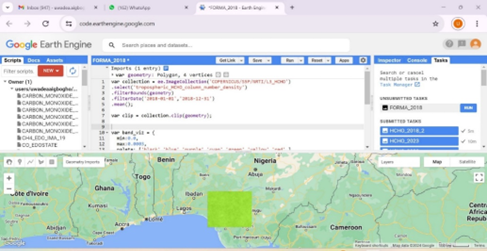
The study area ‘The State of Edo’ was created using the earth engine code editor a specific tool within the GEE which works with scripts and codes. Script for the atmospheric pollutants (CO and HCHO were written in javascript (COPERNISCUS/S5P/NRTI/L3_), with the ‘filterDate’ = ‘date range’ (Figure 2) from the year 2018 to the year 2023 respectively. The geometry of the study location is highlighted, saved and RUN, and a RASTER imagery file of the study area is generated after the task has been completed with a ‘projection and extent’ in the Geographic Tagged Image File Format (.tiff) and downloaded from the google drive and saved into folders. The RASTER data was collected annually for each pollutant with the ‘filterDate= year-01-01; year-12-31’.
Figure 2: An image depicting the (a) Google Earth Engine environment (b) Earth engine code editor scripts (c) geometry of the study area (d) completed RUN tasks.
Method of analysis
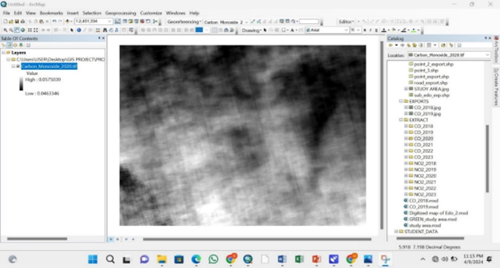
The raster imagery generated from the google earth engine was downloaded from the google drive and imported into ArcMap (Figure 3) where the raster image was projected to the ‘Universal Transverse Mercator’ (UTM) as before a data can be a GIS data, it must be projected. The study area ‘The State of Edo’ extracted from the raster image was used to analyze and monitor the spatial distribution of CO and HCHO from the year 2018 to the year 2023. The analyzed data was classified into three (3) classes: ‘Low’, ‘Medium’ and ‘High’ and visualized into the different colors.
Figure 3: An image depicting the raster imagery generated from the google earth engine and imported into the ArcMap environment.
Results
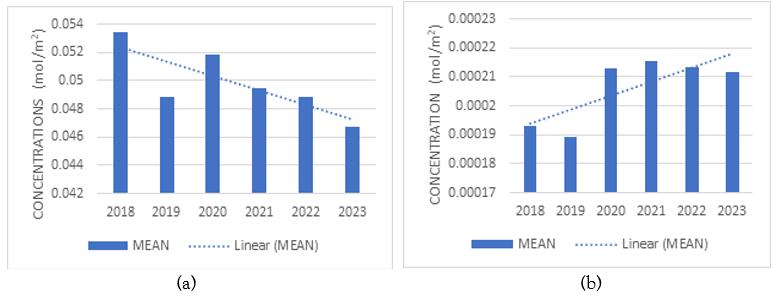
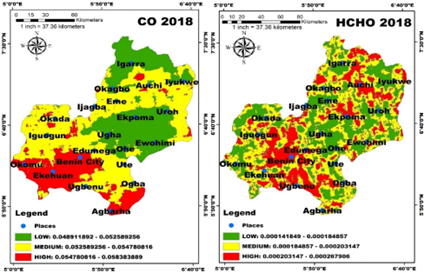
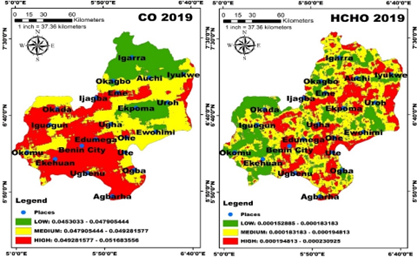
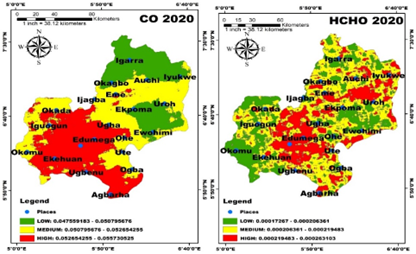
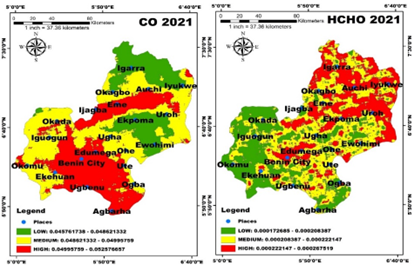
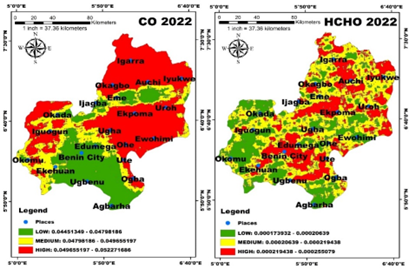
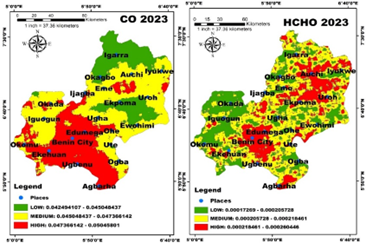
The range of concentrations of CO in The State of Edo using Sentinel-5P from the year 2018 to the year 2023 was ‘0.048911892 – 0.058383889 mol/m2’, ‘0.0453033 – 0.051683556 mol/m2’, ‘0.047559183 – 0.055730525 mol/m2’, ‘0.045761738 – 0.052576657 mol/m2’, ‘0.04451349 – 0.052271686 mol/m2’ and ‘0.042494107 – 0.05045801 mol/m2’ respectively (Figure 4(a)) as compared to the range of concentrations of HCHO which ranges from the year 2018 to the year 2023 as ‘0.000141849 – 0.000267906 mol/m2’, ‘0.000152885 – 0.000230925 mol/m2’, ‘0.00017267 – 0.000263103 mol/m2’, ‘0.000172685 – 0.000267519 mol/m2’, ‘0.000173932 – 0.000255079 mol/m2’ and ‘0.00017269 – 0.000260446 mol/m2’ respectively (Figure 4 (b)). As averaged over 2018 – 2023, the annual mean concentrations of CO ranged from ‘0.0467056 mol/m2’ to ‘0.05341641 mol/m2’ (Figure 4(a)) while the annual mean concentration of HCHO ranged from ‘0.000189265 mol/m2’ to ‘0.00021871 mol/m2’ (Figure 4 (b)). The highest and lowest mean concentration of CO occurred in the year 2018 and 2023 respectively (Figure 4(a)) and the highest and lowest mean concentration of HCHO occurred in the year 2021 and 2019 respectively (Figure 4 (b)).
Figure 4: Annual mean concentrations for: (a) CO (b) HCHO
Annual comparison of CO and HCHO
Figure 5: Spatial distribution of Carbon Monoxide (CO) and Formaldehyde (HCHO) in The State of Edo in the year 2018.
Figure 6: Spatial distribution of Carbon Monoxide (CO) and Formaldehyde (HCHO) in The State of Edo in the year 2019.
Figure 7: Spatial distribution of Carbon Monoxide (CO) and Formaldehyde (HCHO) in The State of Edo in the year 2020.
Figure 8: Spatial distribution of Carbon Monoxide (CO) and Formaldehyde in The State of Edo in the year 2021.
Figure 9: Spatial distribution of Carbon Monoxide (CO) and Formaldehyde (HCHO) in The State of Edo in the year 2022.
Figure 10: Spatial distribution of Carbon Monoxide (CO) in The State of Edo in the year 2023.
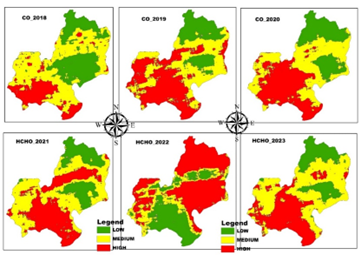
Figure 11 (a): Annual interpolation map for CO from the year 2018 to the year 2023
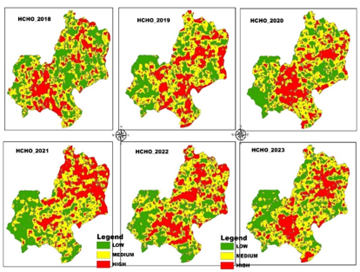
Figure 11 (b): Annual interpolation map for HCHO from the year 2018 to the year 2023
Discussion
Spatial variations in the concentrations of CO and HCHO within the study area ‘The State of Edo’ was observed annually through the six-years (2018 - 2023) comparison using images resultant from the analyses and visualization by the ArcMap and acquired through the Google Earth Engine platform.
Highest concentration of CO was recorded in the year 2018 with a concentration of ‘0.058383889 mol/m2’, however Okoduwa and Amaechi (2023) recorded lower values of ‘0.0554 mol/m2’ as the highest annual concentration of CO in Benin City, a capital city of the study area ‘The State of Edo’. This higher value of CO in this study is due to the occurrence of biomass burning as reported by Mekaumnuaychai et al. (2020) and vehicular exhaust emission resultant from the recurrent traffic jams from the poorly conserved roads, high traffic concentration, disparaging traffic control, poor traffic restraint and very little wind promptness as identified by Ukpebor et al. (2010). The implications of this higher concentration is that it may lead to lung cancer, heart problems, respiratory conditions and damage to other organs (Goselle and Ibanga, 2019), it can also affect the health of humans by reducing oxygen levels to use organs and tissues in the human body, which can result in chest pain, heart pain (Nayan et al., 2023).
Suhardono et al. (2023) reported in his study that high population mass as well as the dynamics of prevailing activities can impact air quality of the area of concern and that high concentrations of CO are inadequate for the well-being of humans and the environment and the presence of excessive concentrations of CO in the troposphere is one of the causes of global warming. It was also noted in his study that the highest pre-pandemic average and total CO concentration levels were 0.042 and 1.0198 mol/m2 in Yogyakarta, respectively, whereas the lowest during the pandemic were 0.02845 and 0.6828 mol/m2 in Surabaya. The authors observed substantial alteration in the mean values of CO between the two preceding periods (before and during the pandemic) with values of 0.03544 and 0.02845 mol/m2 respectively. High concentrations of CO in the year 2018 covered an area of ‘379507.192806’ hectares with a percentage concentration of ‘19.3386%’, areas found within this area including Benin City, Ekehuan, Okomu and Agbarha may be areas at a distance from main roads or garages or industrial shacks as reported in a study carried out by Gizaw and Teka (2020). The annual concentration of CO in year 2020 ranges from of ‘0.0475592 - 0.0557305’ mol/m2 as opposed to the annual values gotten in Java and ranges from 0.021 – 0.035 mol/m2 which were quite influenced by changes of a built-up environment as reported by Nugroho (2023).
Highest concentration of HCHO was recorded in the year 2021 with a concentration of ‘0.000215676 mol/m2’, which may be due to biomass burning and methane combustion as reported by Liu el. (2020). Health implication of increased formaldehyde (HCHO) concentration is that breathing in air contaminated with HCHO can cause nasopharyngeal cancer in humans as classified by the International Agency for research on Cancer (IARC) and reported by Reingruber and Pontel (2018). High concentrations of Formaldehyde (HCHO) in 2021 covered an area of ‘593136.867807’ hectares with a percentage concentration of ‘30.2255%’. Areas found within this area may include areas with high vegetation cover or intense human activities as reported by Huang et al. (2023).
Higher concentrations of CO were recorded relative to the concentrations of HCHO over the period of six (6) years and this possibly will be due to the shorter lifespan of HCHO of a few hours as compared to the 1-2 months’ lifespan of CO as observed in the study carried out by Zeng et al. (2015) and the key routes via which HCHO is lost in the atmosphere is by photolysis and reaction with the hydroxyl radical (OH) as reported by Lei et al. (2008). Although the concentrations of CO and HCHO in The State of Edo varied significantly, areas including Ekpoma, Uroh, Ugha, Igarra, Ewohimi and Ohe remained within the areas of LOW concentrations for both atmospheric pollutants in the year 2018, Igarra, Iyukwe, Auchi, Okagbo and Uroh remained within the areas of LOW concentrations for both atmospheric pollutants in the year 2019, Edumega, Benin City, Eme and Agbarha remained within the areas of HIGH concentrations; only Ute remained within the areas of MEDIUM; Igarra, Auchi, Okagbo, Ewohimi remained within the areas with LOW concentrations for both atmospheric pollutants in the year 2020, Edumega and Benin City remained within the areas of HIGH concentrations for both atmospheric pollutants in the year 2021, Agbarha, Okomu, Okada and Edumega remained within the areas of HIGH concentrations for both atmospheric pollutants in the year 2022, Agbarha, Edumega and Benin city remained within the areas of HIGH concentrations for both atmospheric pollutants in the year 2023.
Conclusion
Higher concentrations of CO were observed through the six (6) year’s period as compared to the highly abundant and prevalent HCHO which may be due to its short life span or the different chemical behaviors of both pollutants. High concentrations of the atmospheric pollutants CO and HCHO were resultant of the increasing urbanization, quest for better living and human activities including transportation and the combustion of wood as fuels. Health implications associated with the pollutants include lung cancer, heart problems, respiratory conditions, damage to other organs and nasopharyngeal cancer in humans.
References
- Akinnibosun, H. A., Onyekwere, C. C., Ebun-Igbeare, E. O. and Ekevwo, P. O. (2023). Assessment of air pollution usin gplant chlorophyll concentration reduction criterion in Benin city, The State of Edo. African Scientist Journal, 24(2):155-162.
Publisher | Google Scholor - Ashfaq, A. and Sharma, P. (2012). Environmental effects of air pollution and application of engineered methods to combat the problem. Journal of Industrial Pollution Control, 29(1): 4.
Publisher | Google Scholor - California Air Resources Board (2020).
Publisher | Google Scholor - Carroll, G T. and Kirschman, D. L. (2022). A peripherally located air recirculation device containing an activated carbon filter reduces VOC levels in a simulated operating room. PubMed, 7(50):46640v- 46645.
Publisher | Google Scholor - Dan, S., Pant, M., Kaur, T. and Pant, S. (2020). Toxic effect of formaldehyde: a systematic review. International Research Journal of Modernization in Engineering Technology and Science, 2(9):11.
Publisher | Google Scholor - De Smedt, I., Stavrakou, T., Muller, J-F., Van der, R. J. and Van Roozendael, A. M. (2010). Trend detection in satellite observations of formaldehyde tropospheric columns. Geophysical Research Letters, 37(18):5.
Publisher | Google Scholor - Ermida, S. L., Soares, P., Mantas, V., Gottsxhe, F-M. and Trigo, I. F. (2020). Google earth engine open-source code for land surface temperature estimation from the Landsat series. Remote Sensing, 12(9):21.
Publisher | Google Scholor - Freitas, A. D. and Fornaro, A. (2022). Atmospheric formaldehyde monitored by TROPOMI satellite instrument throughout 2020 over Sao Paulo state, Brazil. Remote Sensing, 14(13):17.
Publisher | Google Scholor - Gizaw, Z. and Teka, Z. (2020). Correlates of indoor concentration of carbon monoxide in residential buildings in Gondar town, Northwest Ethiopia. Environmental Health Insights, 14:10.
Publisher | Google Scholor - Goselle, N. T. amd Ibanga, O. A. (2019). Geospatial variation of weather parameters and air quality at Ologbo flow station in The State of Edo, Nigeria. Trends in Science and Technology Journal, 4(2):490-494.
Publisher | Google Scholor - Guo, Y., Wang, S., Zhu, J., Zhang, R., Gao, S., Saiz-Lopez, A. and Zhou, B. (2021). Atmospheric formaldehyde, glyoxal and their relations to ozone pollution under low- and high- NOx regimes in summertime Shanghai, China. Atmospheric Research, 258:10.
Publisher | Google Scholor - Halder, B., Ahmadianfar, I., Heddam, S., Mussa, Z. H., Leonardo, G., Tan, M. L., Sa’adi, Z., Al-Khafaji, Z., Al-Ansari, N., Jawad, A. H. and Yaseen, Z. M. (2023). Machine learning-based country-level annual air pollutants exploration using Sentinel-5p and google earth engine. Scientific Reports, 13:19.
Publisher | Google Scholor - Huang, H., Xi, G., Ji, F., Liu, Y., Wang, H. and Xie, Y. (2023). Spatial and temporal variation in vegetation cover and its response to topography in the Selinco region of the Qinghai-Tibet Plateau. Remote Sensing,15(16).
Publisher | Google Scholor - Kim, K. H., Jahan, S. A. and Lee, J. T. (2011). Exposure to formaldehyde and its potential human health hazards. Journal of Environmental Science and Health, Part C, 29(4):277-299.
Publisher | Google Scholor - Kumar, L. and Mutanga, O. (2018). Google earth engine applications since inception: usage, trends and potential. Remote Sensing, 10(10):15.
Publisher | Google Scholor - Lei, W., Zavala, M., de Foy, B., Volkamer, R., Molina, M. J. and Molina, L. T. (2008). Impact of primary formaldehyde on air pollution in the mexico city metropolitan area. Atmospheric Chemistry and Physics, 8:19635-19635.
Publisher | Google Scholor - Meekaumnuaychai, T., Suranowarartg, K., Kanabkaeew, T. and Lalitaporn, P. (2020). Observations of atmospheric carbon monoxide and formaldehyde in Thailand using satellites. EnvironmentAsia, 13:18-25.
Publisher | Google Scholor - Mutanga, O. and Kumar, L. (2019). Google earth engine applications, Remote Sensing, 11(5):4.
Publisher | Google Scholor - N.R.D.C. (2023). Air pollution: everything you need to know.
Publisher | Google Scholor - Nayan, N., Mohmadisa, H., Saleh, Y., Mahat, H., Said, Z. M., Suhaili, S. and Luyan, M. H. (2023). The investigation of carbon monoxide concentration at selected areas in the federal territory Kuala Lumpur, Malaysia. Ecological Engineering and Environmental Technology, 24(3): 221-232.
Publisher | Google Scholor - Nugroho, R. T. (2023). Analysis of the effect of large population on nitrogen dioxide and carbon monoxide levels in Java Island using sentinel-5p. Earth and Environmental Science, 13.
Publisher | Google Scholor - Ogunleye, O. S. (2010). Determinants of rural development in The State of Edo, Nigeria: an overview. African Research Review, 4(1):298-308.
Publisher | Google Scholor - Okedere, O. B., Elehinafe, F. B., Oyelami, S. and Ayeni, A. O. (2021). Drivers of anthropogenic air emissions in Nigeria- a review. Heliyon, 7(3):13.
Publisher | Google Scholor - Okoduwa, K. A. and Amaechi, C. F. (2023). Monitoring and mapping of atmospheric concentration of carbon monoxide, sulphur dioxide and nitrogen dioxide from 2019-2022 in Benin City, Southern Nigeria. Journal of Applied Sciences and Environmental Management, 27(12):2715-2722.
Publisher | Google Scholor - Penney, D., Benignus, V., Kephalophoulos, S., Kotzias, D., Kleinman, M. and Verrier, A. (2010). Carbon Monoxide. In: WHO guidelines for indoor air quality: selected pollutants, The WHO European centre for Environment and health, Bonn Office. Euroupe, 55-89.
Publisher | Google Scholor - Raji, W., Jimoda, L. A., Odobor, J. K. and Popoola, A. O. (2021). Assessment if vehicular- induced emissions in some selected areas in BENIN City, The State of Edo, Nigeria. Journal of Applied Sciences and Environmental Management, 25(8):1535-1539.
Publisher | Google Scholor - Raub, J. A., Mathieu-Nolf, M., Hampson, N. B. and Thom, S. R. (2000). Carbon monoxide poisoning- a public health perspective. Toxicology, 145(1):1-14.
Publisher | Google Scholor - Reingruber, H. and Pontel, L. B. (2018). Formaldehyde metabolism and its impact on human health. Current Opinion in Toxicology, 9:28-34.
Publisher | Google Scholor - Saxena, P. and Sonwani, S. (2019). Criteria air pollutants and their impact on environmental health, Springer Nature. Singapore, 169.
Publisher | Google Scholor - Sircar, K., Clower, J., Shin, M. K., Bailey, C., King, M. and Yip, F. (2015). Carbon monoxide poisoning deaths in the United States, 1999 to 2012. American Journal of Emergency Medicine, 33(9):7.
Publisher | Google Scholor - Subasi, N. T. (2020). Formaldehyde advantages and disadvantages: usage areas and harmful effects on human beings. Available at: https://www.intechopen.com/chapters/69211 (Date accessed: 20th April, 2024).
Publisher | Google Scholor - Suhardono, S., Septiariva, I. Y., Rachmawati, S., Matin, H. H. A., Qona’ah, N., Nirwana, B., Suryawan, W. K., Sari, M. M. and Prayogo, W. (2023). Changes in the distribution of air pollutants (carbon monoxide) during rhe control of covid-19 pandemic in Jakarta, Surabaya, and Yogyakarta, Indonesia. Journal of Ecological Engineering, 24(4): 151-162.
Publisher | Google Scholor - Ukpebor, E. E., Ukpebor, J. E., Eromomene, F., Odiase, J. I. and Okoro, D. (2010). Spatial and diurnal variations of carbon monoxide (CO) pollution from motor vehicles in an urban centre. Polish Journal of Environmental Studies, 19(4): 8170-823.
Publisher | Google Scholor - United States Environmental Protection Agency (2000). Air quality criteria for carbon monoxide, Office of Research and Development, Washington DC, 295.
Publisher | Google Scholor - W.H.O. (2022) : Ambient (outdoor) air pollution. Available at: https://www.who.int/news-room/fact-sheets/detail/ambient-(outdoor)-air-quality-and-health (Date accessed: 12th February, 2024).
Publisher | Google Scholor - Wu, Y., Huo, J., Yang, G., Wang, Y., Wang, L., Wu, S., Yao, L., Fu, Q. and Wang, L. (2023). Measurement report: production and loss of atmospheric formaldehyde at suburban site of Shanghai in summertime. Atmospheric Chemistry and Physics, 23:2997-3014.
Publisher | Google Scholor - Yang, L., Driscol, J., Sarigai, S., Wu, Q., Chen, H. and Lippitt, C. D. (2022). Google earth engine and artificial intelligence (AI): a comprehensive review. Remote sensing, 14(14):110
Publisher | Google Scholor - Yuan, Y., Wu, Y., Zhao, H., Ren, J., Su, W., Kou, Y., Wang, Q., Cheng, J. and Tong, Z. (2023). Tropospheric formaldehyde levels infer ambient formaldehyde-induced brain diseases and global burden in China, 2013-2019. Science of the Total Environment, 883:9.
Publisher | Google Scholor - Zeng, G., Williams, J. E., Fisher, J. A., Emmons, L. K., Jones, N. B., Morgenstern, O., Robinson, J., Smale, D., Paton-Walsh, C. and Griffith, D. W. T. (2015). Multi-model simulation of CO and HCHO in the southern hemisphere: comparison with observations and impact of biogenic emissions. Atmospheric Chemistry and Physics, 15(13):7217-7245.
Publisher | Google Scholor - Zhao, Q., Yu, L., Li, X., Peng, D., Zhang, Y. and Gong, P. (2021). Progress and trends in the application of google earth and google earth engine. Remote Sensing, 13(18):21.
Publisher | Google Scholor

