Review Article
Minimizing Unaccounted-for Water (UFW)
- Zakaria Yehia Ahmed *
Public Works, Civil Engineering, Thebes Academy, Athar al Nabi, Old Cairo, Cairo Governorate, Egypt.
*Corresponding Author: Zakaria Yehia Ahmed, Public Works, Civil Engineering, Thebes Academy, Athar al Nabi, Old Cairo, Cairo Governorate, Egypt.
Citation: Zakaria Y. Ahmed. (2024). Minimizing Unaccounted-for Water (UFW). Scientific Research and Reports, BioRes Scientia Publishers. 1(2):1-11. DOI: 10.59657/2996-8550.brs.24.007
Copyright: © 2024 Zakaria Yehia Ahmed, this is an open-access article distributed under the terms of the Creative Commons Attribution License, which permits unrestricted use, distribution, and reproduction in any medium, provided the original author and source are credited.
Received: March 05, 2024 | Accepted: April 25, 2024 | Published: May 06, 2024
Abstract
"Unaccounted for water", refers to the portion of water produced by a water utility system that is lost or untraceable within the distribution network before reaching consumers. The main objective of this paper is to explore ways to mitigate the occurrence of unaccounted for water usage in drinking water. This will be achieved through a methodical, multi-stage process that encompasses the implementation of measures such as leak detection, water flow measurement, meter repairs, prevention of clandestine connections, and enhancement of collection and billing processes.
This study has devised a methodology with the goal of assisting utilities in lowering Unaccounted-for Water (UFW) rates. This method is a systematic, multi-step approach that encompasses activities such as monitoring water flow, deploying leak detection measures, installing, and fixing meters, curtailing unauthorized connections, and streamlining billing and collections processes. The initiation phase involves choosing a pilot area, examining similar initiatives, conducting on-site visits, arranging meetings, establishing a timeline, creating and implementing base maps and water network plans, evaluating and comparing end-line results, and reporting findings. It is anticipated that a significant reduction in the percentage of Unaccounted-for Water will be achieved through the identification and correction of leaks.
Keywords: unaccounted for water; global positioning system; geographic information system; maps
Introduction
Unaccounted for Water (UFW) is the disparity between 'net production,' which represents the volume of water supplied to the domestic water distribution network, and 'consumption,' which denotes the volume of water legitimately used and accounted for assessment purposes. Unaccounted for water (UFW) denotes the difference between the supplied water and the water for which utilities receive payment. The American Water Works Association (AWWA) suggests using 10% as a standard benchmark for unaccounted-for water loss. UFW reduction increases drinking water supply. It is advised to focus on reducing losses falling between 10% and 25%, while losses exceeding 25% are deemed problematic and should be actively addressed. Typically expressed as a percentage of the water delivered to the relevant system, UFW is categorized into physical losses and non-physical or commercial losses. Physical losses encompass water lost directly from treatment plants, such as overflow from tanks and washing operations, as well as losses from the network due to leaky pipelines. Commercial losses arise from various sources, including inaccurate metering, unread meters, broken meters, unrecorded underflows, billing errors, customers without records, and both unauthorized and legal metered customers (e.g., government buildings, religious institutions, public taps).
This classification is applicable to the entire drinking water network, or a smaller section termed a hydraulic zone, defined as the network portion supplying a specific area with measurable and controllable inlets and outlets. Effective water management necessitates robust water governance, encompassing aspects like water resources for drinking water and services, ensuring sustainable water delivery to consumers. However, managing elevated rates of water loss or non-revenue water (NRW) poses a significant challenge in developing countries, impeding the fulfillment of consumer demands. Water loss within distribution systems also obstructs drinking water utilities from maintaining reasonable water tariffs and prices. According to Bahjat et al. (2019), the World Bank reports an annual volume of non-revenue water estimated at 45 million cubic meters in distribution networks in most developing countries. To address this concern, we formulated a methodology aimed at assisting drinking water utilities in reducing UFW rates. This systematic, multi-stage process involves activities such as implementing leak detection measures, measuring water flow, installing and repairing meters, enhancing billing and collection, and curbing illegal connections.
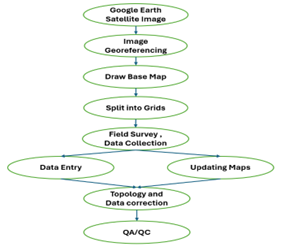
The pilot area is situated in the southern Egyptian city of Luxor. Begin the mapping process by generating maps from satellite images on Google Earth, and subsequently refine the coordinates through georeferencing. Construct a foundational map using a satellite image, segmenting the area into grids for enhanced field surveying. Conduct field surveys to gather data, followed by the initiation of map updates and data entry. Subsequently, refine the structure, rectify the data, and initiate quality assurance and quality control processes (Figure 1).
Figure 1: GIS data collection
Literature Review
Unaccounted-for Water (UFW) poses a significant challenge for water utilities globally, leading to resource wastage and financial losses. This literature review synthesizes current research and methodologies aimed at minimizing UFW, providing a comprehensive overview of strategies employed by utilities to address this issue. Key focus areas include measuring water flow, implementing leak detection measures, optimizing meter installations, curbing illegal connections, and improving billing and collections processes. The review explores various studies that highlight successful approaches in reducing UFW, emphasizing the importance of a structured, multi-stage process. Examination of pilot programs, field visits, and the development of base maps and water network plans emerges as essential components in the initiation phase. Additionally, this review analyzes the impact of technology in enhancing leak detection, evaluating the effectiveness of smart meters and advanced monitoring systems. Furthermore, the literature survey delves into the outcomes of similar initiatives worldwide, comparing end-line results and assessing the factors influencing the success or challenges faced in different contexts. The overarching goal is to provide insights into best practices and lessons learned in the endeavor to minimize UFW. This literature review consolidates valuable knowledge from diverse sources, offering a comprehensive understanding of the strategies, technologies, and methodologies employed to minimize Unaccounted-for Water. The findings aim to inform water utilities, policymakers, and researchers in their efforts to mitigate UFW, ultimately contributing to sustainable water resource management.
Methodology
The issue of Unaccounted for Water (UFW), encompassing all losses within the system, whether legal or illegal, often surpasses a substantial portion of the total produced drinking water. This exerts a significant strain on both utility operations and budgets, indicating considerable losses in revenue for these entities. The insufficient financial resources typically result in performance deficiencies within the facility, potentially impacting network components and the operation and maintenance of treatment plants. This study employed a comprehensive methodology, commencing with an examination of similar initiatives within the field. The process involved on-site visits to the designated area and the establishment of specialized teams and departments dedicated to the chosen region. Activities encompassed the maintenance of drinking water valves, the creation of measuring inspection rooms, and hands-on training for employees of the drinking water company in the utilization of leak detection equipment. A detailed timetable was developed, and a pilot area was selected based on specific criteria. The operational phases for the teams and departments encompassed diverse tasks, including field surveys, the execution of leak detection surveys, measurement of water flows and pressures, and the facilitation of leakage repairs led by drinking water facilities. Subsequent efforts focused on curbing illegal connections, replacing malfunctioning meters, and addressing other associated issues.
The integration of billing and leakage information with Geographic Information System (GIS) technology resulted in the creation of maps interconnected with leakage and billing data. Meter readers received training to enhance the precision of their readings, aiming to minimize unaccounted water loss. The investigation concluded with the examination and comparison of outcomes, leading to the development of an extensive report. GIS emerged as a vital tool in illustrating the drinking water network, mapping its various components, and enabling comparisons of consumption on different dates to gain valuable insights into both consumption patterns and financial losses. Combining meter data with spatial location and maps enabled the identification of variations in patterns of drinking water consumption, aiding in the detection of potential metering discrepancies and sources of unaccounted-for water (UFW). Through the analysis of spatial trends over time and the comparison of diverse historical records, a drinking water utility can pinpoint persisting UFW challenges, evaluate existing financial losses, and implement focused strategies to minimize such losses.
Area of Interest
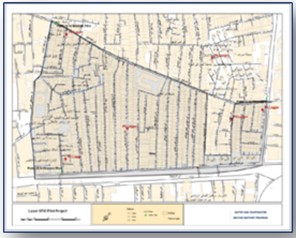
The study was conducted in an experimental area as in Figure 3, which is located on the western side of the city of Luxor in southern Egypt. This area has an area of 200,000 square meters and is defined by the following boundaries: The depicted study area in Figure 2 is situated on the western side of Luxor in southern Egypt, defined by Karnak Street to the north, Mill Book Street to the east, El-Sekka Street to the south, and Youssef Hassan Street to the west. The selection of this area was guided by specific criteria: it is situated in the historic city of Luxor, facilitating the identification of leaks in drinking water pipes. Access to the area is restricted, and limited traffic aids in detecting conventional leaks. It falls within the Clean and Ready Network section and highlights the number of connections without special preparations for government buildings. The red dots on the map pinpoint the locations of drinking water flow measurement points.
Figure 2: Study area.
The GIS team produced a map of the selected area using AutoCAD mapping, which was later converted into a GIS map. Field survey data were synchronized with their corresponding positions on the map, as depicted in Figure 3. This process involved extracting information from AutoCAD and satellite images, transforming it into GIS data, and ensuring consistency in coordinates and geographic projection. Geometric corrections and georeferencing were applied to the Google satellite image, utilizing ground control points from topographic maps for basemaps. Manual on-screen routing was employed to organize the output into distinct layers representing various GIS features, including home connections, meter locations, pipelines, valve locations, fire valve locations, buildings, and road lines. Vector data underwent digitization, error correction, and data entry. Visual on-screen verification and error correction, identification of missing data, display and coordination of the layers in the geographic information system, and geographical data analysis were also essential components of this procedure.
This involved establishing a geodatabase for the designated study area, evaluating unaccounted-for water (UFW), and generating maps and reports derived from field survey data. Spatial features were coded and then collected as feature data in a GIS database to ensure the precision of spatial data. The geodatabase design and implementation encompassed the development of a data model and the creation of various tables with distinct fields and appropriate formats, incorporating all essential metadata for geographical locations. Quality control/quality assurance (QC/QA) procedures were instituted to guarantee the accuracy of digital spatial data, proper spatial relationships, precise attribute data entry, and coding. The assessment of data quality involved measurements and evaluations based on criteria such as the accuracy of geographic and non-geographic data, data quality, consistency, and completeness, utilizing a statistical approach to geodatabase analyses.
Google Satellite Images
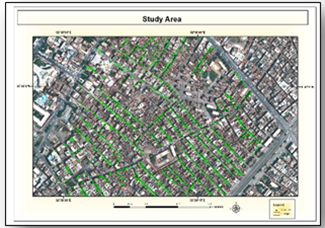
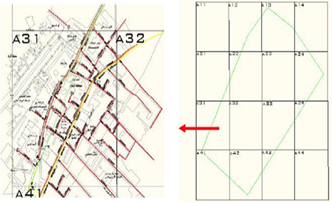
Satellite images depicting the study area offer a valuable foundation for streamlining the fundamental mapping process, as illustrated in the figures below that showcase various types of satellite images along with their respective resolutions. Google Earth satellite imagery was employed to identify key features such as roads, buildings, canals, and drains, laying the groundwork for map creation in the subsequent data collection phase, as depicted in Figure 4. To enhance efficiency during fieldwork, the study area was partitioned into smaller sections (grids), allowing for a more streamlined distribution of data collection responsibilities. These sections were systematically organized using an index prepared by a specialized team of Water Company employees operating within the Geographic Information Systems program.
Figure 3: Satellite Image.
Figure 4: Partition the area into grids.
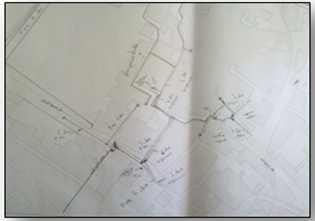
In this stage, we initiated a field survey to gather both geographic and descriptive information. On-site distances were validated by cross-referencing with our maps, which were generated from satellite images (utilizing Google Earth). Models were finalized, and GIS maps precisely depicted the layout of water pipes, water valves, and fire valves. The visual depiction of the field survey models is presented in the subsequent figure.
Figure 5: Paper for Data Compilation (updating hand-drawn during field survey).
Analysis
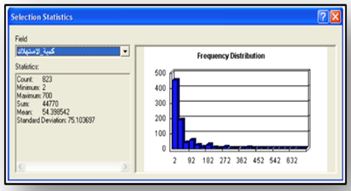
Statistical analyzes were performed on total water consumption measured in cubic meters. (Figure 6).
Figure 6: Quantitative Data on Water in Cubic Meters (screenshot from ArcGIS software).
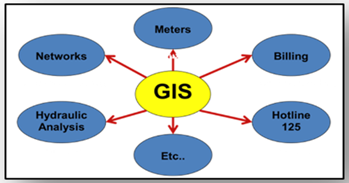
Figure 6 illustrates a graph presenting the total counters categorized by account types for the months of July and August. The integration of the GIS drinking water network into various departments of the water company involves establishing connections between the meter code, billing systems, hydraulic analysis systems, and other components of the drinking water network through coding systems.
Figure 7: Geographic Information System Connections.
The main process is the integration of Geographic Information System (GIS) maps with hydraulic systems, billing processes, and other components of the water network is a crucial aspect of this study (Figure 7).
Problem Solution
Minimizing data redundancy was achieved by implementing a centralized system for managing geographic data, which streamlined both storage and retrieval processes from a unified source, thus reducing duplications. Regular audits and cleaning operations were performed on geographic data to remove unnecessary information, ensuring the quality of geographic data and enhancing the overall integrity and accuracy of geographical information. This process involved the application of data quality control measures, including systematic and routine verification and cleansing procedures. The enforcement of standardized protocols for geographic and metadata entry and updates was instrumental in enhancing accuracy. Robust backup and security measures were implemented to protect information, guarantee data integrity, and prevent unauthorized access or data loss. To expedite data exchange, standardized geospatial data formats and protocols were adopted. The sharing of data across different systems and departments was simplified through the implementation of application programming interfaces (APIs). Additionally, the development of a secure and high-speed communications infrastructure was undertaken to facilitate rapid and reliable exchange of information and geographic data. The integration between GIS applications and other applications in various departments was promoted by establishing operational standards for GIS applications.
Several task forces were established, and practical training sessions were arranged. A team dedicated to meter calibration and repair was assembled within the meter calibration and repair department. Thorough on-the-job training was implemented to foster expertise in maintaining precision measuring meters. Another team, specialized in leak detection and loss reduction, was created to pinpoint and address leaks within the drinking water network, with a specific focus on minimizing water losses. On-the-job training was delivered to enhance skills in efficient leak detection and mitigation strategies. A working group with expertise in Geographic Information System (GIS) was formed to manage geographical information. Comprehensive on-the-job training was provided to ensure proficient use of GIS tools, spatial analysis, and the management of both geographic and descriptive data. Additionally, a team was organized for meter replacement, concentrating on the installation of new water meters, especially in government and non-government buildings lacking meters. On-the-job training was conducted to ensure proper readiness for tasks related to meter replacement and installation. Lastly, a team was established for the scanning of unread meters, tasked with scanning and processing meters that pose challenges in interpretation or reading. On-the-job training was provided to identify issues with meters that are difficult to interpret or read.
The team responsible for addressing and mitigating unauthorized connections, known as the Illegal Communications Team, has been established. On-the-job training has been conducted to identify and rectify water connections that are not legally authorized, thereby ensuring the safety of the water distribution network. The specified area is connected to the Luxor water network but lacks substantial meters to measure the supplied water accurately. Three specific locations have been designated for water measurement—two for water flow into the selected area and one for water flow outside the chosen area (Figure 1). Three ultrasonic flow meters were deployed at these locations. Before commencing the leak detection process, measuring devices indicated that the quantity of water supplied to the experimental area over 48 hours amounted to 7,295 cubic meters. Flow measurements further revealed that the average pressure in the network within the region ranged from 0.77 to 1.9 bar. Considering the population of 13,233 people in the chosen area, the calculated water consumption per person per day was 276 liters. This consumption rate is significantly higher than the typical usage, indicating the presence of multiple instances of material and commercial leaks in the region.
Water Leak detection
To identify the locations of leaks within the drinking water network, a specialized survey was conducted to detect leaks in the designated area. Before this survey, the Luxor leak detection team underwent practical training on leak detection techniques. The survey revealed a total of 108 leaks in the selected area, a considerable number considering the relatively small size of 200,000 square meters. This indicates potential issues in the drinking water network in the area, possibly necessitating network replacement if the cost of repairing leaks exceeds 50% of the replacement cost. GIS maps were also utilized to precisely locate the leaks, streamlining the subsequent efforts of the network team during the repair process. To evaluate the impact of repairing identified leaks in the drinking water network and the percentage of unaccounted-for water (UFW), a second round of measurements was carried out at the same three locations within the chosen experimental area. The measured water consumption within the experimental area over two full days totaled 4,947 cubic meters, with an average effective pressure ranging from 1.1 to 2.2 bar. As a result, the average water consumption decreased to 187 liters per person per day, indicating a notable reduction of 32.2%. The summarized table below presents the measurements before and after the repair of detected leaks in the selected experimental area:
Table 1: The measurements
| Measurement | Before Repair | After Repair | Reduction |
| Water Consumed (m3) | 7295 | 4947 | -32.2% |
| Mean Pressure (bars) | (0.77-1.9) | (1.1-2.2) | - |
| Consumption per Person per Day (liters) | 276 | 182 | -32.2% |
Table 2: Water Measurements
| Item | Before Repairing Leaks | After Repairing Leaks |
| Quantity of Water Consumed in 48 Hours (cubic meters) | 7295 | 4947 |
| Consumption per Person per Day (liters) | 275 | 187 |
| Mean Effective Pressure (bars) | 1.9 | 2.2 |
| Lowest Pressure (bars) | 0.77 | 1.1 |
| Percentage of Unaccounted-for Water (UFW) | 50.18 | 32.2 |
Therefore, the percentage of unaccounted for water (UFW) after repairing leaks in the selected experimental area is 50.18% - 32.2% = 20%.
Research Results
A team, consisting of GIS engineers, meter readers, network technicians, and employees from the billing center of the water company, undertook the field survey and data collection. Their aim was to collect information about customers within the specified pilot area. The database includes diverse details such as owners' names, the number of apartments in buildings, customer names, addresses, meter types, meter diameters, meter conditions, length of water connections, meter readings, water consumption, and more. The total count of subscribers in the chosen area reached 1,727. The status of the meters is detailed in the table below:
Table 3: Water Customers
| Meter In Status | In Operation | Out of Order | Less Accuracy | Illegal Connection | Removed | Total |
| Available Number | 1205 | 287 | 230 | 4 | 1 | 1727 |
The total count of malfunctioning meters, encompassing both meters with faulty readings and inaccurate meters, is 508 (287+230). The water company's commercial sector invoiced these 508 meters using a fixed rate of 60 cubic meters per period (two months). Efforts to reduce the percentage of unaccounted-for water (UFW) associated with commercial activities were initiated through various measures implemented by the measurement teams in the "Luxor" commercial sector, including:
1. Utilizing GIS analyses to delineate precise routes for each meter reader and redistributing them across regions and branches.
2. Identifying and disconnecting illicit connections, especially for customers without a contract with the company, those linked to neighboring customers, or those failing to settle water bills.
3. Installing new meters for government buildings and non-governmental connections.
4. Identifying high-consumption customers, such as commercial activities (factories, ship feed connections), and hotels, with subsequent measures taken to install new drinking water meters.
5. Replacing non-functional meters.
To reduce the UFW percentage, a comparison was made between the consumption of 1,727 customers in the selected region in November and December of 2021 and their consumption during the corresponding two months in 2022. The ensuing table illustrates the results:
Table 4: Average consumption.
| Item | Average Consumption in 2021 (Cubic meters) | Average Consumption in 2022 (Cubic meters) | Average Consumption Increase (Cubic meters) |
| For One Customer | 52.9 | 55.3 | 2.4 |
| Customers in One Period | 95,503 | 4,145 | |
| For the 1727 Customers in One Year | 548,148 | 573,018 | 24,870 |
The decrease in unaccounted-for water was calculated as 24,870 out of 548,148, resulting in a reduction of 4.5%. Various factors contributed to this decline, including the correction of water meter readings, accurate input of drinking water billing data, invoicing for previously overlooked water meter connections, redistributing accumulated meter readings over six months, and addressing meters with inaccurate readings (lower than natural consumption). Contrary to expectations, the replacement of malfunctioning meters did not lead to a significant decrease in the unaccounted-for water percentage, primarily due to the application of a fixed rate (60 cubic meters per period). The average reduction in consumption for each replaced meter (a total of 508 meters) was computed to be 0.913 cubic meters per period. Taking into account the total number of water meters (1,727 meters, with 508 meters out of service) and the overall reduction in the unaccounted-for water percentage (4.5%), the total unaccounted-for water is determined as 32.2% + 4.5% = 36.7%. This percentage is attributed to commercial activities and leak repairs.
The unaccounted-for water percentage in the designated area, after addressing leaks and commercial activities, was calculated as 50.18% - 36.7% = 13.48%. The notable reduction in the commercial sector is further pronounced, primarily influenced by seasonal variations (winter measurements), connections without meters (especially in the Karnak neighborhood), and the watering of trees and gardens. To compute the Unaccounted-for Water (UFW) in Luxor City, the volume of water produced by the Luxor Water Treatment Plant during January and February 2021, as per the UFW program, was 4,483,652 cubic meters supplied to Luxor City. The quantity of water sold and invoiced to customers during the same period was 3,129,998 cubic meters. Since the pilot program concluded in May 2021, any impact on the UFW calculation due to the repair of leaks identified in the pilot area, fixed in May 2021, is not applicable. The primary contributing factor is commercial activities, which will be elaborated upon later.
Table 5: Reduction of UFW
| Item | Average Consumption in 2021 (cubic meters) | Average Consumption in 2022 (cubic meters) | Average Consumption 2022 cubic Decrease/Increase (cubic meters) |
| For One Customer | 56,225 | 55,342 | (-0.913) |
| For the 508 Customers in One Period | 28,562 | 28,114 | (-448) |
| For the 508 Customers in One Year | 171,372 | 168,684 | (-2,688) |
As previously mentioned, the substantial reduction in consumption observed in the 508 replaced water meters resulted from various initiatives implemented following the pilot study in the designated area. These initiatives included:
- Providing guidance to water meter readers to ensure accurate meter readings and encouraging the reporting of illicit water connections and malfunctioning water meters.
- Redistributing water meter readers across different areas and branches within Luxor City, consisting of 19 branches.
- Addressing leaks in the primary drinking water network pipelines.
- Replacing 5,382 malfunctioning water meters with new ones.
- Discontinuing service to illegal water connections.
- Promoting reporting of illicit links by individuals.
Implications
The implications of Unaccounted-for Water (UFW) are far-reaching and can have significant impacts on water utilities, communities, and the environment. Some key implications include:
Financial Losses: UFW represents an economic loss for water utilities, as the water that is unaccounted for translates into revenue losses. This can affect the financial sustainability of utilities and hinder their ability to invest in infrastructure and service improvements.
Resource Scarcity: In regions where water resources are scarce, UFW exacerbates water scarcity issues. The wasted water could otherwise be used to meet the needs of the population or for other essential purposes.
Environmental Consequences: The excessive extraction and treatment of water that eventually goes unutilized contributes to unnecessary energy consumption and environmental impact. Moreover, leaking pipes and infrastructure failures associated with UFW can harm ecosystems and water quality.
Inequitable Distribution:
UFW can lead to an uneven distribution of water resources, with some areas experiencing shortages while others may have excess. This can exacerbate social and economic disparities within a community.
Infrastructure Integrity:
Unaddressed leaks and system losses associated with UFW can compromise the integrity of water infrastructure. This may result in more frequent breakdowns, necessitating costly repairs and replacements.
Operational Efficiency: High levels of UFW can hinder the overall operational efficiency of water utilities. Excessive resources are expended on treating and transporting water that ultimately does not contribute to meeting actual demand.
Public Trust: Persistent issues with UFW can erode public trust in water utilities. Consumers may question the effectiveness and reliability of the services provided, leading to dissatisfaction and potential resistance to water conservation efforts.
Regulatory Compliance: Water utilities are often subject to regulatory standards and guidelines. Failure to minimize UFW may result in non-compliance, leading to legal and regulatory consequences.
Addressing UFW is crucial for mitigating these implications, ensuring the efficient and sustainable use of water resources, and maintaining the integrity of water supply systems. Implementing effective strategies for leak detection, infrastructure maintenance, and improved management practices can contribute to minimizing UFW and mitigating its associated impacts.
Conclusion
Managing unaccounted water, which includes both legal and illegal losses, often exceeds 40% of total water production, presenting significant challenges to the drinking water utility and its financial resources. These losses adversely impact the company's revenue streams and hinder the overall efficiency of the drinking water facility. The primary objective of this investigation is to reduce Unaccounted for Water (UFW) through initiatives such as monitoring water flow, addressing unauthorized connections, and implementing leak detection measures. The integration of Geographic Information System (GIS) maps with hydraulic systems, billing processes, and other components of the water network is a crucial aspect of this study.
By carefully selecting a pilot area and implementing a systematic approach involving field visits, comprehensive evaluations, meetings, and the systematic improvement of base maps and drinking water networks, the goal is to achieve a substantial reduction in the percentages of water that remains unsold and underutilized. The identification and repair of leakage areas play a crucial role in diminishing unaccounted-for water. In the selected pilot area, unaccounted-for water experienced a reduction of 32.2%, attributed to the repair of leaks in the water network, with an additional decrease of 4.5 percentage achieved through initiatives targeting commercial activities. Therefore, the overall decrease in unaccounted-for drinking water in the pilot area amounted to 36.7%. As a result, the current Unaccounted-for Water (UFW) rate in the demonstration area stands at 50.18% - 36.7% = 13.48%. In Luxor, there was a 30.2% reduction in unaccounted-for water, resulting in the current percentage being 20%.
Recommendations
To enhance the accuracy of reading drinking water meters, it is recommended to utilize mobile devices for data upload and collection, effectively reducing common errors in meter reading and billing. Addressing the absence of water meters in certain residential connections, a comprehensive plan has been devised for installing new water meters in both government and non-government buildings. This strategic initiative ensures widespread coverage of water meters, minimizing the likelihood of inaccuracies in monitoring drinking water consumption. Introducing an incentive system is proposed to motivate Luxor Water Company employees, aiming to recognize and reward the efforts of those working in the Drinking Water Company and fostering a culture of excellence and dedication.
To enhance precision in monitoring the water production volume, it is advised to install large-scale water meters at drinking water treatment plants. This measure will facilitate accurate measurements, contributing to the acquisition of precise data on the quantity of water produced. Establishing an orientation program for employees involved in billing, meter reading, customer service center operations, collection, and the meter repair and calibration workshop is recommended. This program aims to ensure the smooth functioning of the commercial sector by equipping employees with the knowledge and skills essential for efficient performance in their respective roles through training courses.
Declarations
Competing interests
The author has no conflicts of interest to declare that are relevant to the content of this article.
Authors' contributions
Only one Author for this paper.
Funding
No funding was received for conducting this study.
Availability of data and materials
Data and materials are available upon request.
References
- Abd-Elaziz, El Manadily, Yehia, (2005), Development and Assessment of Semi-automatic GIS Generalization Module, Master of Science in Civil Engineering, Faculty of Engineering, Cairo University, Giza, Egypt.
Publisher | Google Scholor - Google announced in August, (2006), Object Recognition Is the Future of Google.
Publisher | Google Scholor - Hui et al, (2005), Automatic Recognition and Extraction of Oil Tanks from High-Resolution Remotely Sensed Images, Photogrammetry and Remote Sensing Department, Wuhan University, 129 Luoyu Road, Wuhan, Hubei, P.R. China.
Publisher | Google Scholor - Mayer et al, (1997), Automatic Road Extraction Based on Multi-Scale Modeling, Context, and Snakes, Photogrammetry and Remote Sensing University, Munich, Germany.
Publisher | Google Scholor - Peeters., Etzion., Blaustein., (2003), Automated Recognition of Morphological Patterns in Urban Open Spaces, Desert Architecture and Urban Planning Unit, Department of Man in the Desert, J. Blaustein Institute for Desert Research, Ben Gurion University of the Negev, Israel.
Publisher | Google Scholor - Theodoridis, Koutroumbas, (2006), Pattern Recognition, Third Edition, 1-6, 397-298.
Publisher | Google Scholor - Reducing Unaccounted for Water and Network Losses in Egyptian Water Utilities, (2011).
Publisher | Google Scholor - Abdelrahman M. Farouk, Rahimi A. Rahman, Noor Suraya Romali, (2021), non-revenue water reduction strategies, Smart and Sustainable Built Environment.
Publisher | Google Scholor - Ayad, Khalifa, M. EL Fawy, A. Moawad, (2021). An integrated approach for non-revenue water reduction in water distribution networks based on field activities, optimization, and GIS applications.
Publisher | Google Scholor - Bhagat, S. K., Welde, W., Tesfaye, O., Tung, T. M., Al-Ansari, N., et al. (2019). Evaluating physical and fiscal water leakage in water distribution system. Water (Switzerland), 11(10):1-14.
Publisher | Google Scholor - Frauendorfer, R., Liemberger, R. (2010). The Issues and Challenges of Reducing Non-Revenue Water. In Asian Development Bank, Vol. 41.
Publisher | Google Scholor - Lai, C. H. (2016). A Comparative Study of Issues and Challenges in Reducing Non-Revenue Water Rates in Pulau Pinang and Perlis, Malaysia. University Sains Malaysia.
Publisher | Google Scholor - Antonio F. Vela, Vicent Espert, Vicente S. Fuertes, (1995). General Overview of Unaccounted for Water in Water Distribution Systems, Water Science and Technology Library, 14:61-95.
Publisher | Google Scholor - Costas., Florin, (2004), Image Processing and GIS Tools for Feature and Change Extraction, Natural Resources Centre for Topographic Information (CTI), Geomatics Canada.
Publisher | Google Scholor - Duda., Hart., Stork., (2001). Pattern Classification, Second Edition, 9-17.
Publisher | Google Scholor - Funtanilla, (2004). GIS Pattern Recognition and Rejection Analysis Using MATLAB, MS Computer Science, Graduate Student, Texas A&M University, Corpus Christi.
Publisher | Google Scholor - Gonzalez et al, 2004, Digital Image Processing, 2nd Edition, 484-499, 595-600, 693-750.
Publisher | Google Scholor - Unaccounted for Water (UFW) definition.
Publisher | Google Scholor - Marina A. (2017). The American Water Works Association (AWWA).
Publisher | Google Scholor - Wolfe P. (2003). UFW reduction increases drinking water supply. Water World.
Publisher | Google Scholor

