
Research Article
Identification of Novel Necroptosis and Immune Infiltration in the Progression of Idiopathic Pulmonary Fibrosis
- Hongbo Fan
- Lin Luo *
Department of Critical Care Unit, The Second Hospital of Dalian Medical University,467 Zhongshan Road, Shahekou District, Dalian,116023, China.
*Corresponding Author: Lin Luo, Department of Critical Care Unit, The Second Hospital of Dalian Medical University,467 Zhongshan Road, Shahekou District, Dalian,116023, China.
Citation: Fan H., Luo L. (2024). Identification of Novel Necroptosis and Immune Infiltration in the Progression of Idiopathic Pulmonary Fibrosis, Journal of BioMed Research and Reports, BioRes Scientia Publishers. 5(4):1-16. DOI: 10.59657/2837-4681.brs.24.103
Copyright: © 2024 Lin Luo, this is an open-access article distributed under the terms of the Creative Commons Attribution License, which permits unrestricted use, distribution, and reproduction in any medium, provided the original author and source are credited.
Received: July 17, 2024 | Accepted: August 07, 2024 | Published: September 20, 2024
Abstract
Objective: To ascertain the function of necroptosis in IPF (idiopathic pulmonary fibrosis) using bioinformatic techniques.
Methods: GSE10667 and GSE24206 datasets were obtained from the Gene Expression Omnibus (GEO) database. Necroptosis-related differentially expressed genes (NRDEGs) were identified based on the differentially expressed gene (DEG) and necroptosis gene collection. The gene enrichment signaling pathways in IPF were assessed using gene set enrichment analysis (GSEA). Protein-protein interaction (PPI) networks were created and visualized using the STRING database and Cytoscape, which also identified essential NRDEG functional components. The Kyoto Encyclopedia of Genes and Genomes (KEGG) and Gene Ontology (GO) were used for pathway enrichment analyses of NRDEGs. The necroptosis-related transcription factor-target gene regulatory network was built using the CellMiner database, and immune infiltration patterns were examined using the CIBERSORTx algorithm.
Results: IPF samples showed significant enrichment and activation of the necroptosis pathway. PEL1, MEFV, and SERTAD1 were among the 44 NRDEGs identified. Hub genes were abundant in the IL-17 signaling pathway, RIG-I-like receptor signaling pathway, and apoptosis, and the NRDEGs were largely involved in endopeptidase activity and ficolin-1-rich granules. Twenty-two possible immune cells, including neutrophils, NK cells, CD4, and CD8, were elevated in both datasets.
Conclusion: We found differential genes related to IPF necroptosis and various immune cell infiltrates, among which CHL1, EGFR, and KRT14, and NRDEG-related drugs and compounds might provide new targets for treatment of IPF.
Keywords: idiopathic pulmonary fibrosis; bioinformatics analysis; necroptosis; immune infiltrates
Introduction
Idiopathic pulmonary fibrosis (IPF) is an irreversible and lethal lung disease characterized by progressive interstitial fibrosis. In recent years, IPF has been the most prevalent disease worldwide apart from cancer. The death rates exceed those of some cancers, especially in the elderly the and middle-aged patients, and the general survival time is less than five years [1, 2]. The etiology of IPF is unclear and its early clinical manifestations are nonspecific. Known risk factors are associated with genetic susceptibility, drug use, and smoking [3]. The early clinical symptoms of IPF are not clear, with only a mild dry cough, progressive dyspnea, and lung function decline in the middle and late stages. Currently, approved targeted drugs only delay disease progression and do not reduce mortality. Hence, new and reliable prognostic models are required to improve targeted therapies.
Multicellular organisms undergo necroptosis, a type of programmed necrosis or inflammatory cell death that is regulated and controlled by several cellular and molecular pathways [4]. Hallmark characteristics of necrosis and apoptosis, such as the loss of cell membrane integrity, cell lysis, organelle expansion, leakage of intracellular components, and activation of death receptor ligands, are present in necroptosis [5]. There is a growing body of research that examines the crucial function of necroptosis in the biological operations of many cancers. However, the significance of necroptosis-related markers in IPF prognosis has not been extensively studied.
In this study, we used bioinformatic methods to analyze the biological pathways and hub genes associated with necroptosis, which are linked to the progression of IPF. Our goal was to create a unique prognostic signature using these genes and to identify new therapeutic targets for IPF after a deeper understanding of the molecular mechanisms to develop new therapeutic agents for patients with IPF.
Methods and Materials
Data acquisition and preprocessing
The GSE10667 [6] and GSE24206 [7] datasets were obtained from the Gene Expression Omnibus (GEO) database using R (version 4.1.0, http://r-project.org/) and the GEO (https://www.ncbi.nlm.nih.gov/geo/) query tool [8]. All samples were drawn from Homo sapiens; the GSE10667 dataset (Platform: GPL4133) included eight IPF samples and 15 normal healthy lung tissue samples as controls, and the GSE24206 dataset (Platform: GPL570) included 11 IPF samples and five normal healthy lung tissue samples as controls. Affy [9] was used to read the raw data for the GSE10667 and GSE24206 datasets. Background correction and data normalization were then performed to produce gene expression matrices for the two datasets, and the inter-sample correction effect was displayed by constructing plots in ggplot2 [10] packages.
Identification of differentially expressed genes with necroptosis
The differentially expressed genes (DEGs) in the GSE10667 and GSE24206 datasets were screened using the limma package, and a heatmap was drawn using the pheatmap package [11] to depict the differential distribution of sample DEGs. The volcano map of DEGs was constructed using ggplot2 to display the differential expression of DEGs that satisfied p < 0> 0.2.
We used the search term "necroptosis" to download the list of necrotizing apoptosis-associated genes (necroptosis-related genes, NRGs) from the GeneCards database (https://www.genecards.org/) [12], which offers detailed information about human genes. Similarly, necroptosis-related genes were obtained using gene set enrichment analysis (GSEA) with the word "necroptosis" as the search term. In addition, the keyword search term "necroptosis-related genes" was used to obtain the NRG set in the published literature [13, 14] in the PubMed database. In total, 625 NRGs were obtained after merging and deduplication, as shown in Table S1. The NRDEG subset of DEGs was screened using a Venn diagram.
Functional enrichment analysis
Crucially influential functional enrichment investigations, including biological processes (BP), molecular functions (MF), and cell components (CC), frequently employ Gene Ontology (GO) analysis [15]. The widely used Kyoto Encyclopedia of Genes and Genomes (KEGG) [16] database contains data about genes, biological processes, illnesses, and medications. The clusterProfiler package [17] was used to perform GO and KEGG enrichment analyses of NRDEGs. Statistical significance was set at P < 0>
The distribution trend of genes in a predetermined gene set in a gene table ranked by phenotypic correlation was evaluated using GSEA, and its contribution to the phenotype was determined. In this study, the GSE10667 and GSE24206 datasets were divided into two groups according to the phenotypic correlation ranking, and the clusterProfiler package was used to compare the two groups of high and low phenotypic correlation. The parameters used in this GSEA were as follows: seed 2020, number of calculations 10000, the minimum number of genes contained in each gene set 10, maximum number of genes 500; the P-value correction method used was Benjamini-Hochberg (BH). The c2.cp.v7.2.symbols.gmt gene set was obtained from the Molecular Signatures Database (MSigDB) [18], and the screening criteria for significant enrichment were P < 0.05, and FDR (q value) < 0.05.
Protein interaction network analysis
Protein-protein interaction are composed of proteins that interact with each other. In this study, we used the STRING (https://string-db.org/) database [19], a tool designed to predict PPI and enable construction of PPI networks for selected genes. The protein interaction relationship of NRDEGs was analyzed, genes with a score higher than 0.4 were selected to construct the network model visualized using Cytoscape (www.cytoscape.org/).[20] (V3.9.1), and the CytoHubba [21] plug-in was used to screen hub genes.
NRDEGs and miRNA network analysis
MicroRNAs (miRNAs) play important regulatory roles in biological development and evolution. They can regulate a variety of target genes, and the same target gene can be regulated by multiple miRNAs. To analyze the relationship between NRDEGs and miRNAs, the multiMiR package [22] was used to predict the possible miRNAs of NRDEGs, and the miRTarBase database information contained in the multiMiR package was selected. The luciferase reporter assay, with the most rigorous experimental grade, was used to verify the results. Cytoscape(v3.9.1) was used to visualize NRDEGs and miRNA results.
NRDEGs and transcription factor analysis
Transcription factors (TFs) control gene expression by interacting with target genes (mRNAs) at the post-transcriptional stage. The TRRUST2[23] (https://www.grnpedia.org/trrust/) database was used to analyze the regulatory relationship between NRDEGs and transcription factors, and Cytoscape was used to visualize the correlation between NRDEGs and transcription factors and tissues.
Relationship between hub genes and drug response
Direct and indirect drug targets of NRDEGs were predicted using the CellMiner database (https://discover.nci.nih.gov/cellminer/home.do) [24] by downloading the Processed Data Set, checking RNA expression data (RNA: RNA-seq) and drug data (Compound Activity: DTP NCI-60), and using the impute package [25] and limma package for drug sensitivity analysis.
Receiver operating characteristic (ROC) curve
A graphical analysis tool called the receiver operating characteristic (ROC) curve [26] can be used to choose the best model, eliminate the second-best model, or establish the best threshold within the same model. The composition technique reflects the correlation between sensitivity and specificity, and the ROC curve is a comprehensive indicator of continuous variables reflecting both sensitivity and specificity. The normal range of the area under the curve (AUC) is 0.5–1. The better the diagnostic performance, the closer the AUC is to 1. The accuracy is low, moderate, and high when AUC is 0.5–0.7, 0.7–0.9, and above 0.9, respectively. The survivalROC R package was used to draw the ROC curves of NRDEGs, survival time, and survival status of patients with pulmonary fibrosis.
Assessment of immune cell infiltration
The CIBERSORTx [27] method was used to uncoil the expression matrix and obtain various immune cell subtypes. It is based on the theory of linear support vector regression. We entered the LM22 characteristic gene matrix together with the gene expression matrix data into CIBERSORTx and removed any samples with P < 0>
Statistical Analysis
The R programming language was used for all data processing and analyses (version 4.0.2). The independent Student’s t-test was used to calculate the statistical significance of normally distributed variables for the comparison of continuous variables between the two groups, while the Mann-Whitney U test was used to evaluate differences between non-normally distributed variables. Chi-square tests or Fisher’s exact tests were used to evaluate and analyze the statistical significance between two sets of categorical variables, and Pearson correlation analysis was used to determine the correlation coefficients between various genes. Statistical significance was set at P less than 0.05.
Results
Data preparation and DEG identification
The research design is illustrated in Figure 1. First, the samples of the GSE10667 and GSE24206 datasets were combined; then, homogenization and standardization were performed. The boxplot before and after homogenization is shown in Figure 2. The results show that the two groups of samples had good uniformity after preprocessing. Next, we used the R software to analyze the heat map (Figure 3A, C) and volcano map (Figure 3B, D) of the GSE10667 and GSE24206 datasets. The results showed that The GSE10667 dataset contained 2,160 upregulated and 1,548 downregulated genes, and the GSE24206 dataset contained 2,990 upregulated and 2,736 downregulated genes. Then, 1,286 common differential genes were extracted from the GSE10667 and GSE24206 datasets, including 663 upregulated and 623 downregulated genes (Figure 4A). We identified a list of 625 necroptosis-related genes from GeneCards, and the two gene subsets were displayed by Venn diagram to obtain the NRDEGs in the GSE10667 and GSE24206 datasets. A total of 44 differentially expressed genes related to necroptosis (PELI1, MEFV, SERTAD1, CD274, MERTK, PANX1, FASN, NFKBIA, TNFSF10, AIFM2, CTSB, ID1, CYP3A4, SGK1, TRADD, CHL1, DDX58, CCL2, MAPK8, GSN, BUB1B, BDNF, DIRAS3, EGFR, IDH2, MMP13, GJA1, EPAS1, VCP, KIF11, KRT14, KRT5, DDX3X, ATF4, FUS, PABPN1, PARK7, CALU, KLF6, ELAVL1, DYNLL1, PDIA6, MYL6B, and RPS27L) were identified (Figure 4B).
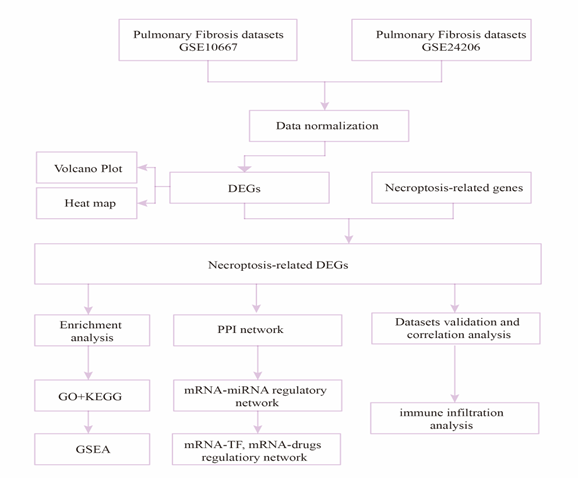
Figure 1: A flow chart
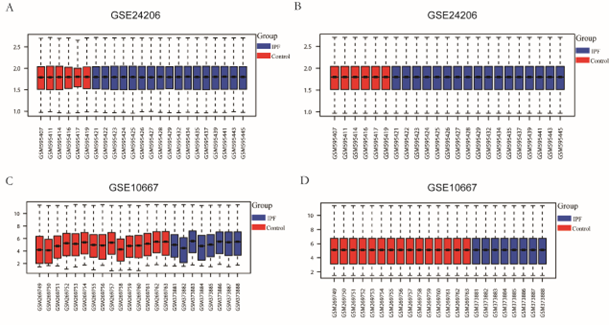
Figure 2: Boxplot plots before and after sample correction for GSE10667 and GSE24206 data sets. For GSE10667 dataset, before correction (A) and after correction by removing the inter-batch difference (B); GSE24206 data set before correction (C), and after correction to remove the inter-batch difference (D). IPF: idiopathic pulmonary fibrosis.
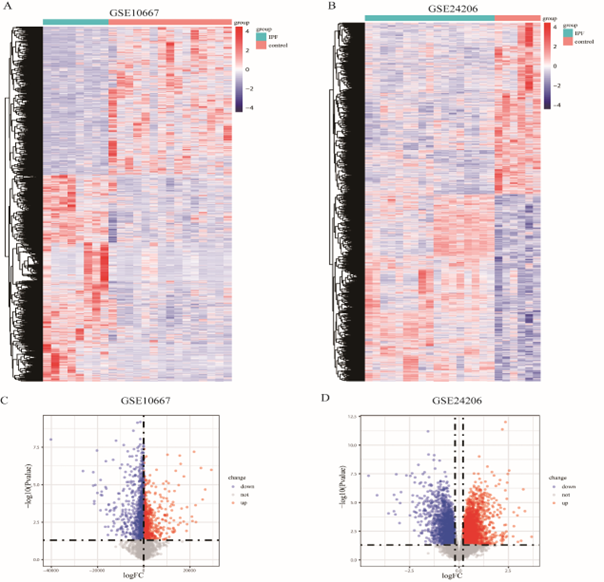
Figure 3: Acquisition of differential genes associated with necroptosis in GSE10667 dataset and GSE24206 dataset. A: DEGs heat map of GSE10667 dataset; B: DEGs heat map of GSE24206 dataset; C: Volcano map of DEGs for the GSE10667 dataset, D: volcano map of DEGs for the GSE24206 dataset, red represents upregulated DEGs, blue represents downregulated DEGs, and gray represents no differentially expressed genes. DEGs: Differentially expressed genes.
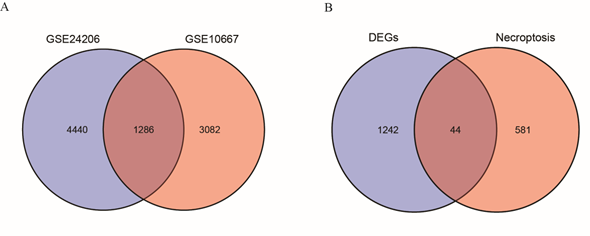
Figure 4: Acquisition of the NRDEGs associated with necroptosis in the GSE10667 dataset and the GSE24206 dataset. A: DEGs Venn diagram for GSE10667 dataset and GSE24206 dataset. B: DEGs were intersected with the gene set of necroptosis by Venn diagram to obtain NRDEGs. NRDEGs: Differentially expressed genes of necroptosis; DEGs: Differentially expressed genes.
Functional correlation analysis of NRDEGs
GO and KEGG analyses were conducted to further explore the BP, MF, CC, and biological pathways of 44 NRDEGs, and their association with pulmonary fibrosis.
The results of GO analysis showed that NRDEGs were mainly related to the positive regulation of cysteine-type endopeptidase activity, regulation of cysteine-type endopeptidase activity, positive regulation of endopeptidase activity, ficolin-1-rich granule, melanosome, pigment granule, scaffold protein binding, protease binding, and gap junction channel activity (Figure 5A-D), and the detailed results are shown in Table 1.
The results of KEGG analysis are shown in Figure 5E–F. The pathways enriched by NRDEGs mainly included IL-17 signaling pathway, RIG-I-like receptor signaling pathway, apoptosis; the detailed results are shown in Table 1. GO (Figure 5B–D) and KEGG (Figure 5E–F) network diagrams were drawn based on the functional enrichment analysis of GO and KEGG genes. The lines indicate the corresponding molecules and annotations of the corresponding entries; the larger the node, the more molecules the entry contains.
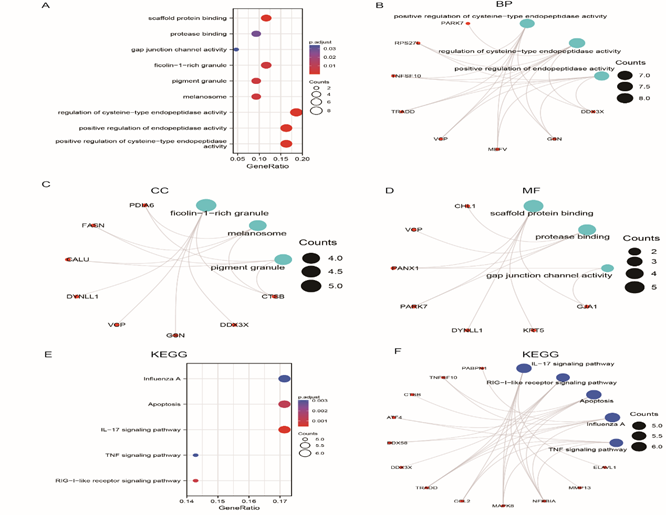
Figure 5: Functional correlation analysis of NRDEGs in necroptosis. A. Enrichment analysis of GO-KEGG overall biological function. The X horizontal axis represents the proportion of DEGs enriched in GO team, and the color of the bubble represents the corrected P-value: the redder the color, the smaller the corrected P-value. The greener the color, the larger the corrected P-value. B. Functional enrichment analysis of GO-BP. C. Functional enrichment analysis of GO-CC. D. Functional enrichment analysis of GO-MF. E. Bubble diagram shows KEGG pathway enrichment analysis. F. Ring diagram shows KEGG pathway enrichment analysis.
NRDEGs: Differentially expressed genes of necroptosis; DEGs: Differentially expressed genes; GO: Gene Ontology; KEGG: Kyoto Encyclopedia of Genes and Genomes; BP: Biological process; MF: Molecular function; CC: Cell component.
Table 1: GO KEGG analysis
| Ontology | ID | Description | Gene Ratio | P value |
| BP | GO:2001056 | positive regulation of cysteine-type endopeptidase activity | 7/43 | 4.53e-08 |
| BP | GO:2000116 | regulation of cysteine-type endopeptidase activity | 8/43 | 6.32e-08 |
| BP | GO:0010950 | positive regulation of endopeptidase activity | 7/43 | 1.53e-07 |
| CC | GO:0101002 | ficolin-1-rich granule | 5/43 | 4.97e-05 |
| CC | GO:0042470 | melanosome | 4/43 | 8.29e-05 |
| CC | GO:0048770 | pigment granule | 4/43 | 8.29e-05 |
| MF | GO:0097110 | scaffold protein binding | 5/43 | 3.03e-07 |
| MF | GO:0002020 | protease binding | 4/43 | 2.59e-04 |
| MF | GO:0005243 | gap junction channel activity | 2/43 | 5.93e-04 |
| KEGG | hsa04657 | IL-17 signaling pathway | 6/35 | 2.62e-06 |
| KEGG | hsa04622 | RIG-I-like receptor signaling pathway | 5/35 | 1.12e-05 |
| KEGG | hsa04210 | Apoptosis | 6/35 | 2.22e-05 |
The link between DEG expression in the BP, CC, and MF in the GSE10667 and GSE24206 datasets was examined using GSEA to ascertain the impact of DEG expression level on IPF. The results showed that the GSE10667 and GSE24206 datasets were divided into two groups of high and low phenotypic correlation. Some biological functions and signaling pathways were downregulated such as the KEGG JAK STAT signaling pathway, KEGG MAPK signaling pathway, PID HIF1 TF pathway, REACTOME DNA METHYLATION, WP INSULIN signaling, WP VITAMIN D RECEPTOR pathway (Figure 6A–F). The detailed results are presented in Table 2.
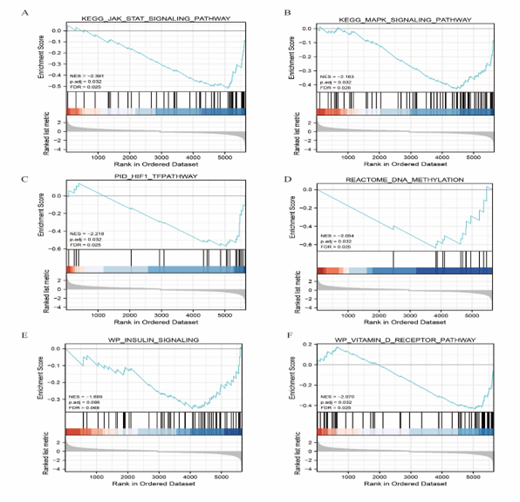
Figure 6: A: GSEA of KEGG JAK STAT signaling pathway. B: KEGG MAPK signaling pathway. C: PID HIF1 TF pathway. D: REACTOME DNA METHYLATION. E: WP INSULIN signaling. F: WP VITAMIN D RECEPTOR pathway. GSEA: Gene set enrichment analysis.
Table 2: GSEA
| ID | Description | Set Size | Enrichment Score | NES | P value |
| REACTOME_DNA_METHYLATION | REACTOME_DNA_METHYLATION | 13 | -0.637218138 | -2.053612352 | 0.002325581 |
| KEGG_JAK_STAT_SIGNALING_PATHWAY | KEGG_JAK_STAT_SIGNALING_PATHWAY | 46 | -0.519682964 | -2.391021543 | 0.002427184 |
| PID_HIF1_TFPATHWAY | PID_HIF1_TFPATHWAY | 24 | -0.570975875 | -2.218436344 | 0.00243309 |
| WP_VITAMIN_D_RECEPTOR_PATHWAY | WP_VITAMIN_D_RECEPTOR_PATHWAY | 55 | -0.434148718 | -2.069859876 | 0.002475248 |
| KEGG_MAPK_SIGNALING_PATHWAY | KEGG_MAPK_SIGNALING_PATHWAY | 74 | -0.430301016 | -2.163282109 | 0.002673797 |
| WP_INSULIN_SIGNALING | WP_INSULIN_SIGNALING | 52 | -0.357136638 | -1.688856661 | 0.014527845 |
Protein interaction network analysis
We used the STRING database to construct a PPI network of NRDEGs. Cytoscape was used to visually display their interactions (Figure 7A), and the MCODE plug-in was used to obtain four closely related genes, ELAVL1, DDX3X, FUS, and PABPN1 (Figure 7B). Further Cyto Hubba screening was conducted to obtain 10 NRDEGs with close interaction using MCC: TNFSF10, DDX58, TRADD, EGFR, NFKBIA, CCL2, DYNLL1, MAPK8, PARK7, and BDNF (Figure 7C). Ten NRDEGs with close interactions were obtained using the DEGREE method: MAPK8, TNFSF10, BDNF, TRADD, EGFR, CD274, NFKBIA, CCL2, DDX58, and FUS (Figure 7D).
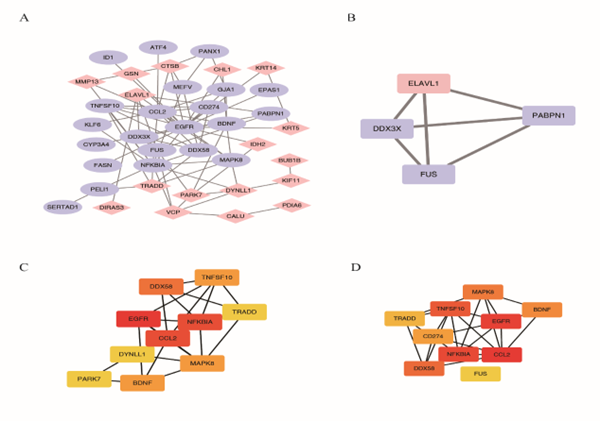
Figure 7: Protein Interaction analysis of NRDEGs. A. PPI analysis of NRDEGs, light blue represents down-regulated genes, pink represents up-regulated genes, and line connecting represents the association between genes. B. The MCOD method was used for Hub Genes prediction. C. MCC method of CytoHubba software predicts hub genes with a gradual change from yellow to red, where the darker the red color, the higher the accuracy of the prediction result. D. The Degree method of CytoHubba software to predict hub genes. NRDEGs: Differentially expressed genes of necroptosis; PPI: Protein-protein interaction.
Next, we obtained miRNAs that were related to NRDEGs from the miRTarBase database to construct the mRNA-miRNA regulatory network. Cytoscape was used to visually display their interaction (Figure 8A). It contains all 44 NRDEGs (PELI1, MEFV, SERTAD1, CD274, MERTK, PANX1, FASN, NFKBIA, TNFSF10, AIFM2, CTSB, ID1, CYP3A4, SGK1, TRADD, CHL1, DDX58, CCL2, MAPK8, GSN, BUB1B, BDNF, DIRAS3, EGFR, IDH2, MMP13, GJA1, EPAS1, VCP, KIF11, KRT14, KRT5, DDX3X, ATF4, FUS, PABPN1, PARK7, CALU, KLF6, ELAVL1, DYNLL1, PDIA6, MYL6B, RPS27L) and 212 miRNA molecules, of which PABPN1 gene was associated with 39 miRNAs (Figure 8A).
Next, the transcriptional factors (TF) binding to NRDEGs were obtained from TRRUST2 database to construct the mRNA-TF regulatory network, and Cytoscape was used for visualization (Figure 8B). It contained 27 NRDEGs, namely, ATF4, BDNF, BUB1B, CCL2, CTSB, CYP3A4, DDX58, DIRAS3, EGFR, ELAVL1, EPAS1, FASN, FUS, GJA1, ZNF148, KLF6, KRT5, KRT14, MAPK8, MEFV, MMP13, NFKBIA, PDIA6, SET, SGK1, TNFSF10, VCP, and 215 transcription factors.
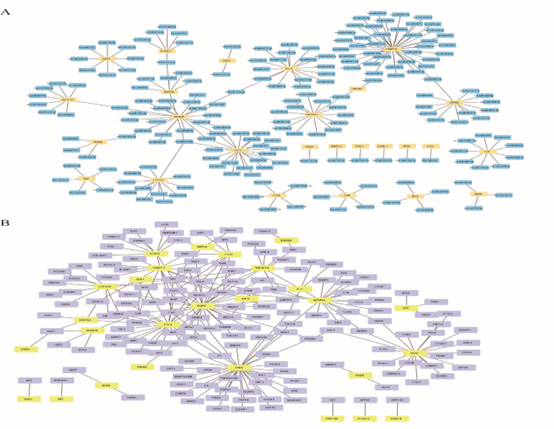
Figure 8: Target Gene PPI Analysis. A. Target Gene-miRNA Network Analysis. Blue represents the predicted miRNA and yellow represents the target gene. B. Target gene-transcription factor analysis. Predicted transcription factors are represented in purple and target genes are represented in yellow. PPI: Protein-protein interaction.
To search for drug targets, the CellMiner database was used to identify potential drugs or molecular compounds for NRDEGs. The mRNA-drug regulatory network was constructed and visualized (Figure 9). There was a correlation between CHL1 and vemurafenib (0.728, P < 0.01) (Figure 9A), dabrafenib (0.674, P < 0.01) (Figure 9B), and other drugs, and KRT14 might be a potential karenitecin resistance target (-0.630, P < 0.01) (Figure 9C). There was a correlation between EGFR and dasatinib [removed]0.598, P < 0.01) (Figure 9D). These results suggest that CHL1, EGFR, and KRT14 are important therapeutic targets.
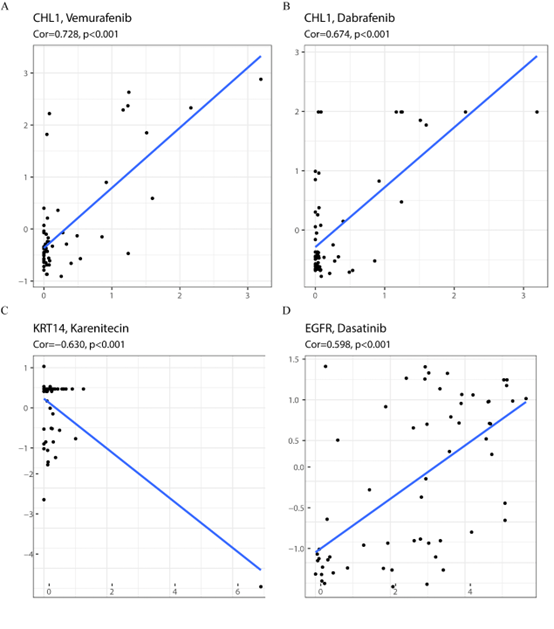
Figure 9: Target Gene-Drug Network Analysis. A: The correlation between CHL1 and Vemurafenib was 0.728, P less than 0.01. B: The correlation between CHL1 and Dabrafenib was 0.674, P less than 0.01. C: The correlation between KRT14 and Karenitecin was -0.630 (P less than 0.01). D: The correlation between EGFR and Dasatinib was 0.598, P less than 0.01.
The expression of the three genes (CHL1, KRT14, and EGFR) that were strongly correlated with drugs in the previous step was further analyzed in the GSE10667 and GSE24206 datasets, and the ROC curve was used to predict the diagnostic efficacy of GSE10667. It was observed that KRT14 was significantly higher in the IPF group than in the normal control group in both data sets (P < 0.05, Fig. 10A–C). In the ROC curve results, it was further observed that the diagnostic efficacy of CHL1 (AUC = 0.817), EGFR (AUC = 0.742), and KRT14 (AUC = 0.858) in the GSE10667 dataset was higher, and the AUC was greater than 0.7, as shown in Figure 10D–F.
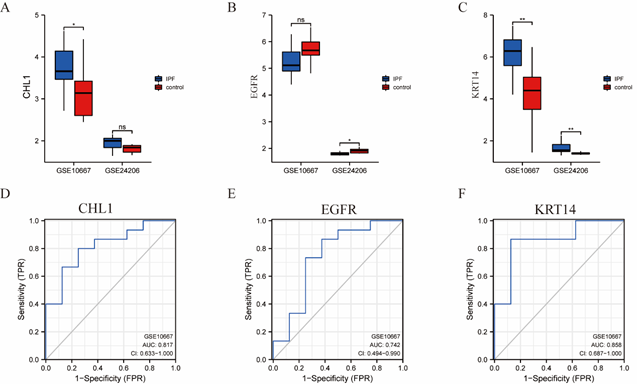
Figure 10: Expression analysis of TRRDEGs in GSE10667 and GSE24206 datasets and ROC curve prediction of diagnostic performance. A: Group comparison of the NRDEGs molecule CHL1. B: Group comparison of NRDEGs molecule KRT14. C: Group comparison of NRDEGs molecule EGFR. Ns represented P value ≥ 0.05, which was not statistically significant. * Represents P value less than 0.01 and highly statistically significant. D: ROC curve diagnostic efficacy of NRDEGs molecule CHL1. E: ROC curve diagnostic efficacy of NRDEGs molecule KRT14. F: ROC curve diagnostic efficacy of NRDEGs molecule EGFR. The AUC has a low accuracy when it is between 0.5 and 0.7, and a certain accuracy when it is between 0.7 and 0.9. NRDEGs: Differentially expressed genes of necroptosis; ROC: Receiver operating characteristic curve.
Identifying and illustrating immune cell infiltration
CIBERSORTx online database was used to analyze the infiltration of immune cells in GSE10667 and GSE24206 datasets, and it was found that 22 potential immune cells were enriched in GSE10667 data set (Figure 11A), and the correlation of 22 immune cells is shown in Figure 11B. In contrast, in the GSE24206 dataset, the involvement of 22 potential immune cells was enriched (Figure 12A), and the correlation of 22 immune cells is shown in Figure 12B. Finally, Laplace plots were used to show the correlation between drug-related NRDEGs (CHL1, EGFR, and KRT14) and the abundance of immune cell infiltration in the pulmonary fibrosis dataset GSE10667 (Figure 11C–E) and the combined dataset GSE24206 (Figure 12C–E).
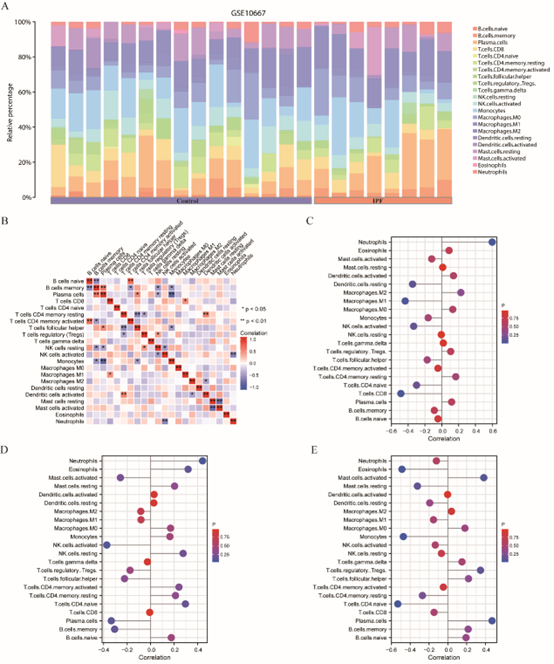
Figure 11: Assessment and Visualization of Immune Cell Infiltration. A. GSE10667 data set, enriched to the underlying immune cell distribution heat map. B. GSE10667 data set, enriched to the underlying immune cell distribution heat map. Ns represented P value ≥ 0.05, which was not statistically significant. * Represents P value less than 0.05, indicating statistical significance; ** represents a P value < 0>
The different colors of the circles represent the P value obtained by the correlation statistical method. The size of the circle represents the degree of correlation. The higher the degree of correlation, the larger the circle is. The greater the distance of the bar from 0, the higher the degree of correlation. NRDEGs: Differentially expressed genes of necroptosis.
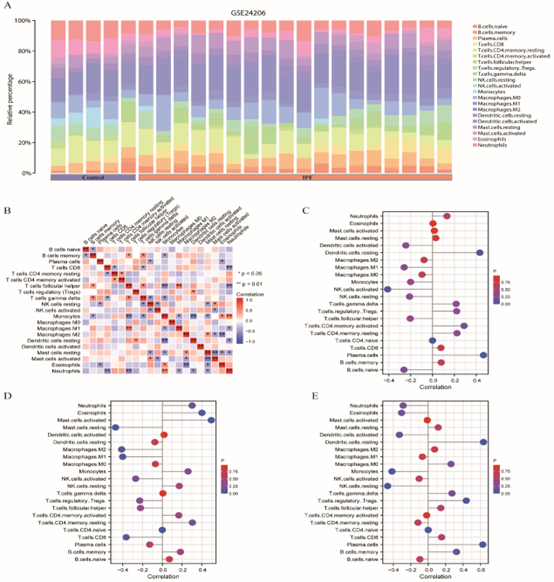
Figure 12: Assessment and Visualization of Immune Cell Infiltration. A. GSE24206 data set, enriched to the underlying immune cell distribution heat map. B. GSE24206 dataset, enriched to the underlying immune cell distribution heat map. Ns represented P value ≥ 0.05, which was not statistically significant. * Represents P value less than 0.01 and highly statistically significant. C-E. Correlation between drug-related NRDEGs and abundance of immune cell infiltration Lollipop plot, NRDEGs were: CHL1 (C), EGFR (D), KRT14 (E). The X-axis represents the magnitude of correlation, and the Y-axis represents specific immune cells. The different colors of the circles represent the P value obtained by the correlation statistical method. The size of the circle represents the degree of correlation. The higher the degree of correlation, the larger the circle is. The greater the distance of the bar from 0, the higher the degree of correlation. NRDEGs: Differentially expressed genes of necroptosis
Results
Idiopathic pulmonary fibrosis is an interstitial lung disease with a crude mortality rate represented by a progressive decline in respiratory function. With the development of bioinformatics tools, several intricate biological systems can now be solved.These tools have been extensively used in the study of disease-causing genes [40]. However, owing to the small number of studies, the pathogenesis of IPF is not fully understood. The identification of novel molecular therapeutic targets and biomarkers can be used to assess the prognosis and treatment of IPF. An earlier bioinformatic study discovered that the MAPK signaling pathway is associated with the occurrence and progression of IPF and that DEGs may be potential targets and biomarkers of the disease [39].
Necroptosis plays a significant role in the pathogenesis of many conditions, such as liver and kidney injury, cardiovascular disease, tumor progression, and metabolic disease [28]. Dysregulated necroptosis genes may contribute to IPF progression. The aim of this study was to clarify the connection between the differential expression of necroptosis genes and IPF, further explore the possible pathogenic genes related to IPF, use bioinformatic methods to clarify the key differential genes and signaling pathways involved in the pathogenesis of IPF, and identify new drug targets. In this study, we identified 44 DEGs associated with necroptosis in IPF and normal tissues.
According to GO analysis, the DEGs were primarily abundant in ficolin-1-rich granules, positive regulation of endopeptidase activity, and cysteine-type endopeptidase activity, which was connected to the T cell receptor signaling pathway and sphingolipid signaling pathway. The results of KEGG analysis demonstrated that the hub genes were enriched in the IL-17 signaling pathway, RIG-I-like receptor signaling pathway, and apoptosis. These biological pathways are involved in apoptosis, inflammation, and fibrotic remodeling. Other biological pathways that were significant and possibly pertinent to IPF were also identified using GSEA. Notably, the JAK/STAT and MAPK signaling pathways were enriched and active in IPF, which may promote extrinsic apoptosis and necroptosis.
Our analysis indicated potential drugs or molecular compounds for NRDEGs, specifically for CHL1, EGFR, and KRT14. The cell adhesion molecule L1, which is closely related to CHL1, is essential for the appropriate functioning of tumor and brain cells [29]. Overexpression of CHL1 may reduce inflammatory responses by inhibiting AKT activation [30]. EGFR is the first member of the ErbB receptor family and is involved in several cellular processes [31]. The expression of mucins, tissue injury, and carcinogenesis, which are linked to EGFR signaling, are significant consequences [32]. EGFR is upregulated in the hyperplastic alveolar epithelium in different forms of IPF, and is overexpressed in many cancers [33].
KRT14 is positively correlated with the metastasis of triple-negative breast cancer (TNBC), and deletion of KRT14 significantly reduces the migration, invasion, and peritoneal metastasis of TNBC [34]. KRT14 is absent in the distal airways of healthy lungs and plays an important role in the human pulmonary epithelial cells of IPF [35, 36].
The immune microenvironment is a hotspot for cancer and other related diseases. Lung cancer and IPF may have comparable pathogenic traits, including genetic sensitivity and mutations [37]. Many studies have found a variety of immune microenvironment disorders associated with elevated IPF risk, and different types of programmed cell death pathways may contribute to the pathogenesis of IPF development [38]. In our study, we found that 22 potential immune cells, including neutrophils, NK cells, and CD4+ and CD8+ cells, were enriched in both datasets. These findings may help in the development of new targeted therapeutic approaches to stop IPF progression.
The present study had several limitations. We need to carefully evaluate the results of our bioinformatic analysis in future experiments and clinical trials. Large prospective studies and those investigating the underlying mechanisms to verify our results and better guide clinical practice.
Conclusion
Bioinformatics analysis showed that IPF and normal lung tissue samples had significantly different expression levels of genes related to necroptosis. We found DEGs related to IPF necroptosis and a variety of immune cell infiltrates. Among these, CHL1, EGFR, and KRT14 and drugs and compounds related to NRDEGs might provide new targets for treatment. We hope that our findings will lead to the development of new drugs for IPF patients.
Abbreviations
IPF: Idiopathic pulmonary fibrosis;
GEO: Gene Expression Omnibus;
NRDEGs: Differentially expressed genes of necroptosis;
DEGs: Differentially expressed genes;
GSEA: Gene set enrichment analysis;
PPI: Protein-protein interaction;
GO: Gene Ontology;
KEGG: Kyoto Encyclopedia of Genes and Genomes;
NRGs: Necroptosis-related genes;
BP: Biological process;
MF: Molecular function;
CC: Cell component;
TFs: Transcription factors;
ROC: Receiver operating characteristic curve.
Declarations
Conflicts of Interest
The authors declare that there is no conflict of interest regarding the publication of this paper.
Funding
This study was supported by the Dalian Medical Science Research Program, no.2312014 and the Second Afiliated Hospital of Dalian Medical University.
Author Contributions
Lin Luo wrote the main manuscript text and Hongbo Fan analysed data and prepared figures 1-12. All authors reviewed the manuscript.
References
- Lederer, D. J., & Martinez, F. J. (2018). Idiopathic pulmonary fibrosis. New England Journal of Medicine, 378(19):1811-1823.
Publisher | Google Scholor - Raghu, G. (2019). Idiopathic pulmonary fibrosis: Shifting the concept to irreversible pulmonary fibrosis of many entities. The Lancet Respiratory Medicine, 7(11):926-929.
Publisher | Google Scholor - Richeldi, L., Collard, H. R., & Jones, M. G. (2017). Idiopathic pulmonary fibrosis. The Lancet, 389(10082):1941-1952.
Publisher | Google Scholor - Galluzzi, L., & Kroemer, G. (2008). Necroptosis: A specialized pathway of programmed necrosis. Cell, 135(7):1161-1163.
Publisher | Google Scholor - Choi, M. E., Price, D. R., Ryter, S. W., & Choi, A. M. K. (2019). Necroptosis: A crucial pathogenic mediator of human disease. JCI Insight, 4(15):e128834.
Publisher | Google Scholor - Vuga, L. J., Milosevic, J., Pandit, K., et al. (2013). Cartilage oligomeric matrix protein in idiopathic pulmonary fibrosis. PLoS One, 8(12):e83120.
Publisher | Google Scholor - Meltzer, E. B., Barry, W. T., D'Amico, T. A., et al. (2011). Bayesian probit regression model for the diagnosis of pulmonary fibrosis: Proof-of-principle. BMC Medical Genomics, 4, 70.
Publisher | Google Scholor - Davis, S., & Meltzer, P. S. (2007). GEOquery: A bridge between the Gene Expression Omnibus (GEO) and BioConductor. Bioinformatics, 14 :1846-1847.
Publisher | Google Scholor - Gautier, L., Cope, L., Bolstad, B. M., et al. (2004). affy—Analysis of Affymetrix GeneChip data at the probe level. Bioinformatics, 20(3):307-315.
Publisher | Google Scholor - Ginestet, C. (2011). ggplot2: Elegant graphics for data analysis. Journal of the Royal Statistical Society: Series A (Statistics in Society), 174(1):245-245.
Publisher | Google Scholor - Kolde, R. (2019). pheatmap: Pretty heatmaps (R package version 1.0.12).
Publisher | Google Scholor - Stelzer, G., Rosen, R., Plaschkes, I., et al. (2016). The GeneCards suite: From gene data mining to disease genome sequence analysis. Current Protocols in Bioinformatics, 54:1.30.1-1.30.33.
Publisher | Google Scholor - Gong, Y., Fan, Z., Luo, G., Yang, C., Huang, Q., Fan, K., Cheng, H., Jin, K., Ni, Q., Yu, X., & Liu, C. (2019). The role of necroptosis in cancer biology and therapy. Molecular Cancer, 18(1):100.
Publisher | Google Scholor - Najafov, A., Chen, H., & Yuan, J. (2017). Necroptosis and cancer. Trends in Cancer, 3(4):294-301.
Publisher | Google Scholor - Mi, H., et al. (2019). PANTHER version 14: More genomes, a new PANTHER GO-slim, and improvements in enrichment analysis tools. Nucleic Acids Research, 47(D1):D419-D426.
Publisher | Google Scholor - Kanehisa, M., & Goto, S. (2000). KEGG: Kyoto Encyclopedia of Genes and Genomes. Nucleic Acids Research, 28(1):27-30.
Publisher | Google Scholor - Yu, G., Wang, L.-G., Han, Y., & He, Q.-Y. (2012). clusterProfiler: An R package for comparing biological themes among gene clusters. OMICS: A Journal of Integrative Biology, 16(5):284-287.
Publisher | Google Scholor - Liberzon, A., et al. (2011). Molecular signatures database (MSigDB) 3.0. Bioinformatics, 27(12):1739-1740.
Publisher | Google Scholor - Szklarczyk, D., Gable, A. L., Lyon, D., et al. (2019). STRING v11: Protein-protein association networks with increased coverage, supporting functional discovery in genome-wide experimental datasets. Nucleic Acids Research, 47(D1):D607-D613.
Publisher | Google Scholor - Shannon, P., Markiel, A., Ozier, O., et al. (2003). Cytoscape: A software environment for integrated models of biomolecular interaction networks. Genome Research, 13(11):2498-2504.
Publisher | Google Scholor - Chin, C. H., Chen, S. H., Wu, H. H., Ho, C. W., Ko, M. T., & Lin, C. Y. (2014). cytoHubba: Identifying hub objects and sub-networks from complex interactome. BMC Systems Biology, 8(Suppl 4):S11.
Publisher | Google Scholor - Ru, Y., Mulvahill, M., Mahaffey, S., & Kechris, K. (2017). multiMiR: Integration of multiple microRNA-target databases with their disease and drug associations (R package version 0.98.0.2).
Publisher | Google Scholor - Yuan, R., Chen, S., & Wang, Y. (2020). Computational prediction of drug responses in cancer cell lines from cancer omics and detection of drug effectiveness related methylation sites. Frontiers in Genetics, 11:917.
Publisher | Google Scholor - Reinhold, W. C., Sunshine, M., Liu, H., et al. (2012). CellMiner: A web-based suite of genomic and pharmacologic tools to explore transcript and drug patterns in the NCI-60 cell line set. Cancer Research, 72(14):3499-3511.
Publisher | Google Scholor - Hastie, T., Tibshirani, R., Narasimhan, B., & Chu, G. (2020). impute: Imputation for microarray data (R package version 1.62.0).
Publisher | Google Scholor - Park, S. H., Goo, J. M., & Jo, C. H. (2004). Receiver operating characteristic (ROC) curve: Practical review for radiologists. Korean Journal of Radiology, 5(1):11-18.
Publisher | Google Scholor - Newman, A. M., Liu, C. L., Green, M. R., et al. (2015). Robust enumeration of cell subsets from tissue expression profiles. Nature Methods, 12(5):453-457.
Publisher | Google Scholor - Liu, Y., Liu, T., Lei, T., Zhang, D., Du, S., Girani, L., Qi, D., Lin, C., Tong, R., & Wang, Y. (2019). RIP1/RIP3-regulated necroptosis as a target for multifaceted disease therapy (Review). International Journal of Molecular Medicine, 44(3):771-786.
Publisher | Google Scholor - He, D., Du, Z., Xu, H., & Bao, X. (2022). Chl1, an ATP-dependent DNA helicase, inhibits DNA hybrids formation at DSB sites to maintain genome stability in S. pombe. International Journal of Molecular Sciences, 23(12):6631.
Publisher | Google Scholor - Tao, J., Liu, J., Yuan, Y. J., Shen, X., Cheng, H., & Li, G. Q. (2022). Impact and mechanism of CHL1 in insulin resistant adipocytes and insulin resistant mouse model induced by high glucose and high fat. Zhonghua Xin Xue Guan Bing Za Zhi, 50(11):1094-1102.
Publisher | Google Scholor - Murphrey, M. B., Quaim, L., & Varacallo, M. (2022, September 12). Biochemistry, epidermal growth factor receptor. In StatPearls. Treasure Island, FL: StatPearls Publishing.
Publisher | Google Scholor - Lai, K. M., & Lee, W. L. (2022). The roles of epidermal growth factor receptor in viral infections. Growth Factors, 40(1-2):46-72.
Publisher | Google Scholor - Tzouvelekis, A., Ntolios, P., Karameris, A., et al. (2013). Increased expression of epidermal growth factor receptor (EGF-R) in patients with different forms of lung fibrosis. Biomedical Research International, 654354.
Publisher | Google Scholor - Verma, A., Singh, A., Singh, M. P., Nengroo, M. A., Saini, K. K., Satrusal, S. R., et al. (2022). EZH2-H3K27me3 mediated KRT14 upregulation promotes TNBC peritoneal metastasis. Nature Communications, 13(1):7344.
Publisher | Google Scholor - Smirnova, N. F., Schamberger, A. C., Nayakanti, S., Hatz, R., Behr, J., & Eickelberg, O. (2016). Detection and quantification of epithelial progenitor cell populations in human healthy and IPF lungs. Respiratory Research, 17(1):83.
Publisher | Google Scholor - Gokey, J. J., Snowball, J., Sridharan, A., Speth, J. P., Black, K. E., et al. (2018). MEG3 is increased in idiopathic pulmonary fibrosis and regulates epithelial cell differentiation. JCI Insight, 3(17):e122490.
Publisher | Google Scholor - Lee, H. Y., Lee, J., Lee, C. H., Han, K., & Choi, S. M. (2021). Risk of cancer incidence in patients with idiopathic pulmonary fibrosis: A nationwide cohort study. Respirology, 26(2):180-187.
Publisher | Google Scholor - Jia, K., Wu, J., Li, Y., Liu, J., Liu, R., Cai, Y., Zhang, Y., & Li, X. (2022). A novel pulmonary fibrosis murine model with immune-related liver injury. Animal Models and Experimental Medicine, 5(3):261-270.
Publisher | Google Scholor - Li, N., Qiu, L., Zeng, C., et al. (2021). Bioinformatic analysis of differentially expressed genes and pathways in idiopathic pulmonary fibrosis. Annals of Translational Medicine, 9(18):1459.
Publisher | Google Scholor - Gauthier, J., Vincent, A. T., Charette, S. J., & Derome, N. (2019). A brief history of bioinformatics. Briefings in Bioinformatics, 20(6):1981-1996.
Publisher | Google Scholor