Case Report
Environmental Impact of Petroleum Pipelines on Vegetation Using LANDSAT 8 Within Warri and Environs, Southern Nigeria
1Department of Environmental Management and Toxicology, Faculty of Life Sciences, University of Benin.
2Department of Animal and Environmental Biology, Faculty of Life Sciences, University of Benin, Benin City, Nigeria.
3Department of Geology, Faculty of Physical Sciences, University of Beni, Benin City, Nigeria.
*Corresponding Author: Alex Enuneku, Department of Environmental Management and Toxicology, Faculty of Life Sciences, University of Benin.
Citation: Enuneku A, Okoh A, Uwadea G. Aigbogho, Oziofu A. Ehinlaiye. (2024). Environmental Impact of Petroleum Pipelines on Vegetation Using LANDSAT 8 Within Warri and Environs, Southern Nigeria. Clinical Case Reports and Studies, BioRes Scientia Publishers. 6(5):1-15. DOI: 10.59657/2837-2565.brs.24.171
Copyright: © 2024 Alex Enuneku, this is an open-access article distributed under the terms of the Creative Commons Attribution License, which permits unrestricted use, distribution, and reproduction in any medium, provided the original author and source are credited.
Received: August 19, 2024 | Accepted: September 20, 2024 | Published: October 04, 2024
Abstract
Nigeria is one of the largest oil producers in Africa, with a significant network of pipelines that transport crude oil and natural gas from extraction sites to refineries and export terminals. While pipelines are critical for the country's economy, they also have significant environmental impacts, both during construction and operation. This study was aimed at conducting an environmental impact of petroleum pipelines on vegetation using Landsat 8 within Warri and Environs, Southern Nigeria. The study area (latitude N5o14’23.9” to 6o3’3.6” and longitude E6o11’42.3” to E6o15’53.5”) covers pipeline route in and around Warri and environs. The pipeline runs west from Warri toward Ajudaibo, close to Escravos, southeast from Warri through Uzere, Ayagha among others and northwards through Okuabude, Ovade, Aragba Okpe, among others. The pipelines form a network of routes weaving through land use predominantly made up of vegetative forest, farmland, waterways and urban area. The pipelines are used to convey oil and gas to power stations, refineries, domestic outlets, export terminals, etc. Google Earth Engine (GEE) was used to access Landsat 8 data and generate Normalized Difference Vegetation Index (NDVI) maps. After selecting Landsat 8 data set imagery, it was filtered using the date range - 2015, 2016, 2017, 2018, 2019, 2020, 2021 and 2022. Results showed that NDVI values throughout the study ranged between -0.56484 in 2017 to 0.83643 in 2017. NDVI value along the pipeline route ranged between -0.29 in 2020 and 0.808 in 2017.Stressed vegetation was highest 2018 with coverage at 78.06 percent while no coverage was recorded for very healthy vegetation in 2015, 2018 and 2022.Stressed vegetation was occupied by 93.71 % of the pipeline route in 2018 while dead plants occupy about 1.08 percent in 2017. Pipeline route occupied by dead plant has been constant between 2015 and 2022 with a slight rise in 2022. Decline in vegetation health along the pipeline route was observed in 2018, resulting in 829,152 hectares of land subjected to stress from pipeline hazard. Also, vegetative recovery started in 2019 and continued to 2021 especially as there was no pipeline accident reported. This study has provided information on the impact on pipelines on surrounding vegetation. Therefore, there is need for continuous monitoring of pipelines to forestall incidences of leakages and sustenance of vegetative growth.
Keywords: NDVI; NIR; Nigeria
Introduction
Nigeria is one of the largest oil producers in Africa, with a significant network of pipelines that convey crude oil and natural gas from the point of extraction to the point of refineries and exporting terminals. While pipelines are critical for the country's economy, they also have significant environmental impacts, both during construction and operation. During construction, pipelines can cause extensive damage to ecosystems, including deforestation, soil erosion, and the destruction of wetlands and water resources. For example, the construction of the Trans-Saharan Gas Pipeline, which would transport natural gas from Nigeria to Europe, has raised concerns about the potential impacts on biodiversity and local communities (UNEP, 2015). During operation, pipelines in Nigeria are also prone to leaks, spills, and sabotage, releasing large quantities of crude oil and gas into the environment, causing serious health and environmental risks for nearby communities. For example, the 2012 Bonga oil spill, which occurred off the coast of Nigeria, released an estimated 40,000 barrels of crude oil into the ocean, which caused significant damage to the life of marine organisms and fisheries (Environ, 2012). A study by the Environmental Defense Fund estimated that natural gas production in Nigeria released 12.6 million metric tons of methane in 2015, equivalent to the annual emissions of more than 50 million cars (Schade et al., 2016). To mitigate the environmental impacts of pipelines in Nigeria, it is essential to ensure that they are built and operated with the highest standards of safety, transparency, and accountability. Remote sensing is the acquirement of information about the surface of the Earth from a distance, usually using satellites or aircraft. One of the most widely used remote sensing tools is the Normalized Difference Vegetation Index (NDVI). NDVI is a measure of vegetation health that is based on the difference between the reflectance of near-infrared and visible light. NDVI values range from -1 to 1, with higher values indicating healthier vegetation. The Normalized Difference Vegetation Index (NDVI) is a widely used remote sensing index for monitoring vegetation health and productivity. NDVI is calculated from the ratio of near-infrared (NIR) and red-light reflectance measurements, which can indicate the amount and condition of vegetation cover in a given area. NDVI can be measured using satellite imagery, aerial photography, or ground-based sensors. Satellite-based NDVI data is readily available and has been used in numerous studies to monitor vegetation dynamics and environmental changes on a global scale. Ground-based NDVI sensors, on the other hand, offer higher spatial resolution and can be used to measure vegetation health at a more localized level (Tucker, 1979) The versatility of NDVI makes it a valuable tool for a range of applications. Its ability to detect changes in vegetation health over time has made it particularly useful in monitoring climate change and its effects on the environment. As the demand for more accurate and up-to-date environmental data continues to grow, NDVI will undoubtedly play an increasingly important role in remote sensing and environmental monitoring. In addition, NDVI can be used to monitor crop health, predict crop yield, and detect plant stress, making it a valuable tool for agriculture and food security (Thenkabail et al, 2012). Landsat 8, a satellite launched by NASA in 2013, is a valuable tool for monitoring vegetation health using NDVI. Landsat 8 captures high-resolution images of the Earth's surface, including vegetation cover, and provides data that can be used to track changes in vegetation cover over time. By tracking changes in NDVI over time, we can monitor the health and productivity of vegetation, identify areas of stress or decline, and track the effects of climate change, land use, and other factors on vegetation cover especially around pipelines as indicated in this study. All things considered, NDVI is a useful instrument for tracking changes in the environment and the health of the plants, offering important data for managing natural resources, agriculture, and the environment. It has been employed in several research to track global vegetation dynamics and environmental changes (Wang, et al., 2019; Xiao, et al, 2016). Warri and its environs are located in the southern part of Nigeria, which falls within the tropical rainforest and coastal vegetation belt. The region experiences a tropical climate which has been characterized by high temperatures and humidity throughout the year, with an average annual temperature of 27-28°C and an average annual rainfall of about 2000mm (Nwilo et al., 2019). The rainy season in Warri usually starts in April and lasts until October, while the dry season runs from November to March (Ikhifa et al., 2021). The vegetation in the Warri and surrounding areas is mainly characterized by tropical rainforests, mangrove swamps, and freshwater swamp forests (Ikhifa et al., 2021). The rainforests in the region are known for their high species diversity and are dominated by tall trees with broad leaves. The mangrove swamps are dominated by trees and shrubs that can tolerate the saline conditions of the coastal environment. The freshwater swamp forests are characterized by trees and shrubs that grow in waterlogged soils. The vegetation in the Warri and surrounding areas is affected by various factors, including climate, soil type, and human activities such as oil and gas exploration and agricultural activities. Climate change and variability are also likely to have significant impacts on the vegetation in the region, including changes in species composition, distribution, and productivity (Nwilo et al., 2019). Finally, Warri and its environs have a rich and diverse vegetation cover, which provides important ecosystem services such as carbon sequestration, soil stabilization, and water regulation. However, the vegetation is also vulnerable to various threats, including deforestation, habitat fragmentation, and climate change, which could have significant impacts on the region's biodiversity and ecosystem functioning.
Materials and Methods Study Area
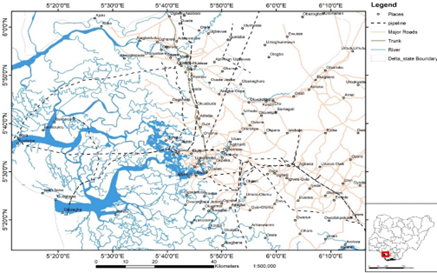
The study area lies between latitude N5o14’23.9” to 6o3’3.6” and longitude E6o11’42.3” to E6o15’53.5”. The study area covers pipeline route in and around Warri and environs. The pipeline runs west from Warri toward Ajudaibo, close to Escravos, southeast from Warri through Uzere, Ayagha among others and northwards through Okuabude, Ovade, Aragba Okpe, among others. The pipelines form a network of routes weaving through land use predominantly made up of vegetative forest, farmland, waterways and urban area. The pipelines are used to convey oil and gas to power stations, refineries, domestic outlets, export terminals, etc. Figure 3.1 shows the study area including the pipeline network.
Figure 1: Map of the study area
NDVI data type and data source
NDVI (Normalized Difference Vegetation Index) data can be classified into two types: raw NDVI data and processed NDVI data
Raw NDVI data refers to the digital numbers derived from the near-infrared and red bands of satellite or airborne imagery using the NDVI formula. This type of data requires further processing, such as atmospheric correction and geometric correction, to improve its accuracy.
Processed NDVI data, on the other hand, is derived from raw NDVI data that has been pre-processed to remove any errors and improve its accuracy. This type of data is often provided as a value between -1 and 1, where negative values indicate non-vegetated areas, values close to 0 indicate low vegetation density, and values close to 1 indicate high vegetation density. Thus, NDVI is a ration between the red and NIR bands

Where NIR is the surface reflectance in the spectral band centered around 830 nm and Red is the surface reflectance in the spectral band centered on 660nm (Tucker et al., 1979).
There are several sources of NDVI data, including satellite imagery, aerial photography, and unmanned aerial vehicles (UAVs). The most commonly used source of NDVI data is satellite imagery, which is available from several satellites, such as Landsat, Sentinel, MODIS, and SPOT.
These satellites provide global coverage and high spatial and temporal resolution data, which makes them useful for vegetation monitoring and analysis.
Method of data collection
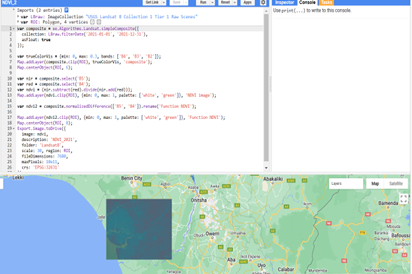
The google earth engine (GEE) which is a cloud-based platform was assessed with google chrome browser. The desired area was selected using the interactive map tool. After selecting Landsat 8 data set imagery, it was filtered using the date range (2015, 2016, 2017, 2018, 2019, 2020, 2021 and 2022) and other parameters such as cloud cover (less than 35 percent), to ensure that the data is suitable for analysis. The code editor in GEE was used to run the javascript code written to extract the NDVI data for the selected area and time period. The script was run and visualized using the map viewer available within the GEE. The NDVI imagery generated was exported to google drive and downloaded as Geographic Tagged Image File Format (GEOTIFF).
Figure 2: Google Earth Engine showing the source JavaScript and marked study area.
Methods and analysis
The downloaded GEOTIFF was imported into ArcGIS 10.8 environment. The images were clipped to reflect the study area and classified into 3 or 4 classes depending on the range of NDVI values present on the map using the reclassify tool within the spatial analyst package in ArcGIS toolbox. NDVI values ranging from -1 to 0, (representing non vegetation, dead plants or water bodies) were classified as low, 0 – 0-.33 (represented sparse or unhealthy or stressed vegetation) was classified as moderate, 0.33 – 0.66 (representing dense plant or moderately healthy vegetation) was classified as high and 0.66 – 1 (representing dense or health vegetation) was classified as very high. The percentage of NDVI values for each vegetation classes were calculated from their area coverage.
Results
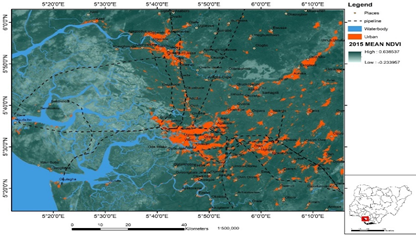
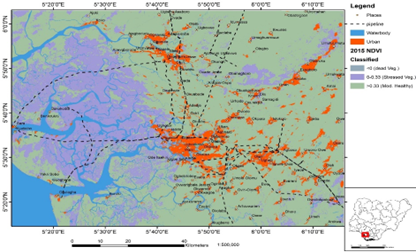
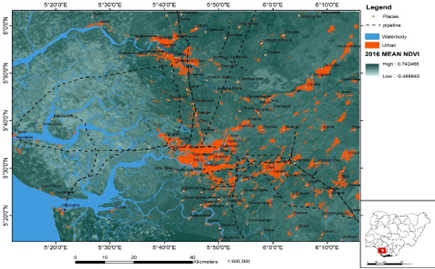
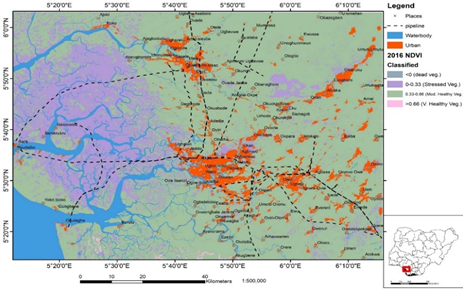
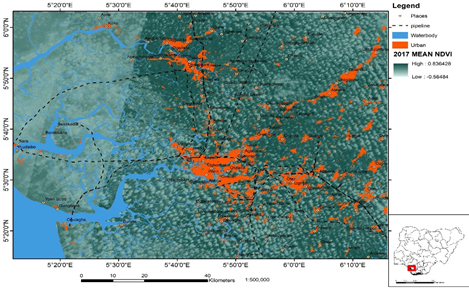
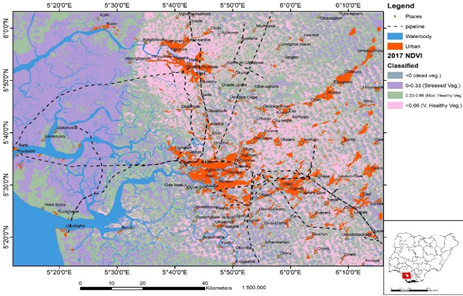
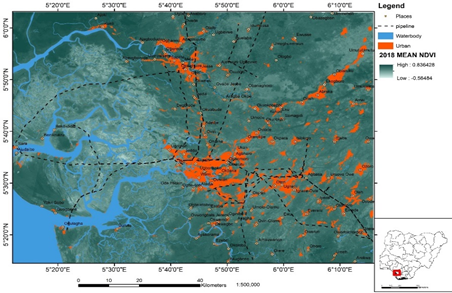
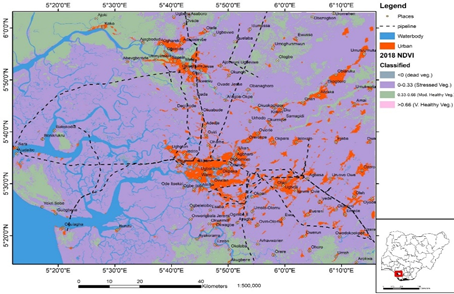
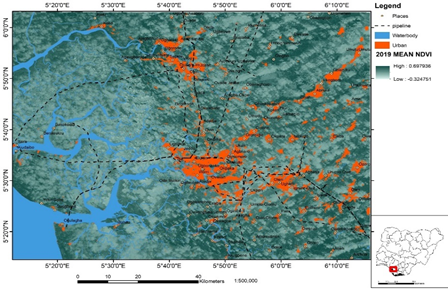
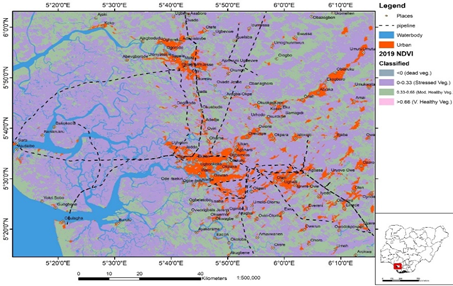
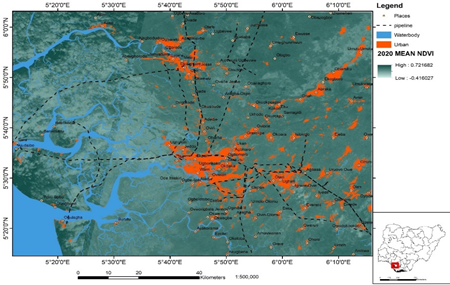
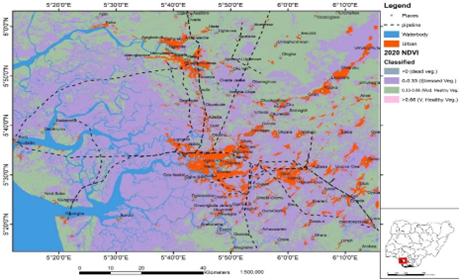
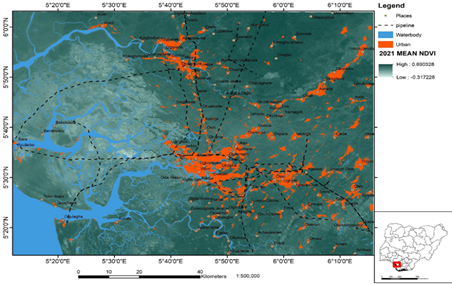
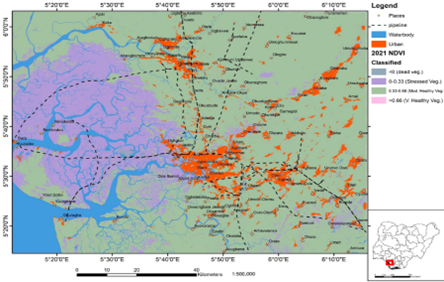
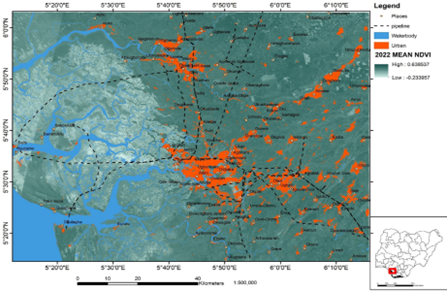
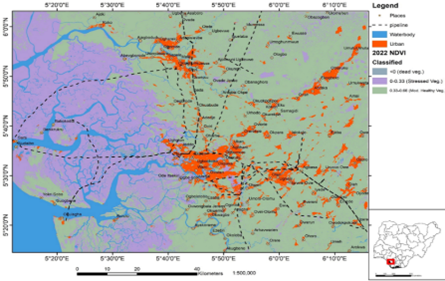
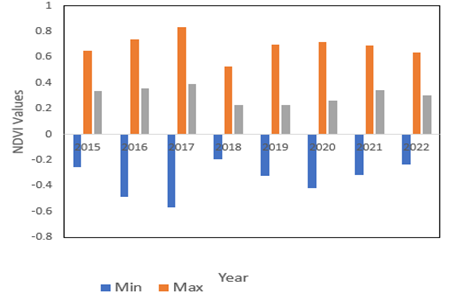
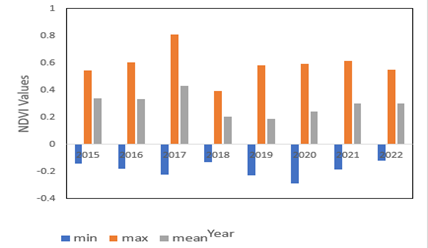
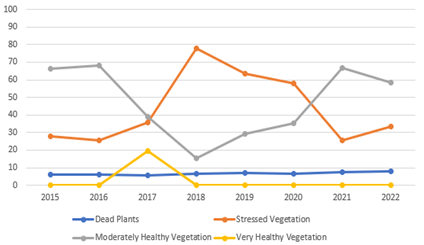
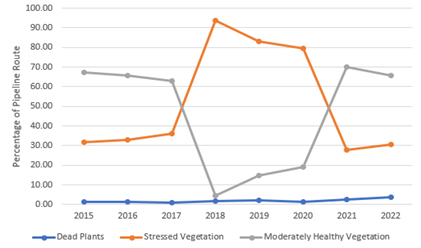
The analysis of Landsat 8 imagery was used to generate NDVI maps for the study area and is presented below. The NDVI values covers about eight years starting from 2015 to 2022. Google earth engine and ArcGIS 10.8 played a key role in the generation of these maps. NDVI values recorded within the study area for 2015 ranged from 0.6385 to -0.234 (Figure 4.1) while NDVI values for the pipeline route ranged between -0.123 and 0.548 (Figure 4.2). Classified NDVI values for 2015 are presented in Figure 4.3, 4.4 and table 4.1 and it shows that coverage for inanimate object is about 6.1% corresponding to 64776.4 hectares, coverage for Stressed vegetation was 27.7% corresponding to 294,502 hectares and coverage for moderately healthy vegetation was 66.2% representing 702,923 hectares. Figure 4.5 and table 4.2 showed that 1% of the total length of the pipeline fall within dead plant, 32% of the total length of the pipeline fall within unhealthy/stressed vegetation while 67% of the total length of the pipeline fall within moderately healthy vegetation as observed in the year 2015. NDVI values for 2016 ranged between -0.4886 to 0.74247 as shown in Figure 4.6 while NDVI values for the pipeline route were recorded as -0.178 for the lowest value and 0.603 for the highest value as presented in Figure 4.7. Figure 4.8 and figure 4.9 shows the classified NDVI values for the study area revealing four classes namely dead vegetation occupying 6.2% area coverage, stressed vegetation occupying 25.4% coverage, moderately healthy vegetation occupying 68.3% coverage and very healthy vegetation occupying 0.2% area coverage. Figure 4.10 show that about 1% of the pipeline length were within Dead plants, 33% of the pipeline length fall within unhealthy/stressed vegetation and 66% of the pipeline length fall within moderately healthy vegetation in 2016. In the year 2017, observed NDVI values ranged from -0.5648 to 0.8364 as shown in figure 4.11. Along the pipeline route, the lowest NDVI value was -0.223 while the highest NDVI value was 0.808 as shown in Figure 4.12. The study area was classified into Dead vegetation which covers about 6%, stressed vegetation covers about 36%, moderately healthy vegetation covers about 39% and very healthy vegetation covers about 19% of the study area based on the NDVI values as shown in Figure 4.13, 4.14 and Table 1. Figure 4.15 and Table 2 shows that 1% of the total length of the pipeline fall within dead plant, 36 percent fall within stressed vegetation and 63 percentage fall within moderately healthy vegetation for the year 2017. NDVI values recorded within the study area for 2018 ranged from -0.5648 to 0.83643 (Figure 4.16) while NDVI values for the pipeline route ranged between -0.134 and 0.392 (Figure 4.17). Classified NDVI values for 2018 are presented in Figure 4.18, 4.19 and Table 1 which shows about 6% area coverage for dead vegetation, 78% area coverage for stressed vegetation and 16% area coverage for moderately healthy vegetation as observed in the study area. Figure 4.20 and Table 2 shows that 2% of the total length of the pipeline fall within Dead plants, 94 Percentage fall within stressed vegetation while 4 percentage fall within moderately healthy vegetation as observed from the study area for the year 2018. NDVI values for 2019 ranged between -0.3248 to 0.6979 as shown in Figure 4.21 while NDVI values for the pipeline route were recorded as -0.228 for the lowest value and 0.582 for the highest value as presented in Figure 4.22. Figure 4.23, 4.24 and Table 1 shows the classified NDVI values for the study area revealing four classes namely dead vegetation occupying about 7% of the study area, stressed vegetation occupying 64% of the study area, moderately healthy vegetation occupying 29% of the study area and very healthy vegetation occupying less than 1% of the study area. Figure 4.25 and Table 2 shows that about 2% of the pipeline route fall within dead plants, 83 fall withing stressed vegetation while 15 Percentage fall within moderately healthy vegetation as observed in the study area for the year 2019. Observed 2020 NDVI values ranged from -0.41603 to 0.7217 as shown in figure 4.26. Along the pipeline route, the lowest NDVI value was -0.29 while the highest NDVI value was 0.595 as shown in Figure 4.27. The study area was classified into Dead vegetation with covers about 7 Percentage of the study area, stressed vegetation covering 58 Percentage of the study area, moderately healthy vegetation covering 35 Percentage of the study area and very healthy vegetation covering less than 1 Percentage of the study area based on the NDVI values as shown in Figure 4.28, 4.29 and Table 1. Figure 4.30 and Table 2 shows that less than 1 Percentage of the pipeline route falls within dead plants, 80 Percentage of the pipeline route fall within stressed vegetation and 19 Percentage of the pipeline route fall within the moderately healthy vegetation for the year 2020. NDVI values recorded within the study area for 2021 ranged from 0.6903 to -0.317 (Figure 4.31) while NDVI values for the pipeline route ranged between -0.188 and 0.615 (Figure 4.32). Classified NDVI values for 2021 are presented in Figure 4.33, 4.34 and Table 1 and it shows that dead plant occupies 7 Percentage of the study area, stressed vegetation occupies 26 Percentage of the study area, moderately healthy vegetation occupies 67 Percentage of the study area and very healthy vegetation occupy less than 1 Percentage of the study area. 2 Percentage of the pipeline route fall within dead plants, 28 Percentage fall within stressed vegetation and 70 Percentage fall within moderately healthy vegetation as shown in Figure 4.35 and Table 2 for the year 2021. NDVI values for 2022 ranged between -0.234 to 0.6385 as shown in Figure 4.36 while NDVI values for the pipeline route were recorded as -0.123 for the least value and 0.548 for the most value as presented in Figure 4.37. Figure 4.38, 4.39 and Table 1 shows the classified NDVI values revealing four classes namely dead vegetation covering 8 Percentage of the study area, stressed vegetation covering 34 Percentage of the study area and moderately healthy vegetation covering 58 Percentage of the study area. Figure 4.40 and Table 2 shows that 4 Percentage of the total pipeline length are within dead plants, 30 Percentage of the total pipeline length are within stressed vegetation while 66 Percentage of the total pipeline length are within moderately healthy vegetation in 2022. Figure 4.41 shows that minimum NDVI ranged from -0.195 in 2018 to -0.5648 in 2017, maximum NDVI ranged from 0.531 in 2018 to 0.836 in 2017 while mean NDVI values ranged from 0.231 in 2018 to 0.394 in 2017. Figure 4.42 shows that minimum NDVI values along the pipeline route ranged from -0.123 in 2022 to -0.29 in 2020, maximum NDVI values ranged between 0.392 in 2018 to 0.808 in 2017 while mean NDVI values ranged between 0.186 in 2019 to 0.433 in 2017. Figure 4.43 showed that the area coverage of the dead plant class was least at 5.7 Percentage in 2017 and most at 8.1 Percentage in 2022, area coverage of stressed vegetation was lowest representing 25.4 Percentage in 2016 and highest representing 78.1 Percentage in 2018, area coverage of the moderately healthy vegetation class was least at 15.5 Percentage in 2018 and most at 68.3 Percentage in 2016 while very healthy vegetation class was least at 0 Percentage in 2015, 2019, 2022 and highest at 19.5 Percentage in 2017. Figure 4.44 showed that the pipeline route falling within the dead plant class was 0.08 Percentage in 2017 representing the fewest length and 3.74 Percentage in 2022 representing the highest length, pipeline within the stressed vegetation class was lowest at 27.7 Percentage in 2021 and highest at 93.9 in 2018 while pipeline within the moderately healthy vegetation class ranged between 4.4 Percentage in 2018 and 70 Percentage in 2021.
Table 1: NDVI classification and percentage area coverage of the study area
| Year | NDVI Class range | NDVI Sub classes | Area (ha) | Percentage |
| 2015 | <0> | Dead Plant/Inanimate objects | 64776.4 | 6.098 |
| 0-0.33 | Unhealthy/Stressed Vegetation | 294502 | 27.726 | |
| 0.33-0.66 | Moderately Healthy Vegetation | 702923 | 66.176 | |
| 2016 | <0> | Dead Plant/Inanimate objects | 65434.3 | 6.16 |
| 0-0.33 | Unhealthy/Stressed Vegetation | 269687 | 25.389 | |
| 0.33-0.66 | Moderately Healthy Vegetation | 725058 | 68.26 | |
| >0.66 | Very Healthy Vegetation | 2022.22 | 0.19 | |
| 2017 | <0> | Dead Plant/Inanimate objects | 60966.6 | 5.74 |
| 0-0.33 | Unhealthy/Stressed Vegetation | 380376 | 35.81 | |
| 0.33-0.66 | Moderately Healthy Vegetation | 413304 | 38.91 | |
| >0.66 | Very Healthy Vegetation | 207555 | 19.54 | |
| 2018 | <0> | Dead Plant/Inanimate objects | 67796.4 | 6.383 |
| 0-0.33 | Unhealthy/Stressed Vegetation | 829152 | 78.06 | |
| 0.33-0.66 | Moderately Healthy Vegetation | 165248 | 15.557 | |
| 2019 | <0> | Dead Plant/Inanimate objects | 73247.5 | 6.896 |
| 0-0.33 | Unhealthy/Stressed Vegetation | 676634 | 63.701 | |
| 0.33-0.66 | Moderately Healthy Vegetation | 312301 | 29.401 | |
| >0.66 | Very Healthy Vegetation | 13.9488 | 0.001 | |
| 2020 | <0> | Dead Plant/Inanimate objects | 69836 | 6.575 |
| 0-0.33 | Unhealthy/Stressed Vegetation | 616206 | 58.013 | |
| 0.33-0.66 | Moderately Healthy Vegetation | 376033 | 35.412 | |
| >0.66 | Very Healthy Vegetation | 129.773 | 0.111 | |
| 2021 | <0> | Dead Plant/Inanimate objects | 77723.6 | 7.317 |
| 0-0.33 | Unhealthy/Stressed Vegetation | 273246 | 25.724 | |
| 0.33-0.66 | Moderately Healthy Vegetation | 711201 | 66.955 | |
| >0.66 | Very Healthy Vegetation | 33.439 | 0.003 | |
| 2022 | <0> | Dead Plant/Inanimate objects | 86350.1 | 8.121 |
| 0-0.33 | Unhealthy/Stressed Vegetation | 356675 | 33.546 | |
| 0.33-0.66 | Moderately Healthy Vegetation | 620211 | 58.332 |
Table 2: NDVI classification and percentage length coverage of the pipelines in the study area
| Year | NDVI Class range | NDVI Sub classes | Length (m) | percentage |
| 2015 | <0> | Dead Plant/Inanimate objects | 9440 | 1.19 |
| 0-0.33 | Unhealthy/Stressed Vegetation | 250200 | 31.64 | |
| 0.33-0.66 | Moderately Healthy Vegetation | 531090 | 67.16 | |
| 2016 | <0> | Dead Plant/Inanimate objects | 11180 | 1.43 |
| 0-0.33 | Unhealthy/Stressed Vegetation | 255560 | 32.73 | |
| 0.33-0.66 | Moderately Healthy Vegetation | 513990 | 65.83 | |
| 2017 | <0> | Dead Plant/Inanimate objects | 8450 | 1.08 |
| 0-0.33 | Unhealthy/Stressed Vegetation | 280770 | 35.96 | |
| 0.33-0.66 | Moderately Healthy Vegetation | 491480 | 62.95 | |
| 2018 | <0> | Dead Plant/Inanimate objects | 14430 | 1.85 |
| 0-0.33 | Unhealthy/Stressed Vegetation | 731611 | 93.71 | |
| 0.33-0.66 | Moderately Healthy Vegetation | 34690 | 4.44 | |
| 2019 | <0> | Dead Plant/Inanimate objects | 17620 | 2.26 |
| 0-0.33 | Unhealthy/Stressed Vegetation | 648540 | 83.07 | |
| 0.33-0.66 | Moderately Healthy Vegetation | 114570 | 14.67 | |
| 2020 | <0> | Dead Plant/Inanimate objects | 10340 | 1.32 |
| 0-0.33 | Unhealthy/Stressed Vegetation | 621240 | 79.57 | |
| 0.33-0.66 | Moderately Healthy Vegetation | 149150 | 19.10 | |
| 2021 | <0> | Dead Plant/Inanimate objects | 18090 | 2.32 |
| 0-0.33 | Unhealthy/Stressed Vegetation | 216150 | 27.69 | |
| 0.33-0.66 | Moderately Healthy Vegetation | 546490 | 70.00 | |
| 2022 | <0> | Dead Plant/Inanimate objects | 29210 | 3.74 |
| 0-0.33 | Unhealthy/Stressed Vegetation | 238550 | 30.55 | |
| 0.33-0.66 | Moderately Healthy Vegetation | 512970 | 65.70 |
Figure 4.1(a): Average NDVI values observed within the study area for year 2015
Figure 4.1(b): NDVI subclasses within the study area for year 2015
Figure 4.2(a): Average NDVI values observed within the study area for year 2016
Figure 4.2(b): NDVI subclasses within the study area for year 2016
Figure 4.3(a): Average NDVI values observed within the study area for year 2017
Figure 4.3(b): NDVI subclasses within the study area for year 2017
Figure 4.4(a): Average NDVI values observed within the study area for year 2018
Figure 4.4(b): NDVI subclasses within the study area for year 2018
Figure 4.5(a): Average NDVI values observed within the study area for year 2019
Figure 4.5(b): NDVI subclasses within the study area for year 2019
Figure 4.6(a): Average NDVI values observed within the study area for year 2020
Figure 4.6(b): NDVI subclasses within the study area for year 2020
Figure 4.7(a): Average NDVI values observed within the study area for year 2021
Figure 4.7(b): NDVI subclasses within the study area for year 2021
Figure 4.8a: Average NDVI values observed within the study area for year 2022
Figure 4.8(b): NDVI subclasses within the study area for year 2022
Figure 4.9: Histogram showing variation in minimum, maximum and mean NDVI values observed within the study area
Figure 4.10: Histogram showing variation in minimum, maximum and mean NDVI values observed along the pipeline route in the study area
Figure 4.11: Line chart showing the NDVI trend for different classes within the study area.
Figure 12: Line chart showing the trend along the pipeline route for different NDVI classes
Discussion
Variation in health of vegetation within the site and along the pipeline route was observed through the eight-year comparison using images derived from Landsat 8 acquired though the Google Earth Engine platform. In year 2015, dead vegetation class was very minimal across the study area, stressed vegetation occurred mostly towards the western part and in some patches in the eastern part while moderately healthy vegetation occurred around the eastern region of the study area and is the dominant class. Akinyemi et al. 2019 carried out similar research within the Niger Delta on NDVI in 2015 and observed that it ranged from 0.1 to 0.6 in affected areas and 0.3 to 0.8 in unaffected areas. Dead plant or inanimate objects recorded the least coverage followed by unhealthy/stressed vegetation and moderately healthy vegetation class covering most of the study area. Pipeline route falling within the dead plant was the fewest, followed by the stressed vegetation class and most of the pipeline route were within the moderately healthy vegetation class.
In 2016 NDVI distribution is similar to the pattern observed in 2015 with areas towards the west exhibiting low NDVI values. Most of the study areas fall within the moderately healthy vegetation class which is about 68% followed by the stressed vegetation class. The dead plant class covers a very low section while the very healthy vegetation class covers the lowest area at less than 1%. This research is comparable to that done in Lagos state by Alademomi et al., 2022, who found that NDVI values in 2016 ranged from -0.02 to 0.67 with a mean value of 0.36. Most of the pipeline route falls within the moderately stressed vegetation class while the least pipeline route falls within the dead plant class for the year 2016.
In the year 2017, the distribution of the NDVI were random and cut across the study area in patches. Areas covered by very healthy vegetation increased conspicuously when compared to the last two years. The distribution of the pipeline route is similar to the last two years with most of the pipeline route falling within the moderately healthy vegetation class while the least pipeline route fell within the dead plant class. When considering the NDVI values, they were not in line with the study done by Richard and Abah, 2019 in Port Harcourt, River state, which found that NDVI values in 2017 ranged from -0.28 to 0.11. The maximum value recorded in this research is very low compared to the maximum value recorded within the study area.
NDVI values recorded in 2018 were mostly below 0.4 which is a deviation from the previous three years. Most of the study area showed were within the stressed vegetation class and occurred around the central area while the moderately healthy vegetation class occupied the boundary regions in the north and south. Similar research carried out by Nse et al., 2020 in Uyo, Akwa Ibom state observed that NDVI values in 2018 ranged from -0.19 to 0.8. The pipeline route also showed similar trends with more than 90% occupying the stressed vegetation class. Pipelines within the moderately healthy vegetation reduced significantly while those within the dead plant class increased when compared to the last three years.
NDVI values in 2019 showed varying distribution between the low and high values, with some considerable section falling above 0.4. This shows a little improvement when compared to the previous year. Stressed vegetation class was still dominant and scattered all over the study area while moderately healthy vegetation class was the next dominant and also occurring all over the study area. The pipeline route within the stressed vegetation class showed a reduction from 94% to 83% while the pipeline route within the moderately healthy vegetation class increased from 4% to 15% when compared to year 2018. This research is comparable to that done in Lagos state by Alademomi et al., 2022, who found that NDVI values in 2019 ranged from -0.03 to 0.73 with a mean value of 0.36.
2020 NDVI values were similar to those recorded in the previous year in terms of distribution. Majority of the study is the stressed vegetation class followed by the moderately healthy vegetation class and distribution are similar. Pipeline route within the moderately healthy vegetation class increased to 19% in 2020. Comparing the values recoded within the study area to the study done by Nwaerema and Ajiere, 2020 in the coastal settlement of Rivers state, found out that NDVI values in 2020 ranged from -0.5436 to 0.40933. Njoku and Tenenbaum, 2022 also carried out similar research in Ilorin metropolis and recorded NDVI values ranging from 0.02 – 0.5.
High NDVI values were commonly towards the east and the low ndvi values were towards the west. Area coverage for NDVI greater than 4 improved significantly when compared to the previous year. The moderately healthy vegetation class improved and became the dominant class followed by the stressed vegetation class while the dead plant class was the least. Pipeline route within moderately healthy vegetation class improved to 70% in the year 2021 when compared to the previous year. When comparing the NDVI values recorded in the study area with the values recorded in the research carried out in Akwa Ibom state by Udoma-Michaels and Akinola, (2022), they found out that NDVI values in 2021 ranged from 0.2503 to 0.4631.
In year 2022, minimum, maximum and mean values of NDVI for the study area was -0.23396, 0.63854 and 0.30041 respectively while the minimum, maximum and mean values of NDVI for the pipeline route was -0.123, 0.548 and 0.3 respectively. The distribution of NDVI values in 2022 as compared to 2021 showed a lot of similarities in coverage and position. Moderately healthy vegetation class was the dominant while Dead plant class was the least dominant. Most of the pipeline route were also within the moderately healthy vegetation class while the dead plant class accommodated the least pipeline route.
This research focused on the pipeline route, and it was observed that there were changes over the years. Figure 4.43 shows that the section of the pipeline route falling within the dead plants has remained constant and slightly rising towards 2022. The significant observation is the section of the pipeline within the stressed and moderately healthy vegetation. It was observed that there was a sharp drop in the characteristics of the vegetation around the pipeline in 2018. This could be attributed to a pipeline accident reported by Reuters in this link: Explosion hits major gas pipeline in Nigeria | Reuters. The pipeline running from Escravos, through Warri to Lagos was severely hit and hence the drop in the vegetation health around the pipeline. The recovery of the vegetation took about three (3) years and not until 2021 before it returned to the pre-accident conditions.Variation in health of vegetation within the site and along the pipeline route was observed through the eight-year comparison using images derived from Landsat 8 acquired though the Google Earth Engine platform. In year 2015, dead vegetation class was very minimal across the study area, stressed vegetation occurred mostly towards the western part and in some patches in the eastern part while moderately healthy vegetation occurred around the eastern region of the study area and is the dominant class. Akinyemi et al. 2019 carried out similar research within the Niger Delta on NDVI in 2015 and observed that it ranged from 0.1 to 0.6 in affected areas and 0.3 to 0.8 in unaffected areas. Dead plant or inanimate objects recorded the least coverage followed by unhealthy/stressed vegetation and moderately healthy vegetation class covering most of the study area. Pipeline route falling within the dead plant was the fewest, followed by the stressed vegetation class and most of the pipeline route were within the moderately healthy vegetation class.
In 2016 NDVI distribution is similar to the pattern observed in 2015 with areas towards the west exhibiting low NDVI values. Most of the study areas fall within the moderately healthy vegetation class which is about 68% followed by the stressed vegetation class. The dead plant class covers a very low section while the very healthy vegetation class covers the lowest area at less than 1%. This research is comparable to that done in Lagos state by Alademomi et al., 2022, who found that NDVI values in 2016 ranged from -0.02 to 0.67 with a mean value of 0.36. Most of the pipeline route falls within the moderately stressed vegetation class while the least pipeline route falls within the dead plant class for the year 2016.
In the year 2017, the distribution of the NDVI were random and cut across the study area in patches. Areas covered by very healthy vegetation increased conspicuously when compared to the last two years. The distribution of the pipeline route is similar to the last two years with most of the pipeline route falling within the moderately healthy vegetation class while the least pipeline route fell within the dead plant class. When considering the NDVI values, they were not in line with the study done by Richard and Abah, 2019 in Port Harcourt, River state, which found that NDVI values in 2017 ranged from -0.28 to 0.11. The maximum value recorded in this research is very low compared to the maximum value recorded within the study area.
NDVI values recorded in 2018 were mostly below 0.4 which is a deviation from the previous three years. Most of the study area showed were within the stressed vegetation class and occurred around the central area while the moderately healthy vegetation class occupied the boundary regions in the north and south. Similar research carried out by Nse et al., 2020 in Uyo, Akwa Ibom state observed that NDVI values in 2018 ranged from -0.19 to 0.8. The pipeline route also showed similar trends with more than 90% occupying the stressed vegetation class. Pipelines within the moderately healthy vegetation reduced significantly while those within the dead plant class increased when compared to the last three years.
NDVI values in 2019 showed varying distribution between the low and high values, with some considerable section falling above 0.4. This shows a little improvement when compared to the previous year. Stressed vegetation class was still dominant and scattered all over the study area while moderately healthy vegetation class was the next dominant and also occurring all over the study area. The pipeline route within the stressed vegetation class showed a reduction from 94% to 83% while the pipeline route within the moderately healthy vegetation class increased from 4% to 15% when compared to year 2018. This research is comparable to that done in Lagos state by Alademomi et al., 2022, who found that NDVI values in 2019 ranged from -0.03 to 0.73 with a mean value of 0.36.
2020 NDVI values were similar to those recorded in the previous year in terms of distribution. Majority of the study is the stressed vegetation class followed by the moderately healthy vegetation class and distribution are similar. Pipeline route within the moderately healthy vegetation class increased to 19% in 2020. Comparing the values recoded within the study area to the study done by Nwaerema and Ajiere, 2020 in the coastal settlement of Rivers state, found out that NDVI values in 2020 ranged from -0.5436 to 0.40933. Njoku and Tenenbaum, 2022 also carried out similar research in Ilorin metropolis and recorded NDVI values ranging from 0.02 – 0.5.
High NDVI values were commonly towards the east and the low ndvi values were towards the west. Area coverage for NDVI greater than 4 improved significantly when compared to the previous year. The moderately healthy vegetation class improved and became the dominant class followed by the stressed vegetation class while the dead plant class was the least. Pipeline route within moderately healthy vegetation class improved to 70% in the year 2021 when compared to the previous year. When comparing the NDVI values recorded in the study area with the values recorded in the research carried out in Akwa Ibom state by Udoma-Michaels and Akinola, (2022), they found out that NDVI values in 2021 ranged from 0.2503 to 0.4631.
In year 2022, minimum, maximum and mean values of NDVI for the study area was -0.23396, 0.63854 and 0.30041 respectively while the minimum, maximum and mean values of NDVI for the pipeline route was -0.123, 0.548 and 0.3 respectively. The distribution of NDVI values in 2022 as compared to 2021 showed a lot of similarities in coverage and position. Moderately healthy vegetation class was the dominant while Dead plant class was the least dominant. Most of the pipeline route were also within the moderately healthy vegetation class while the dead plant class accommodated the least pipeline route.
This research focused on the pipeline route, and it was observed that there were changes over the years. Figure 4.43 shows that the section of the pipeline route falling within the dead plants has remained constant and slightly rising towards 2022. The significant observation is the section of the pipeline within the stressed and moderately healthy vegetation. It was observed that there was a sharp drop in the characteristics of the vegetation around the pipeline in 2018. This could be attributed to a pipeline accident reported by Reuters in this link: Explosion hits major gas pipeline in Nigeria | Reuters. The pipeline running from Escravos, through Warri to Lagos was severely hit and hence the drop in the vegetation health around the pipeline. The recovery of the vegetation took about three (3) years and not until 2021 before it returned to the pre-accident conditions.
Conclusion
NDVI values for the study area ranged between -0.56484 in 2017 and 0.83643 in 2017. NDVI value along the pipeline route ranged between -0.29 in 2020 and 0.808 in 2017. Stressed Vegetation in 2018 was the highest coverage at 78.06 percent while no coverage was recorded for very healthy vegetation in 2015, 2018 and 2022. Stressed vegetation was occupied by 93.71 % of the pipeline route in 2018 while dead plants occupy about 1.08 percent in 2017. Pipeline route occupied by dead plant has been constant between 2015 and 2022 with a slight rise in 2022. A sharp decline in vegetation health along the pipeline route was observed in 2018. As a result, 829, 152 ha of land was subjected to stress from pipeline hazard. This will also affect faunas and floras inhabiting the vegetation around the pipeline. Recovery started in 2019 and continued in 2020 and 2021 especially as there was no pipeline accident reported. NDVI analysis is a powerful tool in monitoring vegetation health around pipeline routes.
References
- Alademomi, A.S., Okolie, C. J., Daramola, O. E., Akinnusi, S. A., Adediran, E., Olanrewaju, H.O., Alabi, O. A., Salami, T. J. and Odumosu, J. (2022). Correction to: The interrelationship between LST, NDVI, NDBI, and land cover change in a section of Lagos metropolis, Nigeria. Appl. Geomat. 14:571-572
Publisher | Google Scholor - Environ. (2012). Bonga Oil Spill: Assessment of the Environmental and Socio-economic Impacts. National Oil Spill Detection and Response Agency.
Publisher | Google Scholor - Ikhifa, O. S., Olofin, E. A., and Osakwe, S. A. (2021). Spatial Pattern and Diversity of Tree Species in Oloibiri Oilfield and Environs, Niger Delta, Nigeria. Tropical Plant Research, 8(2): 440-446.
Publisher | Google Scholor - Njoku, E. A. and Tenenbaum, D. E. (2022), Quantitative assessment of the relationship between land use/land cover (LULC), topographic elevation and land surface temperature (LST) in Ilorin, Nigeria. Remote Sensing Applications: Society and Environment, 27:12p.
Publisher | Google Scholor - Nwilo, P. C., Ubi, B. E., and Ede, P. N. (2019). Climate change and its implications on vegetation patterns in the Niger Delta region of Nigeria. African Journal of Environmental Science and Technology, 13(10):302-313
Publisher | Google Scholor - Richard J. U., and Abah, I. A. (2019). “Derivation of Land Surface Temperature (LST) from Landsat 7 & 8 Imageries and its relationship with two vegetation indices (NDVI and GNDVI).” International Journal of Research - Granthaalayah, 7(2):108-120.
Publisher | Google Scholor - Schade, G., Petron, G., Frost, G., Miller, B., and Simpson, I. (2016). Nigeria's gas flaring reduction: Methane emissions reduction from natural gas production. Environmental Defense Fund.
Publisher | Google Scholor - Thenkabail, P. S., Lyon, J. G., AND Huete, A. (2012). Hyperspectral remote sensing of vegetation. CRC Press.
Publisher | Google Scholor - Tucker, C. J., Elgin, J. H., McMurtrey, J. E., and Fan, C. J. (1979). Monitoring corn and soybean crop development with hand-held radiometer spectral data. Remote Sensing of Environment, 8(3):237-248.
Publisher | Google Scholor - Udoma-Michaels, D. and Akinola, O. (2022), Analysis of vegetation index of protected forest in Akwa Ibom State, Nigeria between 2000 and 2021. Open Access Library Journal, 9:1-17.
Publisher | Google Scholor - United Nations Environment Programme. (2015). Environmental Assessment of the Proposed Trans-Saharan Gas Pipeline.
Publisher | Google Scholor - Wang, J., Zhang, X., Huete, A., and Wang, X. (2019). Remote sensing of vegetation phenology using NDVI and EVI over China from 1982 to 2015. Remote Sensing, 11(2):134.
Publisher | Google Scholor - Xiao, X., Zhang, Q., Saleska, S., Hutyra, L., De Camargo, P., Wofsy, S., Frolking, S., Boles, S., Chowdhury, D., Goulden, M., Kelley, N., Moore, B., Schimel, D., & Braswell, B. (2016). Satellite-based modeling of gross primary production in a seasonally moist tropical evergreen forest. Remote Sensing of Environment, 177:231-244.
Publisher | Google Scholor

