
Research Article
Enamel Wear Opposing Ultra Translucent Zirconia with Two Surface Treatments
Department of Conservative Dentistry and Implant, Faculty of Dentistry, Alexandria University, Egypt.
*Corresponding Author: Samir Koheil, Department of Conservative Dentistry and Implant, Faculty of Dentistry, Alexandria University, Egypt.
Citation: Koheil S. (2025). Enamel Wear Opposing Ultra Translucent Zirconia with Two Surface Treatments. Clinical Research and Reports, BioRes Scientia Publishers. 4(2):1-17. DOI: 10.59657/2995-6064.brs.25.052
Copyright: © 2025 Samir Koheil, this is an open-access article distributed under the terms of the Creative Commons Attribution License, which permits unrestricted use, distribution, and reproduction in any medium, provided the original author and source are credited.
Received: February 10, 2025 | Accepted: March 04, 2025 | Published: March 13, 2025
Abstract
Introduction: Tooth wear is a multi-factorial complicated process which is strongly influenced by the type of the ceramic.
Objective: to determine the enamel wear behavior and surface roughness when opposing ultra-translucent zirconia (Katana UTML) after two surface treatments.
Materials and methods: Ultra-translucent zirconia (Katana UTML). 14 zirconia specimens were divided into 2 sub-groups; 7glazed and 7polished. Each sub-group consisted of 7 zirconia specimens and 7 enamel antagonists. A group of natural enamel was used as a control group. Zirconia specimens will be cut in the form of discs of diameter = 10mm, and thickness = 5mm. The zirconia specimens and the enamel antagonists were subjected to 140,000 strokes with vertical load 50N. The amount of wear was determined on the basis of weight loss... Data were analyzed with a 1-way ANOVA and Games-Howell post hoc tests (α=.05).
Results: Polished UTML zirconia caused significantly less antagonist wear than the glazed UTML. While the natural enamel showed the highest antagonist wear.
Conclusion: Within the limitations of this study, polished translucent zirconia is more wear friendly to the antagonist enamel than the glazed translucent zirconia and the natural enamel.
Keywords: CAD/CAM; monolithic; enamel wear; ultra-translucent zirconia
Introduction
Weight loss percentage of the enamel antagonists
The mean percentage weight loss of the opposing enamel antagonists is shown in table (1) and graph (2). The mean percentage weight loss of the enamel opposing super translucent glazed zirconia was (4.928±0.608%), and the mean percentage weight loss of the enamel opposing super translucent polished zirconia (4.321 ± 0.282%). While the mean percentage weight loss of the enamel opposing ultra-translucent glazed zirconia was (3.932 ± 0.386 %), and the mean percentage weight loss of the enamel opposing ultra-translucent polished zirconia was (3.286 ± 0.588%). The mean percentage weight loss of the control group was (5.335 ± 0.324 %). Statistical analysis was done by one-way Anova test showed high statistical significance between the five groups (P< 0.0001*). Statistical comparison of the percentage weight loss of the enamel antagonists was done using Games-Howell method showed that super translucent glazed enamel antagonists were statistically significant different from ultra-translucent glazed enamel antagonists and ultra-translucent polished enamel antagonists. It also showed that the percentage weight loss of super translucent polished enamel antagonists was statistically different from that of ultra-translucent polished enamel antagonists and the control group. While the percentage weight loss of ultra-translucent glazed enamel antagonists was statistically significant from that of super translucent glazed enamel antagonists and the control group. And the percentage weight loss of ultra-translucent polished enamel antagonists was statistically significant from that of super translucent glazed enamel antagonists, super translucent polished enamel antagonists and the control group. Finally, the percentage weight loss of control group was statistically significant from that of super translucent polished enamel antagonists, ultra-translucent glazed enamel antagonists, and ultra-translucent polished enamel antagonists.
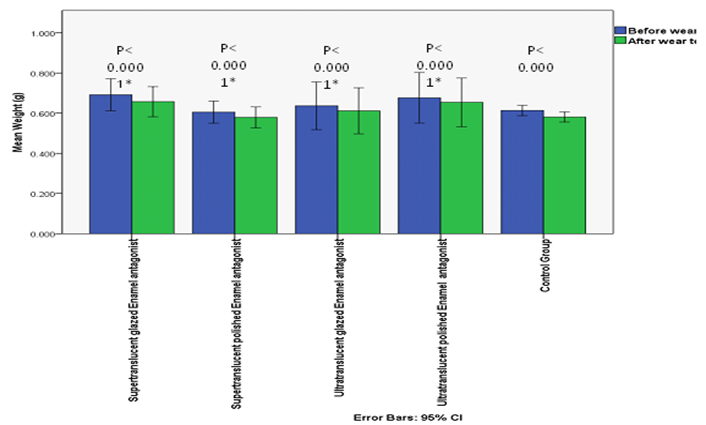
Graph 1: Mean weight of the enamel antagonists before and after the wear test.
Table 1: Comparison according to percentage of weight loss after wear test between the enamel antagonists.
| Super-translucent glazed Enamel antagonist (A1.2) | Super-translucent polished Enamel Antagonist (A2.2) | Ultra-translucent glazed Enamel antagonist (B1.2) | Ultra-translucent polished Enamel antagonist (B2.2) | Control group (C1 &C2) | |
| % Weight Loss | |||||
| Mean ± SD | 4.928±0.608 | 4.321±0.282 | 3.932±0.386 | 3.286±0.588 | 5.335±0.324 |
| Min-Max | 3.791-5.562 | 3.948-4.720 | 3.460-4.567 | 2.470-4.228 | 4.756-5.806 |
| Test of significance | F(df=4) =27.807 | ||||
| P value | P Less than 0.0001* | ||||
Min-Max: Minimum – Maximum; SD: Standard Deviation; df=degree of freedom; *: Statistically significant (p Less than 0.05)
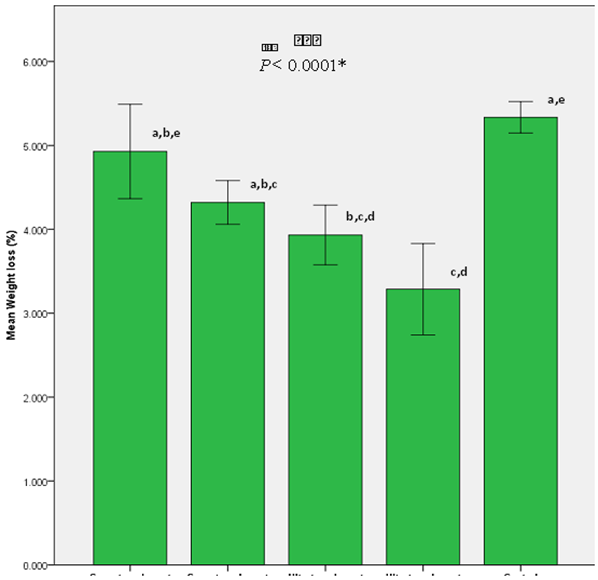
Graph 2: Weight loss percentage of the enamel antagonists after wear test. Different letters indicate pair-wise significance using Games-Howell method.
Surface roughness test
Quantitative analysis
Zirconia Specimens
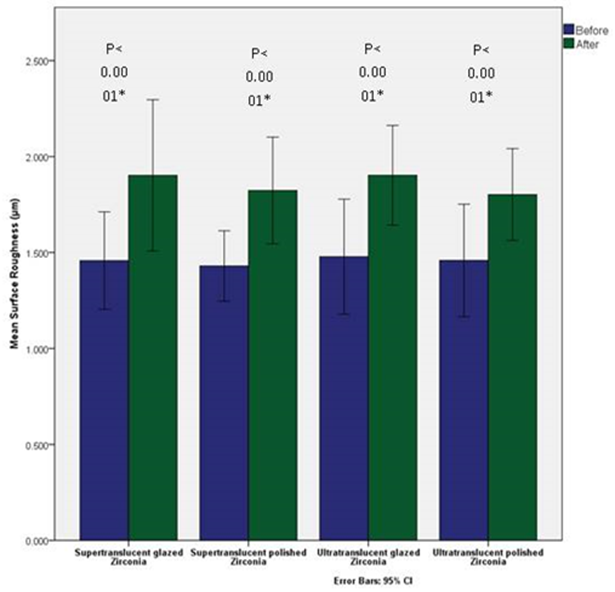
The mean surface roughness of the zirconia specimens before and after the wear test is shown in table (2) and graph (3). The mean surface roughness values of Super Translucent glazed zirconia specimens (group A1.1) were (1.458 ± 0.275 µm) before test, and (1.902 ± 0.426 µm) after wear. While, the mean surface roughness values of Super Translucent polished zirconia specimens (group A2.1) were (1.430 ± 0.198 µm) before test, and (1.823 ± 0.301µm) after wear. The mean surface roughness values of Ultra Translucent glazed zirconia specimens (group B1.1) were (1.479 ± 0.324 µm) before test, and (1.903 ± 0.281 µm) after wear. While, the mean surface roughness values of Ultra Translucent polished zirconia specimens (group B2.1) were (1.459 ± 0.317 µm) before test, and (1.802 ± 0.259 µm) after wear. Statistical comparison by applying Paired-T test revealed that there is a high statistical difference between the surface roughness of each group before and after wear simulation (P Less than 0.0001*).
Table 2: Comparison according to the mean surface roughness before and after the wear test between the zirconia specimens.
| Supertranslucent glazed Zirconia specimens (A1.1) | Supertranslucent polished Zirconia specimens (A2.1) | Ultratranslucent glazed Zirconia specimens (B1.1) | Ultratranslucent polished Zirconia specimens (B2.1) | |
| Surface Roughness before wear test (um) | ||||
| - Mean ± SD | 1.458±0.275 | 1.430±0.198 | 1.479±0.324 | 1.459±0.317 |
| - Min-Max | 1.122-1.955 | 1.239-1.787 | 1.000-1.950 | 1.098-1.950 |
| Surface Roughness After wear test (um) | ||||
| - Mean ± SD | 1.902±0.426 | 1.823±0.301 | 1.903±0.281 | 1.802±0.259 |
| - Min-Max | 1.363-2.593 | 1.591-2.424 | 1.448-2.236 | 1.545-2.265 |
| Test of | ||||
| significance | t=7.089 | t=8.982 | t=10.542 | t=9.402 |
| p value | P less than 0.0001* | P less than 0.0001* | P less than 0.0001* | P less than 0.0001* |
Min-Max: Minimum – Maximum; SD: standard Deviation; *: Statistically significant (P less than 0.0001*)
Graph 3: Mean surface roughness of zirconia discs before and after wear test.
Percentage of change in surface roughness of zirconia specimens after wear test
The mean percentage of change in surface roughness (Ra) of Super Translucent glazed zirconia specimens (group A1.1) was (29.740 ± 7.394%), while for Super Translucent polished zirconia specimens (group A2.1) was (27.210 ± 4.715%). The mean percentage of change in surface roughness (Ra) of Ultra Translucent glazed zirconia specimens (group B1.1) was (30.580±11.230%), and for the Ultra Translucent polished zirconia specimens (group B2.1) was (25.390±11.652%). Statistical comparison by applying One-Way Anova revealed no statistical difference between the surface roughness percentage change between the four groups of the zirconia specimens (P =0.708). Table 3 & graph 4.
Table 3: Comparison according surface roughness percentage change after wear test between the zirconia specimens.
| Supertranslucent glazed Zirconia specimens (A1.1) | Supertranslucent polished Zirconia specimens (A2.1) | Ultratranslucent glazed Zirconia specimens (B1.1) | Ultratranslucent polished Zirconia specimens (B2.1) | |
| Surface roughness % change | ||||
| - Mean ± SD | 29.740±7.394 | 27.210±4.715 | 30.580±11.230 | 25.390±11.652 |
| - Min-Max | 21.465-42.129 | 19.731-35.646 | 14.667-44.800 | 13.029-41.595 |
| Test of significance | F(df=3) =466 | |||
| p value | p=0.708 NS | |||
Min-Max: Minimum – Maximum; SD: Standard Deviation; df=degree of freedom; NS: Statistically not significant (p>0.05)
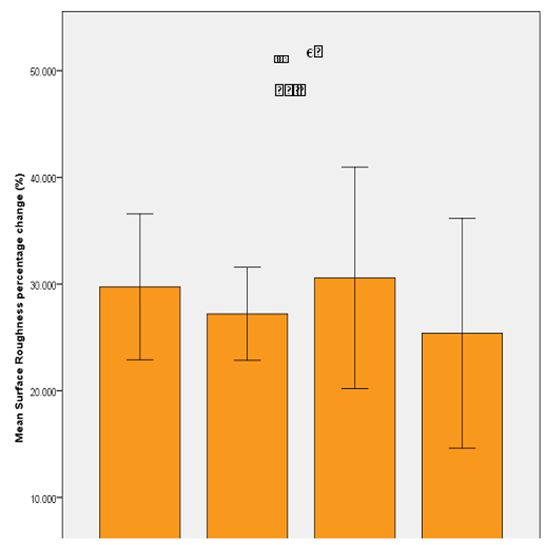
Graph 4: Surface roughness percentage of change of the zirconia specimens after wear test.
Enamel Antagonists
Mean surface roughness of enamel antagonists before and after wear test was listed in (Table 4 and graph 4.5). The mean surface roughness values of Super Translucent glazed enamel antagonists (group A1.2) were (1.623±0.327µm) before test, and (3.770 ± 0.096 µm) after wear. While, the mean surface roughness values of Super Translucent polished enamel antagonists (group A2.2) were (1.657±0.335µm) before test, and (3.313 ± 0.212 µm) after wear. The mean surface roughness values of Ultra Translucent glazed enamel antagonists (group B1.2) were (1.504±0.239µm) before test, and (2.872±0.114 µm) after wear. While, the mean surface roughness values of Ultra Translucent polished enamel antagonists (group B2.2) were (1.602±0.270µm) before test, and (2.462±0.183 µm) after wear. As for the control group, before the wear test the mean surface roughness was (1.563±0.233 µm), and after the wear test was (4.702 ± 0.396 µm). Statistical analysis by paired-T test showed that there was high statistical difference between the mean surface roughness of enamel antagonists before and after wear test in each group (P Less than 0.0001*).
Table 4: Comparison according to the mean surface roughness of the enamel antagonists before and after the wear test.
| Supertranslucent glazed Enamel antagonist (A1.2) | Supertranslucent polished Enamel Antagonist (A2.2) | Ultratranslucent glazed Enamel antagonist (B1.2) | Ultratranslucent polished Enamel antagonist (B2.2) | Control group (C1 &C2) | |
| Surface Roughness before wear test | |||||
| - Mean ± SD | 1.623±0.327 | 1.657±0.335 | 1.504±0.239 | 1.602±0.270 | 1.563±0.233 |
| - Min-Max | 1.215-2.144 | 1.191-2.227 | 1.215-1.900 | 1.226-1.900 | 1.035-1.900 |
| Surface Roughness after wear test | |||||
| - Mean ± SD | 3.770±0.096 | 3.313±0.212 | 2.872±0.114 | 2.462±0.183 | 4.702±0.396 |
| - Min-Max | 3.666-3.958 | 3.022-3.539 | 2.722-2.996 | 2.218-2.653 | 4.056-5.338 |
| Test of significance | t=16.952 | t=12.147 | t=11.643 | t=6.559 | t=25.514 |
| p value | P Less than 0.0001* | P Less than 0.0001* | P Less than 0.0001* | P Less than 0.0001* | P Less than 0.0001* |
Min-Max: Minimum – Maximum; SD: standard Deviation; *: Statistically significant (P Less than 0.0001*)
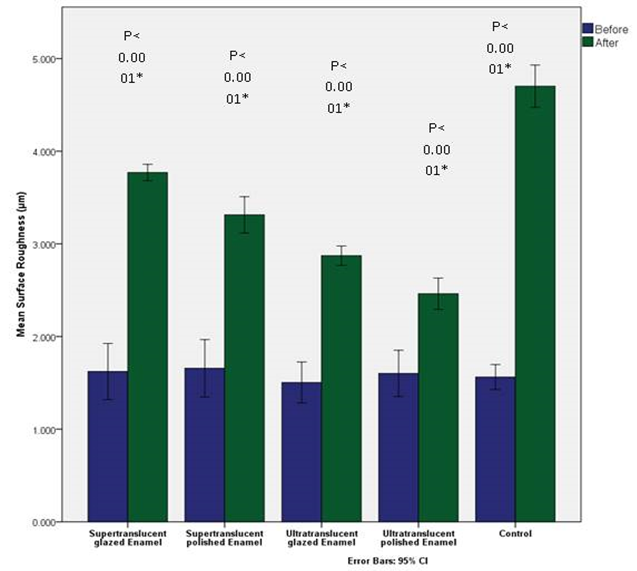
Graph 5: Mean surface roughness of enamel antagonists before and after wear test.
Surface roughness percentage of change of Enamel antagonists after wear test
The highest mean surface roughness percentage of change (208.378±63.170%) was with the control group (group C1 and group C2), while the lowest was (58.028 ± 32.760%) with the enamel specimens opposing polished Ultra Translucent zirconia (group B2.2). The mean surface roughness percentage of change for the enamel specimens against glazed Super Translucent zirconia (group A1.2) was (140.298 ± 47.264%), while for the enamel specimens against polished Super Translucent zirconia (group A2.2) was (106.128 ± 36.134%). And, the mean surface roughness percentage of change for the enamel specimens against glazed Ultra Translucent zirconia (group B1.2) was (95.296 ± 32.457%). One-Way Anova test showed high statistical significance between the surface roughness percentage of change between enamel antagonists’ groups (P Less than 0.0001*).
Table 5: Comparison according surface roughness percentage change after wear test between the enamel antagonists.
| Super translucent glazed Enamel antagonist (A1.2) | Super translucent polished Enamel Antagonist (A2.2) | Ultra-translucent glazed Enamel antagonist (B1.2) | Ultra-translucent polished Enamel antagonist (B2.2) | Control group (C1 & C2) | |
| - Mean ± SD | 140.298±47.264 | 106.128±36.134 | 95.296±32.457 | 58.028±32.760 | 208.378±63.170 |
| - Min-Max | 70.989-207.819 | 38.527-153.736 | 43.263-136.132 | 25.579-114.274 | 135.833-88.116 |
| Test of significance | t=14.420 | ||||
| p value | P Less than 0.0001* | ||||
Min-Max: Minimum – Maximum; SD: Standard Deviation; *: Statistically significant (P Less than 0.0001*)
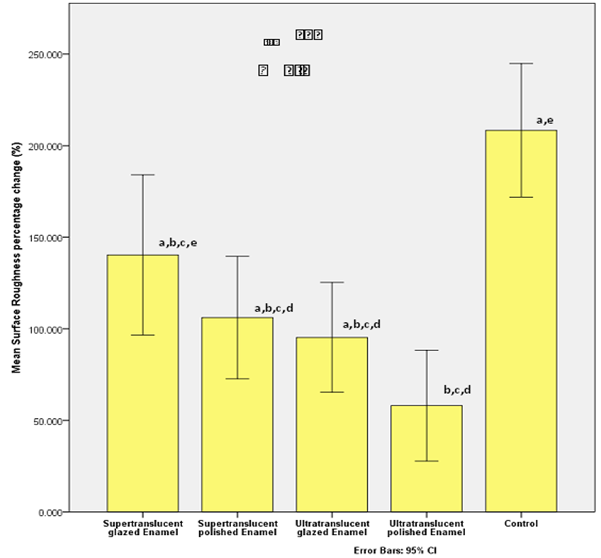
Graph 6: Surface roughness percentage of change of the enamel antagonists after wear test. Different letters indicate pair-wise significance using Games-Howell method.
Qualitative analysis
Surface topography of zirconia and enamel specimens was analyzed using 3D laser microscope to provide 2D and 3D pictures.
Surface topography of Zirconia specimens
Before the wear simulation, the 2D images of the glazed STML (figure 1) and UTML (figure 2) zirconia demonstrated a well finished smooth surface. While the polished STML (figure 3) and UTML (figure 4) zirconia exhibited some surface asperities indicating the markings of the CAD/CAM milling bur.
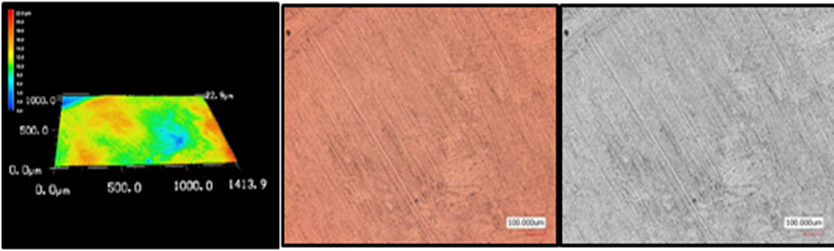
Figure 1: Glazed STML: (a) 3D, (b): Laser+ optical, (C): Laser.
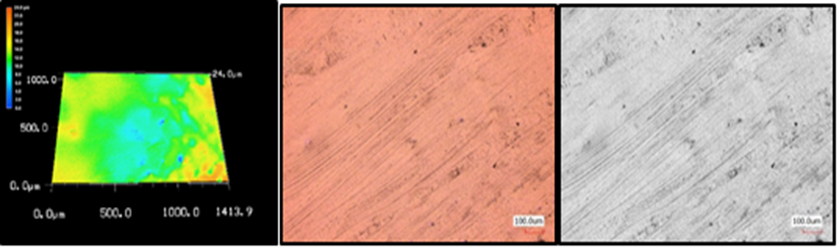
Figure 2: Glazed UTML: (a) 3D, (b): Laser+ optical, (C): Laser.
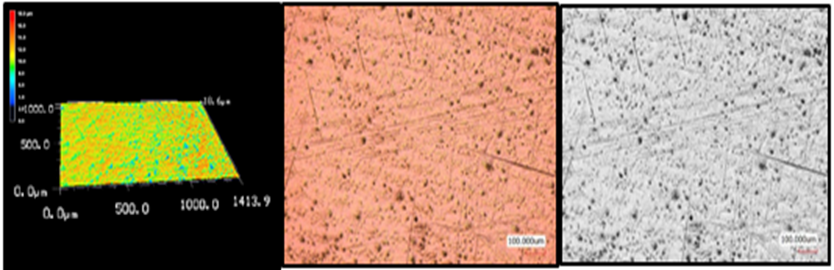
Figure 3: Polished STML: (a) 3D, (b): Laser+ optical, (C): Laser.
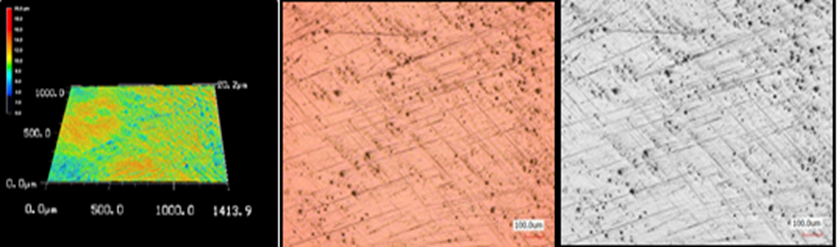
Figure 4: Polished UTML: (a) 3D, (b): Laser+ optical, (C): Laser.
After the wear test, polished UTML zirconia discs showed narrow, shallow and smooth wear scratches (figure.5). While glazed UTML zirconia discs showed chipping of parts of the glaze layer along the wear path of the antagonist enamel cusp (figure 6). Polished STML zirconia discs revealed deeper scratches than that observed with the previous polished UTML discs, along with some pitting in the surface in the sliding direction (figure 7). While glazed STML zirconia discs showed a rough abraded surface in consistent with the worn-out glaze layer in the center of the wear facet revealing the underlying zirconia surface (figure 8).
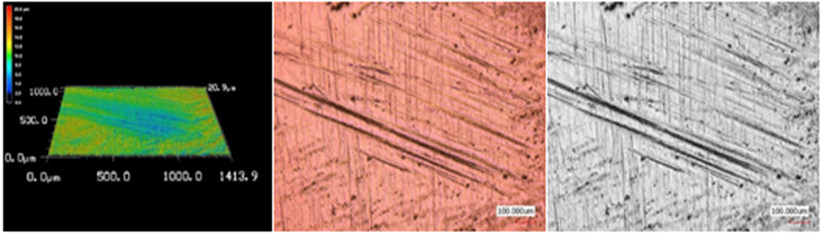
Figure 5: Polished UTML: (a) 3D, (b): Laser+ optical, (C): Laser.
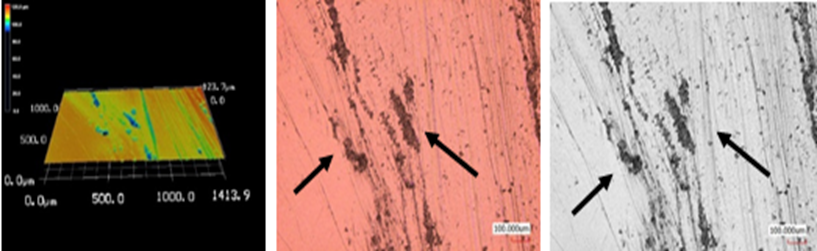
Figure 6: Glazed UTML: (a) 3D, (b): Laser+ optical, (C): Laser.
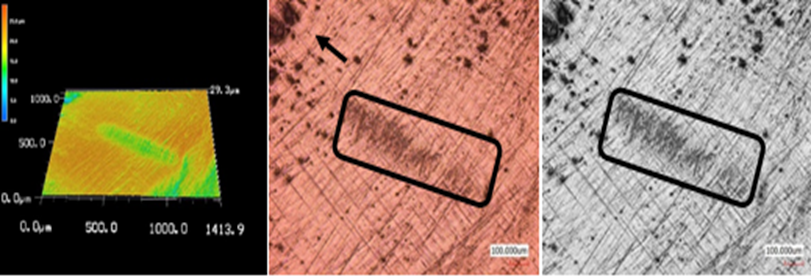
Figure 7: Polished STML : (a) 3D, (b): Laser+ optical, (C): Laser.
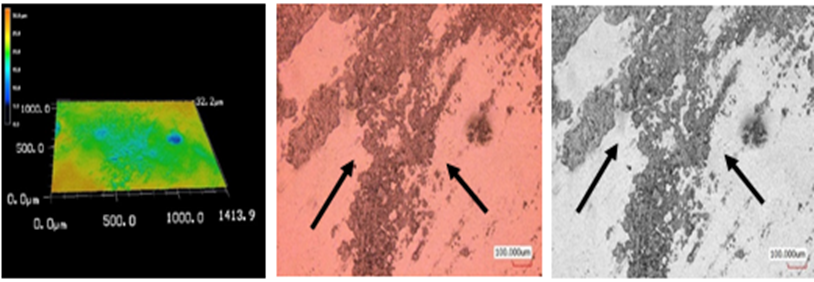
Figure 8: Glazed STML: (a) 3D, (b): Laser+ optical, (C): Laser.
Surface topography of Enamel Antagonists
The observed cusps of the enamel antagonists under the 3D laser microscope revealed a smooth surface before the wear test devoid from any wear facets or cracks or any scratches before the wear simulation. (figure 9). After the wear test, the enamel antagonists of polished UTML zirconia showed a relatively smooth surface with very shallow and superficial wear traces. (Figure10) While the enamel antagonists of the glazed UTML zirconia showed a rougher surface with slightly deeper wear striations. (figure 11).
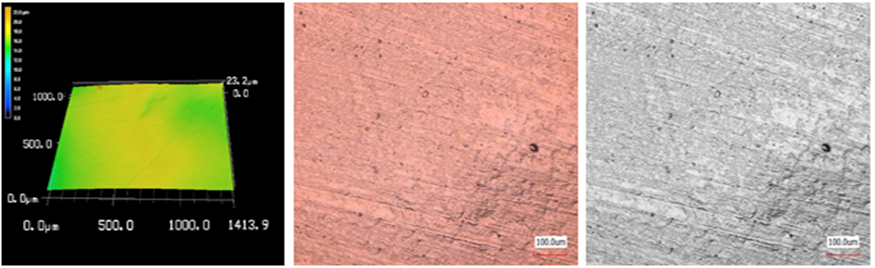
Figure 9: Enamel antagonist under 3D laser microscope before the wear test; (a) 3D, (b): Laser+ optical, (C): Laser.
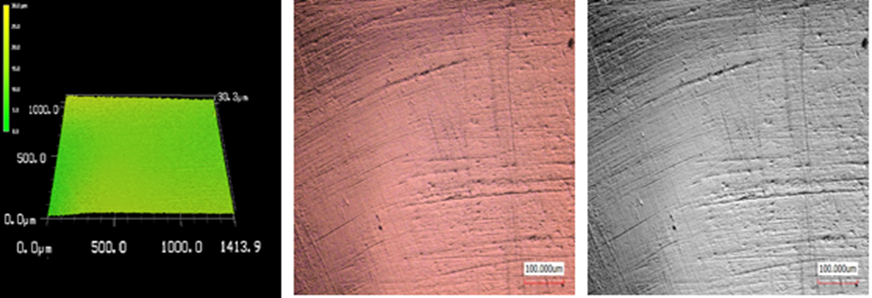
Figure 10: Enamel opposing polished UTML under 3D laser microscope after the wear test; (a) 3D, (b): Laser+ optical, (C): Laser.
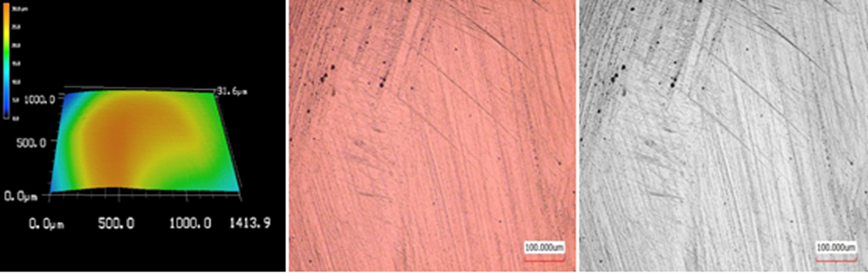
Figure 11: Enamel opposing glazed UTML under 3D laser microscope after the wear test; (a) 3D, (b): Laser+ optical, (C): Laser.
The enamel opposing polished STML zirconia demonstrated a rough surface with some pitting in the enamel surface along with some sliding wear traces. (figure 12 & 13) The enamel opposing glazed STML zirconia showed some surface defects such as a circular crater-like fracture, and rough ploughed surface in the center of the wear facet. (figure 14) Others showed deeper sliding marks in the direction of the wear path. (figure 15). Upon examination of the control group, the enamel antagonists exhibited the steepest sliding grooves in the wear facets. (figure16) One of the teeth in the control group showed micro crack under the microscope. (figure 17).
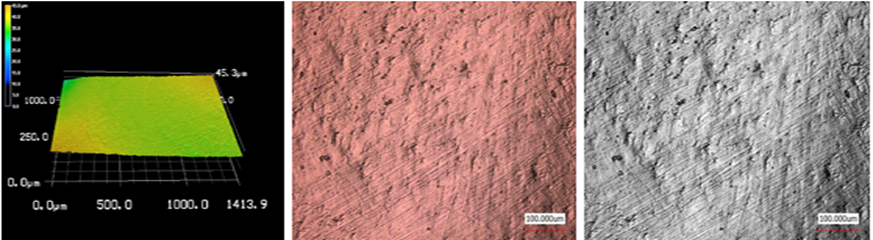
Figure 12: Enamel opposing polished STML under 3D laser microscope after the wear test; (a) 3D, (b): Laser+ optical, (C): Laser.
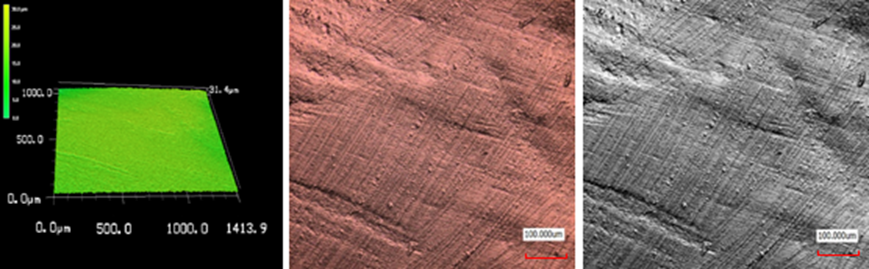
Figure 13: Enamel opposing polished STML under 3D laser microscope after the wear test; (a) 3D, (b): Laser+ optical, (C): Laser.
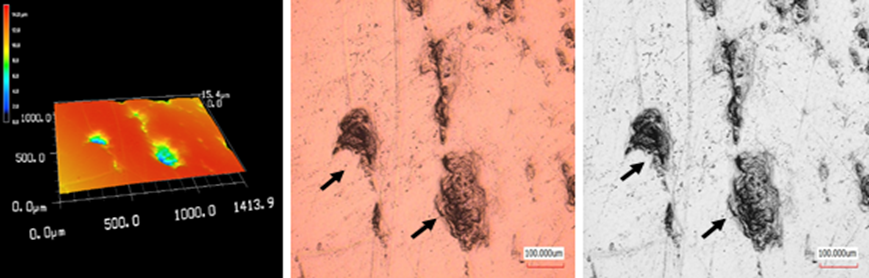
Figure 14: Enamel opposing glazed STML under 3D laser microscope after the wear test; (a) 3D, (b): Laser+ optical, (C): Laser.
Figure 15: Enamel opposing glazed STML under 3D laser microscope after the wear test; (a) 3D, (b): Laser+ optical, (C): Laser.
Figure 16: Enamel antagonists of control group under 3D laser microscope after the wear test; (a) 3D, (b): Laser+ optical, (C): Laser.
Figure 17: Enamel antagonists of control group under 3D laser microscope after the wear test; (a) 3D, (b): Laser+ optical, (C): Laser.
Discussion
The current study investigated the enamel wear behavior and surface roughness opposing to two new translucent zirconia; KATANA STML and KATANA UTML. Their first introduction to the dental market was in 2015, this translucent multi-layered monolithic zirconia has drawn enormous attention of researchers. Increasing the percentage of the yttrium oxide to 5mol% led to a change in the phase composition in which up to 53% cubic zirconia along with tetragonal zirconia could be observed in the crystalline microstructure [51] A tremendous increase in the translucency was achieved owing to the isotropic crystal structure of the cubic phase that resulted in better light transmission. On the other hand, this high amount of cubic zirconia resulted in a decrease in mechanical properties, especially in terms of strength and fracture toughness [52]. Yet, their abrasiveness to the antagonist enamel is still a clinical concern. Clinical studies that investigate enamel wear are time-consuming, and expensive. Furthermore, a lot of factors may influence the results due to the huge variations among the participants; gender and age, masticatory pattern, chewing force, occlusal contact, and parafunctional habits [37]. Since each of these variables is difficult to control in clinical situation. Thus, in-vitro studies have been advocated to study the wear process. However, these in-vitro wear tests show considerable variability, but they allow a comparative evaluation and ranking of newly introduced materials under standardized conditions. They also clarify if these new materials are fundamentally suitable for clinical application or not. Furthermore, they are also essential to provide initial evidence before carrying out clinical studies [53].
There were huge variations in literature regarding the wear simulation device as well as the wear test parameters. Different designs of wear simulation testing devices existed e.g. pin-on-block, pin-on-disc, three-body wear, tooth-brush simulation [19]. In the current study, a modification was done to the tooth brushing machine for wear simulation. The machine used in this study provided forward and backward sliding movements which simulates the action during mastication of mandibular teeth onto the maxillary teeth and this machine was similar to that described by Degee and Pallav (1994). Wear parameters varied in the amount of loading forces, sliding distances, and lubrication (e.g.; distilled water or artificial saliva). In previous studies, forces ranging from 0.4 to 75 N and the number of cycles ranging from 10,000 to 1,200,000 cycles were applied. [54] In this study, testing conditions were chosen to be close to the clinical situation. A total of 120,000 cycle was applied equivalent to 6 months of clinical chewing cycle [55]. Vertical load of 49N equivalent to 5 kg was applied. This is considered as average value for physiological masticatory forces in the teeth of non-bruxism patients [56-58]. Artificial saliva was used to simulate the natural condition. The continuous flow of the lubricant ensured washing away any debris produced from the wear process [18, 59]. Regarding the antagonists, there is no agreement in the literature as to which material should be used in wear simulation tests. Some of the wear simulation methods use either steatite balls made of magnesium silicate or magnesium oxide, or natural enamel as an antagonist. The enamel antagonist could be prepared by different ways. It is either standardized into a flat or spherical shape and then polished, or the enamel cusps are only cut out of selected teeth and cleaned without further treatment [60]. In this study, non-standardized enamel antagonists were used to mimic the clinical conditions. Kunzelmann et al (2001) [61] compared non-standardized versus standardized enamel cusps in their investigation. They stated that standardized enamel changed the wear properties of the antagonist compared to non-standardized enamel cusps. Furthermore, test results that involved standardized cusps were inconsistent and sometimes contradictory. This is in agreement with Krejci et al (1999) [55] who found that standardizing enamel cusps produce inconsistent results when compared with the non-standardized enamel cusps in wear simulation test.
Natural enamel was also used as the control group as the it is the best reference material to compare the results of the wear simulation test to [53]. This is in agreement with Lambrechts et al (2006) [62] who stated that enamel versus enamel as the control group should be included while investigating the wear rates of different materials as this allows laboratory measurement of natural tooth wear. From the given results of the current study, UTML zirconia yielded significantly less enamel antagonist wear than the STML zirconia and the natural enamel respectively. This could be attributed to the fact that the UTML zirconia has lower mechanical properties than that of the STML zirconia. As the UTML has flexural strength equal to 557 MPa and fracture toughness ranging from 2.3 to 2.7 MPam1/2, while STML has flexural strength equals to 748MPa, and fracture toughness ranging from 2.5 to 3.5 MPam1/2 [63] Metzler et al [64] suggested that the nature of the underlying ceramic is considered the ultimate factor influencing the wear rate. The current results showed that the natural enamel control group caused the highest wear to the opposing antagonist teeth. This could be attributed to that the chipped hydroxyapatite particle acted as an abrasive medium causing three body wear cycle. This is in agreement with Zheng et al. [65] who reported that the delamination of the enamel resulted in wear particles that acted as a wear medium. This also coincides with Sripetchdanond et al. [38] who found that the natural enamel caused significantly more wear to the antagonist than the monolithic zirconia.
While the trend with higher antagonist wear of the glazed UTML and STML more than that caused by the polished UTML could be explained by the inferior mechanical properties of the glaze layer. During the wear process, the glaze layer is worn-out exposing the glassy material and increasing the surface roughness. This provokes the wear rate especially at the beginning of the process due to the brittle nature and insufficient toughness of the glaze layer which is mainly silica and quartz. The chipping of the superficial glaze layer exposes the rough sharp glass particles. These particles behave as an abrasive medium and roughen the opposing enamel starting a cycle of abrasive wear. This is in agreement with Janyavula et al.,[17] who reported that the glazed anatomically contoured zirconia exhibited more antagonist wear than the polished anatomically contoured zirconia. They explained that the worn-out particles from the glaze may act as a third body abrasive material. Also, Park et al., [39] reported more antagonist wear with the glazed than the polished monolithic zirconia. They attributed this to the disappearance of the thin glaze layer during mastication exposing the rough zirconia substructure. This observation is also consistent with Sabrah et al., [33] who stated that although the glazed zirconia offered a primary smooth surface, yet it significantly led to more hydroxyapatite antagonist wear than the polished zirconia.
The results also showed that polishing the zirconia yielded less antagonist wear than the glazed zirconia. This could be due to the new CAD/CAM technology that press nano grain zirconia particles into a well packed dense microstructure with no voids. This ensures a smooth surface finish after polishing procedures without an additional interface. This ensures a smooth surface throughout the wear process resulting in limited wear to the antagonist enamel. As the Polished UTML exhibited the least antagonist wear. This coincides with Kwon et al. [8] found that the polished ultra-translucent zirconia caused lower antagonist wear than the natural enamel. The use of the enamel opposing enamel as a reference allowed a meaningful estimation of the enamel wear behavior and the wear performance of the UTML and STML zirconia. The results showed that the UTML and STML antagonist wear was lower than that of the enamel opposing enamel. This seems to be promising. There are two options for the surface-roughness measurement; a contact method and a non-contact optical method. The contact method uses an instrument to record the vertical movements of a stylus moved across the surface to be assessed. While the non-contact optical methods are based on microscopy imaging and quicker than the above-mentioned contact method. In this study, a 3D laser microscope was used as a non-contact optical method to measure the surface roughness. The advantages of 3D laser microscopy are the ability to measure the surface roughness of a smaller area than contact measurement tools; shorter measurement time; immediate observation of surface image, and the ability to obtain high resolution, fully-focused images better than those of SEMs [66]. The only disadvantage is a limitation in the measurement of the target area. The resolution of the measuring area of the laser microscope appeared however adequately high enough to assess the surface roughness of the translucent zirconia investigated.
There was a significant increase in the mean surface roughness of all the tested zirconia specimens and enamel antagonists after the wear simulation. As the surface roughness measurement depends on peaks and valleys, all the surfaces of the tested material exhibit deeper wear tracks and higher amount of material loss after wear simulation, thus was expected to show higher Ra value. However, the absolute surface roughness values could not be compared with other studies as these values differ for each material due to many variables. For example, the way of cutting the specimens, the finishing and polishing procedures, and the method used for the surface roughness measurements influence the initial surface roughness. Moreover, different testing procedures, including number of cycles, different antagonist materials, and different forces used also have an effect. This is in agreement with Heintze et al (2010) [67] who mentioned that it is hard to compare the surface roughness values to other studies due to many factors that lead to great variability in the results. In the current study, a comparison on the basis of mean percentage of change in surface roughness was done between the different studied groups. For the zirconia specimens, there was no statistical difference between the groups. As the STML zirconia discs were as smooth as that of the UTML zirconia with no significant difference before and after the wear simulation. Unfortunately, no studies were found in literature comparing the amount of change in surface roughness between the two materials used in the present study.
Regarding the enamel antagonists, there was a significant difference between the enamel antagonists of the tested groups. The surface roughness percentage of change of the natural enamel of the control group was significantly higher (208.379 ± 63.170%) than that of the enamel opposing UTML and enamel opposing STML. The surface roughness of the enamel opposing enamel was almost doubled after wear simulation. It could be explained by the enamel loss at the beginning of the wear process, followed by an increase in the surface roughness of the antagonist enamel. High surface roughness will increase the friction at the interface and have a higher abrasive action on the antagonist wear. The least surface roughness percentage of change was with that of the enamel opposing polished UTML (58.028 ± 63.179%), followed by enamel opposing glazed UTML (95.296 ± 32.457%), then enamel opposing polished STML (106.128±36.134%), after that was the enamel opposing the glazed STML (140.298 ± 47.264%). In the spot of what was previously mentioned is in agreement with the results for weight loss percentages previously stated in our study. The same explanation for the percentage of weight loss apply for variation in surface roughness. The glazed zirconia showed increased antagonist wear. During the wear process, this is due to the weaker glaze layer with poorer mechanical properties. With the increase in brittleness, microfracture and micro-cutting of sharp glass particles increase yielding a rougher surface and causing more antagonist wear. Elmaria et al. [18] reported a significant correlation between the surface roughness and the enamel wear. Our results showed that the enamel wear rate and surface roughness opposing the UTML and STML zirconia, regardless the surface finishing procedure, was significantly different. Therefore, the null hypotheses were rejected.
Summary
The current study investigated the enamel wear behavior and surface roughness opposing to two new translucent zirconia; KATANA STML and KATANA UTML with two surface finishing procedures (glazed and polished). Since they were firstly introduced into the dental market in 2015, this translucent multi-layered monolithic zirconia has drawn great attention of researchers. Few studies were done on this new category of materials to confirm its performance. Two groups were tested according to the material to be used; Group A: super translucent zirconia (Katana STML), Group B: ultra-translucent zirconia (Katana UTML). Each group was divided into 2 sub-groups; glazed and polished. Each sub-group consisted of 7 zirconia specimens and 7 enamel antagonists. A third group of natural enamel was used as a control group. Zirconia specimens will be cut in the form of discs of diameter = 12mm, and thickness = 5mm. Concerning the enamel antagonists; buccal cusps were isolated from intact human premolars. A modification of tooth brushing machine was used for the wear test. It simulates the jaw movement during chewing by performing horizontal movements with the application of a vertical load. The zirconia specimens and the enamel antagonists were subjected to 120,000 strokes with vertical load 49N. The amount of wear was determined on the basis of weight loss. The enamel antagonists were weighed before and after the test by analytical digital balance. The percentage of wear was determined from the following equation: Wear (percent weight loss) = ∆W x 100/ W1. Concerning the surface roughness; Qualitative and Quantitative analysis of the specimens and their antagonists was carried out before and after loading using 3D laser scanning microscope. The results showed that the polished UTML and STML zirconia caused significantly less antagonist wear than the glazed UTML and STML zirconia. While the natural enamel showed the highest antagonist wear. There was a significant increase in the surface roughness of the zirconia specimens and the enamel antagonists after the wear test. The increase in the surface roughness of the antagonist enamel is corresponding to the amount of antagonist wear.
Conclusions
Within the limitation of this study
- Polished UTML and STML zirconia is more wear friendly to the antagonist enamel. They yielded significantly less antagonist wear than the natural enamel.
- Glazed UTML and STML zirconia showed less antagonist wear compared to the natural enamel.
- The increase in the surface roughness of the antagonist enamel is corresponding to the amount of antagonist wear.
- The natural enamel showed the highest antagonist wear rate as well as the highest percentage of change of surface roughness.
Recommendations
- Polished Ultra-Translucent zirconia can be used as an alternative to glass ceramics for single crowns, and veneers.
- For conclusive evidence of the acceptability of this new fully stabilized translucent zirconia, controlled clinical trials which measure opposing enamel wear must be conducted.
References
- Kelly J, Benetti P. (2011). Ceramic materials in dentistry: historical evolution and current practice. Australian Dental Journal, 56(s1):84-96.
Publisher | Google Scholor - Christel P, Meunier A, Heller M, Torre JP, Peille CN. (1989). Mechanical properties and short-term in vivo evaluation of yttrium-oxide-partially-stabilized zirconia. Journal of Biomedical Materials Research, 23(1):45-61.
Publisher | Google Scholor - Miyazaki T, Nakamura T, Matsumura H, Ban S, Kobayashi T. (2013). Current status of zirconia restoration. Journal of prosthodontic research, 57(4):236-261.
Publisher | Google Scholor - Manicone PF, Rossi Iommetti P, Raffaelli L. (2007). An overview of zirconia ceramics: Basic properties and clinical applications. Journal of Dentistry, 35(11):819-826.
Publisher | Google Scholor - Tan JP, Sederstrom D, Polansky JR, McLaren EA, White SN. (2012). The use of slow heating and slow cooling regimens to strengthen porcelain fused to zirconia. The Journal of Prosthetic Dentistry, 107(3):163-169.
Publisher | Google Scholor - Fischer J, Stawarczyk B, Hämmerle CHF. (2008). Flexural strength of veneering ceramics for zirconia. Journal of Dentistry, 36(5):316-321.
Publisher | Google Scholor - Harada K, Raigrodski AJ, Chung K-H, Flinn BD, Dogan S, Mancl LA. (2016). A comparative evaluation of the translucency of zirconias and lithium disilicate for monolithic restorations. The Journal of Prosthetic Dentistry, 116(2):257-263.
Publisher | Google Scholor - Kwon SJ, Lawson NC, McLaren EE, Nejat AH, Burgess JO. (2018). Comparison of the mechanical properties of translucent zirconia and lithium disilicate. J Prosthet Dent, 120(1):132-137.
Publisher | Google Scholor - Sulaiman TA, Abdulmajeed AA, Donovan TE, Ritter AV, Vallittu PK, Närhi TO, et al. (2015). Optical properties and light irradiance of monolithic zirconia at variable thicknesses. Dental Materials, 31(10):1180-1187.
Publisher | Google Scholor - Baldissara P, Wandscher VF, Marchionatti AME, Parisi C, Monaco C, Ciocca L. (2018). Translucency of IPS e.max and cubic zirconia monolithic crowns. The Journal of Prosthetic Dentistry, 120(2):269-275.
Publisher | Google Scholor - Jang GW, Kim HS, Choe HC, Son MK. (2011). Fracture Strength and Mechanism of Dental Ceramic Crown with Zirconia Thickness. Procedia Engineering, 10:1556-1560.
Publisher | Google Scholor - Yip KH-K, Smales RJ, Kaidonis JA. (2004). Differential wear of teeth and restorative materials: Clinical implications. International Journal of Prosthodontics, 17(3).
Publisher | Google Scholor - D'Arcangelo C, Vanini L, Rondoni GD, De Angelis F. (2016). Wear properties of dental ceramics and porcelains compared with human enamel. J Prosthet Dent, 115(3):350-355.
Publisher | Google Scholor - Mundhe K, Jain V, Pruthi G, Shah N. (2015). Clinical study to evaluate the wear of natural enamel antagonist to zirconia and metal ceramic crowns. J Prosthet Dent, 114(3):358-363.
Publisher | Google Scholor - Oh W-s, DeLong R, Anusavice KJ. (2002). Factors affecting enamel and ceramic wear: A literature review. The Journal of Prosthetic Dentistry, 87(4):451-459.
Publisher | Google Scholor - Preis V, Behr M, Kolbeck C, Hahnel S, Handel G, Rosentritt M. (2011). Wear performance of substructure ceramics and veneering porcelains. Dental Materials, 27(8):796-804.
Publisher | Google Scholor - Janyavula S, Lawson N, Cakir D, Beck P, Ramp LC, Burgess JO. (2013). The wear of polished and glazed zirconia against enamel. The Journal of Prosthetic Dentistry, 109(1):22-29.
Publisher | Google Scholor - Elmaria A, Goldstein G, Vijayaraghavan T, Legeros RZ, Hittelman EL. (2006). An evaluation of wear when enamel is opposed by various ceramic materials and gold. J Prosthet Dent, 96(5):345-353.
Publisher | Google Scholor - Heintze SD, Cavalleri A, Forjanic M, Zellweger G, Rousson V. (2008). Wear of ceramic and antagonist--a systematic evaluation of influencing factors in vitro. Dent Mater, 24(4):433-449.
Publisher | Google Scholor - Ghazal M, Kern M. (2009). The influence of antagonistic surface roughness on the wear of human enamel and nanofilled composite resin artificial teeth. The Journal of Prosthetic Dentistry, 101(5):342-349.
Publisher | Google Scholor - Jung YS, Lee JW, Choi YJ, Ahn JS, Shin SW, Huh JB. (2010). A study on the in-vitro wear of the natural tooth structure by opposing zirconia or dental porcelain. J Adv Prosthodont, 2(3):111-115.
Publisher | Google Scholor - Albashaireh ZSM, Ghazal M, Kern M. (2010). Two-body wear of different ceramic materials opposed to zirconia ceramic. The Journal of Prosthetic Dentistry, 104(2):105-113.
Publisher | Google Scholor - Rosentritt M, Preis V, Behr M, Hahnel S, Handel G, Kolbeck C. (2012). Two-body wear of dental porcelain and substructure oxide ceramics. Clin Oral Investig, 16(3):935-943.
Publisher | Google Scholor - Kim MJ, Oh SH, Kim JH, Ju SW, Seo DG, Jun SH, et al. (2012). Wear evaluation of the human enamel opposing different Y-TZP dental ceramics and other porcelains. J Dent, 40(11):979-988.
Publisher | Google Scholor - Beuer F, Stimmelmayr M, Gueth JF, Edelhoff D, Naumann M. (2012). In vitro performance of full-contour zirconia single crowns. Dent Mater, 28(4):449-456.
Publisher | Google Scholor - Preis V, Behr M, Handel G, Schneider-Feyrer S, Hahnel S, Rosentritt M. (2012). Wear performance of dental ceramics after grinding and polishing treatments. J Mech Behav Biomed Mater, 10:13-22.
Publisher | Google Scholor - Wang L, Liu Y, Si W, Feng H, Tao Y, Ma Z. (2012). Friction and wear behaviors of dental ceramics against natural tooth enamel. Journal of the European Ceramic Society, 32(11):2599-2606.
Publisher | Google Scholor - Mitov G, Heintze SD, Walz S, Woll K, Muecklich F, Pospiech P. (2012). Wear behavior of dental Y-TZP ceramic against natural enamel after different finishing procedures. Dental Materials, 28(8):909-918.
Publisher | Google Scholor - Preis V, Weiser F, Handel G, Rosentritt M. (2013). Wear performance of monolithic dental ceramics with different surface treatments. Quintessence Int, 44(5):393-405.
Publisher | Google Scholor - Mormann WH, Stawarczyk B, Ender A, Sener B, Attin T, Mehl A. (2013). Wear characteristics of current aesthetic dental restorative CAD/CAM materials: two-body wear, gloss retention, roughness and Martens hardness. J Mech Behav Biomed Mater, 20:113-125.
Publisher | Google Scholor - Kontos L, Schille C, Schweizer E, Geis-Gerstorfer J. (2013). Influence of surface treatment on the wear of solid zirconia. Acta odontologica Scandinavica, 71:482-487.
Publisher | Google Scholor - Stawarczyk B, Ozcan M, Schmutz F, Trottmann A, Roos M, Hammerle CH. (2013). Two-body wear of monolithic, veneered and glazed zirconia and their corresponding enamel antagonists. Acta Odontol Scand, 71(1):102-112.
Publisher | Google Scholor - Sabrah AH, Cook NB, Luangruangrong P, Hara AT, Bottino MC. (2013). Full-contour Y-TZP ceramic surface roughness effect on synthetic hydroxyapatite wear. Dent Mater, 29(6):666-673.
Publisher | Google Scholor - Luangruangrong P, Cook NB, Sabrah AH, Hara AT, Bottino MC. (2014). Influence of full-contour zirconia surface roughness on wear of glass-ceramics. J Prosthodont, 23(3):198-205.
Publisher | Google Scholor - Lawson NC, Janyavula S, Syklawer S, McLaren EA, Burgess JO. (2014). Wear of enamel opposing zirconia and lithium disilicate after adjustment, polishing and glazing. J Dent, 42(12):1586-1591.
Publisher | Google Scholor - Amer R, Kurklu D, Kateeb E, Seghi RR. (2014). Three-body wear potential of dental yttrium-stabilized zirconia ceramic after grinding, polishing, and glazing treatments. J Prosthet Dent, 112(5):1151-1155.
Publisher | Google Scholor - Stober T, Bermejo JL, Rammelsberg P, Schmitter M. (2014). Enamel wear caused by monolithic zirconia crowns after 6 months of clinical use. J Oral Rehabil, 41(4):314-322.
Publisher | Google Scholor - Sripetchdanond J, Leevailoj C. (2014). Wear of human enamel opposing monolithic zirconia, glass ceramic, and composite resin: an in vitro study. J Prosthet Dent, 112(5):1141-1150.
Publisher | Google Scholor - Park JH, Park S, Lee K, Yun KD, Lim HP. (2014). Antagonist wear of three CAD/CAM anatomic contour zirconia ceramics. J Prosthet Dent, 111(1):20-29.
Publisher | Google Scholor - Chong BJ, Thangavel AK, Rolton SB, Guazzato M, Klineberg IJ. (2015). Clinical and laboratory surface finishing procedures for zirconia on opposing human enamel wear: A laboratory study. J Mech Behav Biomed Mater, 50:93-103.
Publisher | Google Scholor - Dupriez ND, von Koeckritz AK, Kunzelmann KH. (2015). A comparative study of sliding wear of nonmetallic dental restorative materials with emphasis on micromechanical wear mechanisms. J Biomed Mater Res B Appl Biomater, 103(4):925-934.
Publisher | Google Scholor - Aldegheishem A, Alfaer A, Brezavšček M, Vach K, Eliades G, Att W. (2015). Wear behavior of zirconia substrates against different antagonist materials. Int J Esthet Dent, 10(3):468-485.
Publisher | Google Scholor - Zandparsa R, El Huni RM, Hirayama H, Johnson MI. (2016). Effect of different dental ceramic systems on the wear of human enamel: An in vitro study. J Prosthet Dent, 115(2):230-237.
Publisher | Google Scholor - Nakashima J, Taira Y, Sawase T. (2016). In vitro wear of four ceramic materials and human enamel on enamel antagonist. Eur J Oral Sci, 124(3):295-300.
Publisher | Google Scholor - Lohbauer U, Reich S. (2017). Antagonist wear of monolithic zirconia crowns after 2 years. Clin Oral Investig, 21(4):1165-1172.
Publisher | Google Scholor - Vedana D, Vedana L, Martins EA, Brodersen P, De Souza GM. (2018). Artificial Enamel Wear after Prolonged Chewing Simulation against Monolithic Y-TZP Crowns. Materials Sciences and Applications, 9(4):381-392.
Publisher | Google Scholor - Esquivel-Upshaw JF, Kim MJ, Hsu SM, Abdulhameed N, Jenkins R, Neal D, et al. (2018). Randomized clinical study of wear of enamel antagonists against polished monolithic zirconia crowns. J Dent, 68:19-27.
Publisher | Google Scholor - Kaizer MR, Moraes RR, Cava SS, Zhang Y. (2019). The progressive wear and abrasiveness of novel graded glass/zirconia materials relative to their dental ceramic counterparts. Dent Mater, 35(5):763-771.
Publisher | Google Scholor - Yang SW, Kim JE, Shin Y, Shim JS, Kim JH. (2019). Enamel wear and aging of translucent zirconias: In vitro and clinical studies. J Prosthet Dent, 121(3):417-425.
Publisher | Google Scholor - WANG L, GARCIA FCP, DE ARAÚJO PA, FRANCO EB, MONDELLI RFL. (2004). Wear Resistance of Packable Resin Composites after Simulated Toothbrushing Test. Journal of Esthetic and Restorative Dentistry, 16(5):303-314.
Publisher | Google Scholor - Inokoshi M, Shimizu H, Nozaki K, Takagaki T, Yoshihara K, Nagaoka N, et al. (2018). Crystallographic and morphological analysis of sandblasted highly translucent dental zirconia. Dent Mater,34(3):508-518.
Publisher | Google Scholor - Stawarczyk B, Keul C, Eichberger M, Figge D, Edelhoff D, Lumkemann N. (2017). Three generations of zirconia: From veneered to monolithic. Part I. Quintessence Int, 48(5):369-380.
Publisher | Google Scholor - Heintze SD. (2006). How to qualify and validate wear simulation devices and methods. Dent Mater, 22(8):712-734.
Publisher | Google Scholor - Eisenburger M, Shellis R, Addy M. (2003). Comparative study of wear of enamel induced by alternating and simultaneous combinations of abrasion and erosion in vitro. Caries research, 37(6):450-455.
Publisher | Google Scholor - Krejci I, Albert P, Lutz F. (1999). The influence of antagonist standardization on wear. Journal of dental research, 78(2):713-719.
Publisher | Google Scholor - Gibbs CH, Mahan PE, Lundeen HC, Brehnan K, Walsh EK, Sinkewiz SL, et al. (1981). Occlusal forces during chewing—influences of biting strength and food consistency. Journal of Prosthetic Dentistry, 46(5):561-567.
Publisher | Google Scholor - Kunzelmann K-H. (1998). Verschleissanalyse und-quantifizierung von Füllungsmaterialien in vivo und in vitro: Shaker.
Publisher | Google Scholor - Rosentritt M, Behr M, van der Zel JM, Feilzer AJ. (2009). Approach for valuating the influence of laboratory simulation. Dental materials, 25(3):348-352.
Publisher | Google Scholor - Kadokawa A, Suzuki S, Tanaka T. Wear evaluation of porcelain opposing gold, composite resin, and enamel. The Journal of prosthetic dentistry, 96(4):258-265.
Publisher | Google Scholor - Heintze SD. (2010). Predictability of clinical wear by laboratory wear methods for the evaluation of dental restorative materials: University Library Groningen.
Publisher | Google Scholor - Kunzelmann K, Jelen B, Mehl A, Hickel R. (2001). Wear evaluation of MZ100 compared to ceramic CAD/CAM materials. International journal of computerized dentistry, 4(3):171-184.
Publisher | Google Scholor - Lambrechts P, Debels E, Van Landuyt K, Peumans M, Van Meerbeek B. (2006). How to simulate wear? Overview of existing methods. Dent Mater, 22(8):693-701.
Publisher | Google Scholor - Pereira GK, Guilardi LF, Dapieve KS, Kleverlaan CJ, Rippe MP, Valandro LF. (2018). Mechanical reliability, fatigue strength and survival analysis of new polycrystalline translucent zirconia ceramics for monolithic restorations. Journal of the mechanical behavior of biomedical materials, 85:57-65.
Publisher | Google Scholor - Metzler KT, Woody RD, Miller III AW, Miller BH. (1999). In vitro investigation of the wear of human enamel by dental porcelain. The Journal of prosthetic dentistry, 81(3):356-364.
Publisher | Google Scholor - Zheng J, Zeng Y, Wen J, Zheng L, Zhou Z. (2016). Impact wear behavior of human tooth enamel under simulated chewing conditions. J Mech Behav Biomed Mater, 62:119-127.
Publisher | Google Scholor - Uhlmann E, Oberschmidt D, Kunath-Fandrei G, editors. (2003). 3D-analysis of microstructures with confocal laser scanning microscopy. Proc ASPE winter topical meeting–Machines and processes for micro-scale and meso-scale fabrication, metrology and assembly, ASPE, Gainesville.
Publisher | Google Scholor - Heintze S, Forjanic M, Ohmiti K, Rousson V. (2010). Surface deterioration of dental materials after simulated toothbrushing in relation to brushing time and load. Dental Materials, 26(4):306-319.
Publisher | Google Scholor