
Research Article
Assessment of the Effectiveness of Open Defecation Free System on the Incidence of Faecal Contamination on Environment Through Microbial Source Tracking
- Jagdish Kumar 1*
- Deep Shankar Chatterjee 1
- Dushyant Singh 1
- Shifa Chaudhary 1
- Gaurav 1
- Swathi Manchikanti 2
- Sujoy Mojumdar 2
- Nicolas Osbert 2
- Mukul Das 1
1 Shriram Institute for Industrial Research, Delhi, India.
2 Water, Sanitation & Hygiene, UNICEF India, New Delhi, India.
*Corresponding Author: Jagdish Kumar, Shriram Institute for Industrial Research, Delhi, India.
Citation: Kumar J., Deep S. Chatterjee, Singh D, Chaudhary S, Gaurav, et al. (2025). Assessment of the Effectiveness of Open Defecation Free System on the Incidence of Faecal Contamination on Environment Through Microbial Source Tracking. Journal of BioMed Research and Reports, BioRes Scientia Publishers. 7(4):1-14. DOI: 10.59657/2837-4681.brs.25.142
Copyright: © 2025 Jagdish Kumar, this is an open-access article distributed under the terms of the Creative Commons Attribution License, which permits unrestricted use, distribution, and reproduction in any medium, provided the original author and source are credited.
Received: February 20, 2025 | Accepted: March 06, 2025 | Published: March 13, 2025
Abstract
The aim of this study was to assess the effectiveness of open defecation free (ODF) system on the incidence of faecal contamination on environment (water, soil and food mediums). The magnitude of contamination of environmental medium of ODF and non-open defecation free (n-ODF) villages by faecal indicator bacteria (FIB) in three states of India, was investigated. The FIB positive samples were further processed to determine the source of faecal contamination using Bacteroidale molecular markers for human (HuBac). The matrix of relative risk (RR) due to FIB and HuBaC contamination was developed to assess the effectiveness of ODF interventions. When compared to ODF villages, the RR of faecal contamination in n-ODF villages was estimated 11.25 times more likely in groundwater, 2.68 times more likely in household storage drinking water, 2.71 times more likely in piped water supplies, 1.13 times more likely in soil and 1.48 times more likely in food. The RR of faecal contamination traceable to humans was estimated 12.66, 2.48, 2.40, 1.10 and 2.16 times more likely in n-ODF villages as compared to ODF villages in cases of groundwater, household storage drinking water, piped water supplies, soil and food, respectively. The risk assessment matrix designed in present study can be useful towards evaluation of the performance of ODF missions being implemented in many developing countries to achieve sanitation and hygiene objectives in accordance to the target 6.2 of Sustainable Development Goals 2030.
Keywords: open defecation free; faecal indicator bacteria; human bacteroides; contamination sanitation; relative risk
Introduction
The United Nation’s Sustainable Development Goal 6 (Target 6.2) seeks by 2030, the end of open defecation in addition to the achievement of universal, adequate and equitable access to safely managed sanitation by all with special attention in this context towards the need of women and vulnerable section of society [1,2]. The worldwide rate of open defecation has been reduced from 21 percent to 9 percent (0.7 percentage points per year) since the year 2000, but 673 million people were still practicing open defecation in the year 2017, that too were increasingly concentrated in small number of countries [3]. During the year 2020, 580 million people had limited sanitation services; 616 million used unimproved sanitation facilities, and 494 million practiced open defecation [4].
The Swachh Bharat Mission (SBM) in India was launched in the year 2014 to make the country open defecation free (ODF) by ensuring use of household toilets, especially in rural areas [5]. The rural (Gramin) component of the mission SBM-G has demonstrated spectacular achievement in this context, with over 660,000 villages declared themselves as being ODF after achieving full sanitation coverage in their communities. Through the SBM-G, India has significantly accelerated its progress towards SDG 6.2, with a decade to spare [6]. However, there emerged the inquisitiveness whether the awareness mission to eliminate open defecation and creation of ODF communities has resulted in the reduction in faecal contamination in the environment, which was the expected impact for such programme with particular focus on sustaining clean water resources for communities. In order to ascertain the impacts of faecal contamination due to human sources on environmental medium, a study was designed to compare such parameters in water, soil and food samples drawn from ODF and n-ODF villages in three states of India namely Odisha, Bihar and West Bengal from December 2018 to January 2019, when the mission was still active and these states were still having n-ODF villages [7].
The faecal contamination in environment occurs when excreta containing bacterial coliforms, from humans or animals enter the source [8]. Most of the groundwater coliforms come from leaching and percolation of liquids through soils and other materials, originating from sources with solid (human and animal excreta) and liquid wastes. Identifying sources of human exposure to faecal coliforms that increases potential transmission of disease through multiple faecal-oral transmission pathways, can help to mitigate future risks to human health and improve how water, sanitation and hygiene interventions are designed [9]. The faecal coliform group includes all rod-shaped anaerobic and aerobic bacteria that are non-spore forming, gram-negative, lactose- fermenting in 24 hours at 44.5°C. Escherichia coli is one of the dominant members of faecal group [9-12].
As standard detection of faecal indicator bacteria (FIB) (Escherichia coli, faecal coliforms and enterococci) unable to identify and differentiate between the host sources of faecal contamination, more state-of- the-art detection methods are, therefore, needed where open defecation occurs without any demarcation from domestic animal faecal loading. Accordingly, methods which combine microbial and molecular biological techniques are the only modalities to distinguish whether the contamination is a result of human or animal excreta, through microbial source tracking [13-15]. Host-associated genetic markers in water samples have been reported to compare sensitivities and specificities of their detection [16]. Faecal indicators together with occurrence of host-specific molecular markers were enumerated in sewage spiked freshwater, seawater and distilled water samples, thereby reported that human-specific bacterial and viral molecular markers are highly sewage specific [17]. Quantitative real-time polymerase chain reaction (qPCR), has increasingly been applied in addition to FIB enumeration to identify microbial risks emanating from specific fecal sources [16-20]. The groundwater samples analysis for total and faecal coliform count were reported in ODF villages and Multiple Antibiotic Resistance (MAR) index values estimated to unravel the source of contamination human or non- human [21].
Materials and Methods
Selection of Study Population
The selection of the ODF and n-ODF districts (one each per state) was decided, the data of which was made available by the respective State Government and UNICEF, by considering the conditions such as (i) the existing status of the districts in the state (ODF versus n-ODF) and (ii) the approachability of the district to the nearest airport to permit rapid transportation of samples to the laboratory. Further, 10 number of villages were identified in each category of ODF and n-ODF, from pre-selected districts in the state of Odisha, Bihar, and West Bengal (total number of 60 villages), using selection criteria such as villages that (i) have a population of 500 or more persons and (ii) have been declared ODF for at least 6 months; subsequently 4 villages of each classification (ODF and n-ODF) were randomly selected from the shortlist, from each state thereby in totality 24 villages were finalized for study [7,22]. Accordingly, 30 villages of ODF category and 30 villages of n-ODF category meeting the criteria were identified, out of which 12 villages of ODF category and 12 villages of n- ODF category were randomly selected for this study. Further, there are similarities in socio-economic status in terms of National Multidimensional Poverty Index based on indicators like education, income, nutrition, water and sanitation in rural areas of Odisha, Bihar and West Bengal States of India [23], where ODF and non-ODF villages were selected for study. The literacy rate as per census records is 61.8 percent in Bihar; 72.9 percent in Odisha, and 76.3 percent in West Bengal [22].
Details of Study Area
The study areas in Odisha, Bihar and West Bengal, are represented in the (Figure 1a, 1b, 1c, 1d). The landuse in the study areas of Odisha consist of 62 to 75 percent area in ODF villages and 50 to 99 percent area in n-ODF villages under net sown area (agricultural use), whereas 2.2 to 5.7 percent area in ODF villages and upto 10 percent area in n-ODF villages is culturable waste land; the study areas of Bihar consist of 67 to 95 percent area in ODF villages and 80 to 90 percent area in n-ODF villages, is under net sown area (agriculture use), whereas 5.5 to 33 percent area in ODF villages and 9.9 to 20 percent area in n-ODF villages is under non- agricultural Use; in case of West Bengal, ODF villages comes under census town and hence these have no agricultural land, whereas in n-ODF villages, 53 to 87 percent area comes under agricultural use and 13.5 to 38 percent area is under non-agricultural use [22].
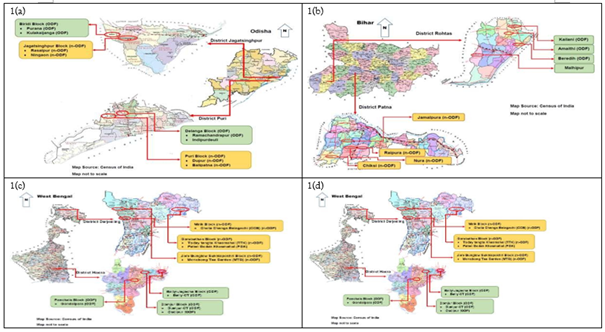
Figure 1: Study areas depicted on map: a) Odisha, b) Bihar, c) West Bengal and d) State wise sample size on India Map.
Sampling Design for Water, Soil, and Food Medium
Sampling design comprised of collection of water, soil and food samples from strategic locations in 24 numbers of villages. Water samples were collected from sources available at the village level such as (i) Groundwater sources (preferably from public handpumps), (ii) Piped water supply (wherever available) and (iii) Household storage drinking water. The soil sampling locations were selected in the vicinity of community toilets. In the event of non-existence of community toilet in any village, the soil was sampled from open field near to the current or earlier open defecation areas, depending on whether it is an ODF or n-ODF village. The sampling of food was done by following the scheme such as collection of cooked food from village dhabas (local eatery) or from mid-day meal (MDM) of school or from Anganwadi (rural child care centre in India), whatever is available at the location 7. Sampling was carried out during non-monsoon months. No rainfall was observed during sampling period. Ambient temperature during sampling period varied between minimum 7°C to maximum 26°C. The groundwater was sampled from shallow hand-pumps. The water level in study districts exist less than 15 metres below ground level [24]. Soil samples were collected from the depth of 15 cm below surface [7]. In totality, 129 number of water sources (64 in ODF and 65 in n-ODF villages) from Odisha; 145 number of water sources (76 in ODF and 69 in n-ODF villages) from Bihar and 122 number of water sources (65 in ODF and 57 in n-ODF villages) from West Bengal were sampled (Table 1); 64 numbers of soil samples (32 each from ODF and n-ODF villages) were collected each from Odisha, Bihar and West Bengal (Table 2); and 24 number of food samples (10 in ODF and 14 in n-ODF villages) from Odisha, 11 number of food samples (5 in ODF and 6 in n-ODF villages) from Bihar and 26 number of food samples (9 from ODF and 17 from n-ODF villages) from West Bengal were collected (Table 3).
Table 1: Contamination status of Faecal Indicator Bacteria (FIB) in water samples collected from Odisha, Bihar and West Bengal.
| State wise Category of Villages Faecal coliform | (MPN/100ml) Escherichia coli | (cfu/100ml) Enterococci | (cfu/100 ml) | ||
| Odisha | ODF Villages (n = 64) | Max. | 345 | 45 | 39 |
| Min. | < 2 | < 1 | < 1 | ||
| Mean ± SD | 30 ± 79 | 5 ± 12 | 4 ± 9 | ||
| 90th Percentile | 175 | 34 | 23 | ||
| 70th Percentile | < 2 | < 1 | < 1 | ||
| n-ODF Villages (n = 65) | Max. | 345 | 45 | 38 | |
| Min. | < 2 | < 1 | < 1 | ||
| Mean ± SD | 78 ± 105 | 13 ± 16 | 6 ± 10 | ||
| 90th Percentile | 255 | 38 | 23 | ||
| 70th Percentile | 136 | 26 | < 1 | ||
| 50th Percentile | < 2 | < 1 | < 1 | ||
| Bihar | ODF Villages (n = 76) | Max. | 109 | 55 | 32 |
| Min. | < 2 | < 1 | < 1 | ||
| Mean ± SD | 6 ± 22 | 2 ± 9 | 1 ± 5 | ||
| 90th Percentile | < 2 | < 1 | < 1 | ||
| n-ODF Villages (n = 69) | Max. | 348 | 58 | 39 | |
| Min. | < 2 | < 1 | < 1 | ||
| Mean ± SD | 103 ± 110 | 24 ± 21 | 11 ± 14 | ||
| 90th Percentile | 278 | 51 | 32 | ||
| 70th Percentile | 141 | 41 | 22 | ||
| 50th Percentile | 79 | 28 | < 1 | ||
| West Bengal | ODF Villages (n = 65) | Max. | 221 | 40 | < 1 |
| Min. | < 2 | < 1 | < 1 | ||
| Mean ± SD | 13 ± 46 | 2 ± 8 | <1> | ||
| 90th Percentile | < 2 | < 1 | < 1 | ||
| n-ODF Villages (n = 57) | Max. | 348 | 59 | 37 | |
| Min. | < 2 | < 1 | < 1 | ||
| Mean ± SD | 117 ± 122 | 20 ± 19 | 10 ± 12 | ||
| 90th Percentile | 345 | 46 | 28 | ||
| 70th Percentile | 175 | 34 | 21 | ||
| 50th Percentile | 109 | 22 | < 1 | ||
Table 2: Contamination status of Faecal Indicator Bacteria (FIB) in soil samples collected from Odisha, Bihar and West Bengal.
| State wiseCategory of Villages | Faecal coliform (MPN/ g) | Escherichia coli (cfu/ g) | Enterococci (cfu/ g) | ||
| Odisha | ODF Villages (n = 32) | Max. | 9.4x10³ | 210 | 45 |
| Min. | < 0.18 | < 1 | < 1 | ||
| Mean ± SD | 3.7x10³ ± 2.6x10³ | 56 ± 38 | 6 ± 13 | ||
| 90th Percentile | 8.4x10³ | 100 | 34 | ||
| 70th Percentile | 4.6x10³ | 64 | < 1 | ||
| 50th Percentile | 3.5x10³ | 56 | < 1 | ||
| n-ODF Villages (n = 32) | Max. | 9.4x10³ | 120 | 36 | |
| Min. | < 0.18 | < 1 | < 1 | ||
| Mean ± SD | 3.3x10³ ± 3.3x10³ | 38 ± 30 | 6 ± 11 | ||
| 90th Percentile | 9.4x10³ | 67 | 24 | ||
| 70th Percentile | 5.1x10³ | 46 | <1> | ||
| 50th Percentile | 2.0x10³ | 40 | <1> | ||
| Bihar | ODF Villages (n = 32) | Max. | 9.4x10³ | 59 | 41 |
| Min. | < 0.18 | < 1 | < 1 | ||
| Mean ± SD | 2.9x10³ ± 2.9x10³ | 26 ± 23 | 8 ± 14 | ||
| 90th Percentile | 7.6x10³ | 55 | 33 | ||
| 70th Percentile | 4.6x10³ | 44 | 2 | ||
| 50th Percentile | 2.5x10³ | 36 | < 1 | ||
| Bihar | n-ODF Villages (n = 32) | Max. | 7.0x10⁴ | 61 | 41 |
| Min. | < 0.18 | < 1 | < 1 | ||
| Mean ± SD | 5.0x10³ ± 1.2x10⁵ | 31 ± 22 | 10 ± 15 | ||
| 90th Percentile | 7.0x10³ | 55 | 33 | ||
| 70th Percentile | 4.6x10³ | 44 | 24 | ||
| 50th Percentile | 3.0x10³ | 39 | < 1 | ||
| West Bengal | ODF Villages (n = 32) | Max. | 9.4x10³ | 58 | 22 |
| Min. | < 0.18 | < 1 | < 1 | ||
| Mean ± SD | 2.2x10³ ± 2.9x10³ | 17 ± 20 | 1 ± 4 | ||
| 90th Percentile | 7.6x10³ | 47 | < 1 | ||
| 70th Percentile | 2.7x10³ | 32 | < 1 | ||
| 50th Percentile | <0> | <1> | < 1 | ||
| West Bengal | n-ODF Villages (n = 32) | Max. | 9.4x10³ | 59 | 42 |
| Min. | < 0.18 | < 1 | < 1 | ||
| Mean ± SD | 3.2x10³ ± 3.0x10³ | 30 ± 23 | 8 ± 15 | ||
| 90th Percentile | 7.6x10³ | 57 | 37 | ||
| 70th Percentile | 4.6x10³ | 47 | < 1 | ||
| 50th Percentile | 2.6x10³ | 39 | < 1 | ||
Table 3: Contamination status of Faecal Indicator Bacteria (FIB) in food samples collected from Odisha, Bihar and West Bengal
| State wise Category of Villages | Faecal coliform (MPN/ g) | Escherichia coli (cfu/ g) | Enterococci (cfu/ g) | ||
| Odisha | ODF Villages (n = 10) | Max. | 900 | 38 | 25 |
| Min. | 130 | 15 | < 1 | ||
| Mean ± SD | 351 ± 282 | 27 ± 7 | 6 ± 10 | ||
| 90th Percentile | 900 | 38 | 25 | ||
| 70th Percentile | 327 | 31 | 11 | ||
| 50th Percentile | 241 | 28 | < 1 | ||
| n-ODF Villages (n = 14) | Max. | 348 | 38 | 18 | |
| Min. | < 0.18 | < 1 | < 1 | ||
| Mean ± SD | 215 ± 111 | 23 ± 11 | 6 ± 7 | ||
| 90th Percentile | 348 | 38 | 17 | ||
| 70th Percentile | 278 | 31 | 13 | ||
| 50th Percentile | 231 | 25 | < 1 | ||
| Bihar | ODF Villages (n = 5) | Max. | < 0.18 | < 1 | < 1 |
| Min. | < 0.18 | < 1 | < 1 | ||
| Mean ± SD | <0> | <1> | <1> | ||
| n-ODF Villages (n = 6) | Max. | 278 | 38 | < 1 | |
| Min. | < 0.18 | < 1 | < 1 | ||
| Mean ± SD | 122 ± 98 | 19 ± 14 | <1> | ||
| 90th Percentile | 273 | 38 | < 1 | ||
| 70th Percentile | 169 | 30 | < 1 | ||
| 50th Percentile | 141 | 23 | < 1 | ||
| West Bengal | ODF Villages (n = 9) | Max. | < 0.18 | < 1 | < 1 |
| Min. | < 0.18 | < 1 | < 1 | ||
| Mean ± SD | <0> | <1> | <1> | ||
| n-ODF Villages (n = 17) | Max. | 240 | 34 | 21 | |
| Min. | < 0.18 | < 1 | < 1 | ||
| Mean ± SD | 82 ± 94 | 11 ± 13 | 1 ± 5 | ||
| 90th Percentile | 240 | 32 | 4 | ||
| 70th Percentile | 141 | 20 | < 1 | ||
| 50th Percentile | < 0.18 | < 1 | < 1 | ||
Sampling was carried out as per the guidelines of standard protocols and methods [25,26]. The samples duly preserved under controlled temperature conditions, were transported to laboratory within the permissible time limits. The sampling was done in bottles sterilized through gamma irradiation [27]. Sampling chain-of- custody consisted of information pertaining to identification of site such as habitation/ village/ gram panchyat along with nearest caretaker/ household/ landmark along with GPS geocodes and general site conditions [28-30].
Laboratory Investigations
Water samples were homogenized by shaking about 25 times [26]. Food and soil sample were blended in sterile blender for two minutes by using 225 ml diluting fluid per 25 grams of sample by maintaining 1:10 dilution [31]. The homogenized samples were analyzed for faecal coliforms by the multiple tube dilution method incorporated by presumptive and confirmatory steps. The confirmatory test was carried out with more selective culture medium (brilliant green bile lactose broth), which was inoculated with material taken from the positive tubes of presumptive test. Accordingly, results were reported as Most Probable Number (MPN) for faecal coliform/ 100 ml in case of water and MPN faecal coliform / g in cases of soil and food [26]. The Escherichia coli in water samples were determined by Membrane Filter Technique. A 100 ml of water sample was filtered through 0.45 µm filter paper, which was then placed on selective agar plate to carry out further identification [32]. The enumeration of Escherichia coli per gm in soil and food samples were performed by using serial dilution technique with spread plate method followed by further confirmation [31]. The Enterococci in water samples was determined by Membrane Filter Technique. A 100 ml water sample was passed through 0.45micron filter paper, which was then placed on selective agar plate followed by further confirmation [33].
The enumeration of Enterococci per gm in soil and food sample was performed by using serial dilution technique with spread plate method followed by further confirmation [33]. The minimum detection limit (MDL) for faecal coliform is 2 MPN/ 100 ml in case of water samples and 0.18 MPN/g in cases of soil and food samples [26]; for Escherichia coli, the MDL is 1 cfu/ 100 ml in case of water samples and 1 cfu/g in cases of soil and food samples [32] and for Enterococci, the MDL is 1 cfu/ 100 ml in case of water samples and 1 cfu/g in cases of soil and food samples [33]. Below MDL, it is assumed that environmental medium (water, soil and food) is free from FIB and values in such cases are taken as ‘zero’ for statistical calculations.
Microbial Source Tracking was done through processing faecal positive samples for DNA extraction. Specific bacterial group primers Bacteroidales molecular markers for ruminant (RuBac) and for human (HuBac) were used to determine the source of faecal pollution environment samples. Ruminant and human Bacteroides specific primers amplify the target DNA by PCR technique. DNA was extracted from soil, food and water samples using DNeasy powersoil kit and QIAamp Fast DNA stool kit, respectively. Water samples were vacuum filtered through 0.45 μm pore size, 47 mm diameter nitrocellulose membrane filters prior to DNA extraction. 250-300 mg of soil and food samples were processed as per the protocol. DNA from water samples was extracted from the membrane filters by cutting them into small pieces in an eppendorf tube. The extracted DNA was then quantified using UV-spectrophotometer by taking absorbance at 260 nm and further calculating the concentration of DNA. Extracted DNA was amplified by SYBR Green Real-time PCR with specific primers. Distinctive Tm curve profile for RuBac and HuBac assays signifies the source of contamination in samples. The specificity assay is reported using human, bovine, swine, canine and equine faecal samples, HuBac primers showed 100 percent true positive identification and 32 percent false positive rate [34]. The specificity of Bacteroides as a biomarker for faecal contamination under human as a host category is reported 0.98 (N =241) and sensitivity 0.92 (N=25) [20].
Physico-chemical properties of water were studied to understand hydrogeology and stoichiometry of water resources [25]. The pH value measured by electrometric method [35], indicates acidic/ alkaline/ normal character of water and its acceptable limit in drinking water is 6.5 to 8.5 [36]. Turbidity measured by Nephelometric method [37], indicates clearness and transparency of water and its permissible limit in drinking water is 5 NTU [36]. Total Dissolved Solids (TDS) measured by gravimetric method [38], indicates dissolved salt concentration and its maximum permissible limit in drinking water is 2000 mg/L [36].
Data Analysis
Risk assessment matrix has been designed to estimate Relative Risk (RR) due faecal contamination in ODF and n-ODF environment [39, 40]. The water, soil and food, the sources of environmental medium in n- ODF villages were marked ‘A’ in event of contamination and ‘B’ in event of non-contamination, hence total sources in n-ODF become (A + B). Accordingly, the contaminated sources in ODF villages were marked ‘C’ and non-contaminated as ‘D’, hence making the total sources in ODF as (C + D). The probability of contamination in n-ODF villages, therefore, be “A / (A+B)” = “E” (say) and probability of contamination in ODF villages be “C / (C+D)” = “F” (say). The Relative Risk, therefore, would be = E/F. Accordingly, RR is calculated with respect to FIB Contamination and with respect to HuBac contamination. To address the 'zeros' in effect outcome, the Haldane-Anscombe Correction method was used, which recommends substituting zeros with 0.5 [39,40]. In addition, the one-way analysis of variance (ANOVA) (p less than0.05) test conducted to compare the mean±SD of ODF with corresponding value of n-ODF for statistical significance. The percentile values 90th (P90), 70th (P70) and 50th (P50) were also estimated for the purpose of interpretation.
Results
Physico-chemical profile of water medium
The pH value of water samples from all the sources in ODF & n-ODF villages of all the three states was found within acceptable limits [36] (Table 4). In case of TDS (in mg/L), P90 value in samples from Odisha (ODF & n- ODF villages), maximum values in samples both from Bihar (ODF & n-ODF villages) and West Bengal (ODF & n-ODF), were found within permissible limits [36] (Table 4). Interquartile range (IQR) of TDS was estimated 248 mg/L in ODF and 66 mg/L in n-ODF villages of Odisha; 195 mg/L in ODF and 89 mg/L in n-ODF villages of Bihar; and 516 mg/L in ODF and 26 mg/L in n-ODF villages of West Bengal (Figure 2a). In case of Turbidity (in NTU), P50 value in samples from Odisha (ODF & n-ODF), P70 value in samples from Bihar (ODF & n-ODF), P50 value in samples from West Bengal (ODF) and P70 value in samples from West Bengal (n-ODF) were found within the acceptable limit [36] (Table 4). The IQR of turbidity was estimated 7 NTU in ODF and less than 1 NTU in n-ODF villages of Odisha; 2 NTU each in ODF & n-ODF villages of Bihar and 1 NTU in ODF and less than 1 NTU n-ODF villages of West Bengal (Figure 2b). The results of physic-chemical investigation of water quality were found free from significant contamination.
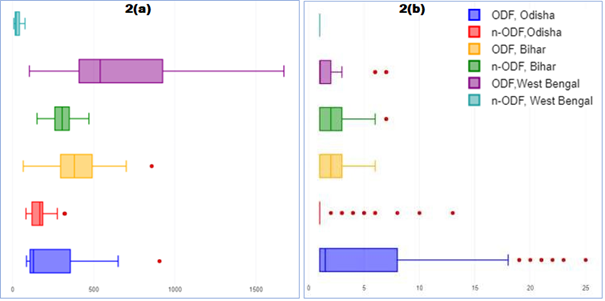
Figure 2: Physico-chemical profile of water medium a) TDS and b) Turbidity
Table 4: Summary of Physico-chemical analysis in water samples from ODF and n-ODF villages
| Parameters | Odisha | Bihar | West Bengal | ||||
| ODF | n-ODF | ODF | n-ODF | ODF | n-ODF | ||
| pH | Max. | 8.1 | 7.6 | 7.8 | 8.2 | 7.8 | 7.8 |
| Min. | 6.5 | 6.5 | 6.9 | 6.8 | 6.8 | 6.9 | |
| TDS, mg/l | Max. | 9060 | 2690 | 1690 | 1040 | 1738 | 133 |
| P90 | 1246 | 779 | 716 | 460 | 1231 | 67 | |
| P70 | 358 | 207 | 497 | 345 | 915 | 38 | |
| P50 | 172 | 181 | 393 | 122 | 695 | 22 | |
| Min. | 85 | 82 | 65 | 122 | 103 | 7 | |
| Turbidity, NTU | Max. | 85 | 317 | 133 | 31 | 26 | 70 |
| P90 | 36 | 32 | 7 | 13 | 14 | 9 | |
| P70 | 14 | 13 | 3 | 3 | 6 | 2 | |
| P50 | 4 | 4 | 2 | 2 | 2 | 1 | |
| Min. | <1> | <1> | 1 | 1 | 1 | 1 | |
Contamination by Faecal Indicator Bacteria (FIB)
The contamination by FIB means at least one of the FIB (faecal coliform, Escherichia coli, and Enterococci) is detected in the environmental medium. In ODF villages of Odisha, 8.6 percent groundwater samples, 39.1 percent household (HH) storage water samples, 33.3 percent piped water supply (PWS) water samples, 87.5 percent soil samples and 100 percent food samples were found contaminated, whereas in n-ODF villages contamination was observed in 30.3 percent groundwater samples, 67.9 percent HH storage water samples, 25.0 percent PWS water samples, 81.3 percent soil samples and 85.7 percent in food samples (Figure 3a). In case of ODF villages of Bihar, contamination was found in none of the groundwater sample, 23.8 percent HH storage water samples, none of the PWS water sample, 59.4 percent soil samples and none of the food sample, whereas in n-ODF villages, 52.5 percent groundwater samples, 82.6 percent HH storage water samples, 66.7 percent PWS water samples, 71.9 percent soil samples and 66.7 percent food samples were found contaminated (Figure 3b). In ODF villages of West Bengal, 2.6 percent groundwater sources, 15.0 percent HH storage water, 16.7 percent PWS water, 46.9 percent soil samples and none of the food sample were found contaminated, whereas contamination in n-ODF villages was observed in 16.7 percent groundwater samples, 65.5 percent HH storage water, 63.6 percent PWS water, 65.6 percent soil samples and 59.6 percent food samples (Figure 3c).
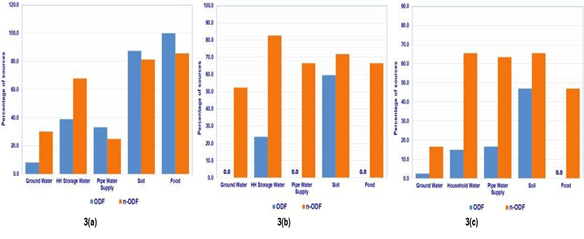
Figure 3: Percentage of sources contaminated with HuBac in a) Odisha, b) Bihar and c) West Bengal
The mean ± SD values of contamination of water samples with respect to faecal coliform (MPN/100 ml), Escherichia coli (cfu/100 ml) and Enterococci (cfu/100 ml), were observed higher in n-ODF villages as compared to the samples studied from ODF villages in all states (Table 1). The IQR of faecal coliform (MPN/100 ml) was estimated less than 2 in ODF villages of all states and 140, 186 and 220 in n-ODF villages of Odisha, Bihar and West Bengal, respectively (Figure 4a). In case of Escherichia coli (cfu/100 ml), IQR was estimated less than 1 in ODF villages of all states and 28, 43 and 35 in n-ODF villages of Odisha, Bihar and West Bengal, respectively (Figure 4b). The IQR of Enterococci (cfu/100 ml) was estimated less than 1 in ODF villages of all states and 10, 24 and 21 in n-ODF villages of Odisha, Bihar and West Bengal, respectively (Figure 4c).
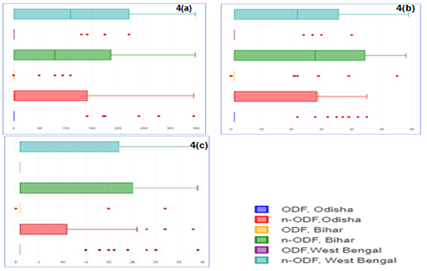
Figure 4: a) Faecal coliform, b) Escherichia coli, and c) Enterococci in water medium
In cases of both soil and food samples, the mean ± SD values of contamination with respect to faecal coliform (MPN/g), Escherichia coli (cfu/g) and Enterococci (cfu/g), were observed higher in n-ODF villages as compared to the samples studied from ODF villages both for the states Bihar and West Bengal, but in case of Odisha, these values were observed higher in ODF villages (Table 2 and 3). The IQR of faecal coliform (MPN/g) in soil was estimated 2.4x10³ and 7.0x10³, respectively in ODF and n-ODF villages of Odisha; 5.0x10³ and 4.9x10³, respectively in ODF & n-ODF villages of Bihar; and 4.0x10³ and 5.1x10³, respectively in ODF and n-ODF villages of West Bengal (Figure 5a). The IQR of Escherichia coli (cfu/g) in soil was estimated 25 & 51, respectively in ODF and n-ODF villages of Odisha; 46 and 47, respectively in ODF and n-ODF villages of Bihar; and 35 and 48, respectively in ODF and n-ODF villages of West Bengal (Figure 5b). The IQR of Enterococci (cfu/g) in soil was estimated less than 1 and 7, respectively in ODF and n-ODF villages of Odisha; 22 and 26, respectively in ODF and n-ODF villages of Bihar; and less than 1 and 11, respectively in ODF and n-ODF villages of West Bengal (Figure 5c).
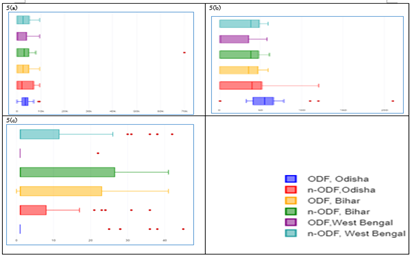
Figure 5: a) Faecal coliform, b) Escherichia coli, and c) Enterococci in soil medium.
In case of faecal coliform (MPN/g) in food, IQR was estimated 176 and 106, respectively in ODF and n-ODF villages of Odisha; less than 1 and 172, respectively in ODF and n-ODF villages of Bihar; and less than 1 and 149, respectively in ODF and n-ODF villages of West Bengal (Figure 6a). In case of Escherichia coli (cfu/g) in food, IQR was estimated 11 and 10, respectively in ODF and n-ODF villages of Odisha, less than 1 and 30, respectively in ODF and n-ODF villages of Bihar and less than 1 and 21, respectively in ODF and n-ODF villages of West Bengal (Figure 6b). In case of Enterococci (cfu/g) in food, IQR was estimated 14 and 13, respectively in ODF and n-ODF villages of Odisha; less than 1 both in ODF and n-ODF villages of Bihar; and less than 1 both in ODF and n-ODF villages of West Bengal (Figure 6c). Mean ± SD values of ODF were compared with that of n-ODF using one way ANOVA and found significant (p less than 0.05) (Table 1 to 3).
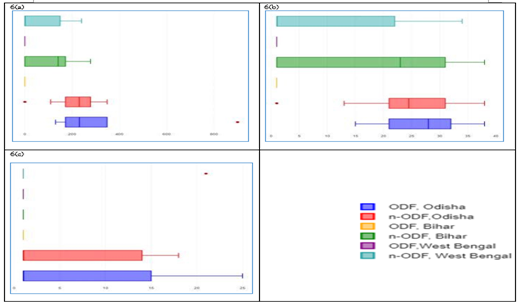
Figure 6: a) Faecal coliform, b) Escherichia coli, and c) Enterococci in food medium
Overall, in ODF villages, 9.3 percent water samples, 64.6 percent soil samples, 41.7 percent food samples crossed the minimum detection limit (MDL) both in cases of faecal coliform and Escherichia coli and 6.3 percent water samples, 15.6 percent soil samples and 12.5 percent food samples crossed MDL in case of Enterococci. Whereas in case of n-ODF villages, 52.4 percent water samples, 68.8 percent soil samples and 64.9 percent food samples crossed MDL both in cases of faecal coliform and Escherichia coli and 35.1 percent water samples, 28.1 percent soil samples and 18.9 percent food samples crossed MDL in case of Enterococci.
Faecal Contamination of Human Origin (HuBaC)
In ODF villages of Odisha, 2.9 percent groundwater samples, 17.4 percent HH storage water samples, 16.7 percent PWS water samples, 81.3 percent soil samples and 50.0 percent food samples were found contaminated, whereas in n-ODF villages contamination was observed in 15.2 percent groundwater samples, 25.0 percent HH storage water samples, 25.0 percent PWS water samples, 71.9 percent soil samples and 57.1 percent in food samples (Figure 7a). In case of ODF villages of Bihar, none of the groundwater sample, 19.0 percent HH storage water samples, none of the PWS water sample, 59.4 percent soil samples and none of the food sample were found contaminated, whereas in n-ODF villages, contamination was observed in 35.0 percent groundwater samples, 52.2 percent HH storage water samples, 16.7 percent PWS water samples, 71.9 percent soil samples and 66.7 percent food samples (Figure 7b). In ODF villages of West Bengal, 2.6 percent groundwater samples, 10.0 percent HH storage water, 16.7 percent PWS water, 40.6 percent soil samples and none of the food sample were found contaminated, whereas contamination in n-ODF villages was observed in 16.7 percent groundwater samples, 41.4 percent HH storage water, 45.5 percent PWS water, 56.3 percent soil samples and 47.1 percent food samples (Figure 7c).
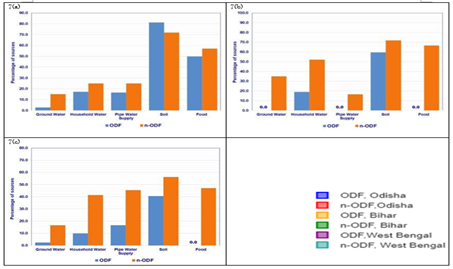
Figure 7: Percentage of sources contaminated with HuBac in a) Odisha, b) Bihar and c) West Bengal
Relative Risk (RR) Matrix
The relative risk evaluation matrix developed in present work facilitated to assess the effectiveness of ODF interventions in different environmental medium. The faecal contamination of groundwater showed RR 11.25 times more likely in n-ODF villages as compared to ODF villages (53.6 times more likely in Bihar; 6.50 times more likely in West Bengal and 3.54 times more likely in Odisha); the faecal contamination of groundwater traceable to humans indicated RR 12.66 times more likely in n-ODF villages as compared to ODF villages (35.7 times more likely in Bihar; 6.50 times more likely in West Bengal and 5.30 times more likely in Odisha); the RR of faecal contamination of HH storage water was estimated 2.68 times more likely in n-ODF villages as compared to ODF villages (3.47 times more likely in Bihar; 4.37 times more likely in West Bengal and 1.73 times more likely in Odisha); the RR of faecal contamination of HH storage water traceable to humans was calculated 2.48 times more likely in n-ODF villages as compared to ODF villages (2.74 times more likely in Bihar; 4.14 times more likely in West Bengal and 1.44 times more likely in Odisha); the faecal contamination of PWS water showed 2.71 times more likely RR in n-ODF villages as compared to ODF villages (5.33 times more likely in Bihar; 3.82 times more likely in West Bengal and 0.75 times more likely in Odisha); the RR of faecal contamination of PWS water traceable to humans was found 2.40 times more likely in n-ODF villages as compared to ODF villages (1.33 times more likely in Bihar; 2.73 times more likely in West Bengal and 1.50 times more likely in Odisha) (Table 5).
The faecal contamination of soil indicated 1.13 times more likely RR in n-ODF villages as compared to ODF villages (1.40 times more likely in West Bengal; 1.21 times more likely in Bihar and 0.93 times more likely in Odisha), whereas the faecal contamination of soil traceable to humans shows 1.10 times more likely RR in n-ODF villages as compared to ODF villages (1.38 times more likely in West Bengal; 1.21 times more likely in Bihar; and 0.88 times more likely in Odisha) (Table 5).
The faecal contamination of food indicated 1.48 times more likely RR in n-ODF villages as compared to ODF villages (8.47 times more likely in West Bengal; 6.67 times more likely in Bihar; and 0.90 times more likely in Odisha); the RR of faecal contamination of food traceable to humans was estimated 2.16 times more likely in n-ODF villages as compared to ODF villages (8.47 times more likely in West Bengal; 6.67 times more likely in Bihar and 1.14 times more likely in Odisha) (Table 5).
Discussion
Bacterial contamination source tracking of groundwater in ODF areas has been reported based on Multiple Antibiotic Resistance (MAR) index values, in which majority of samples were reportedly found contaminated due to non-human sources [21]. Other studies focused on validation of the process of detection of host-associated genetic markers and comparison of sensitivities and specificities [16,17]. Whereas, present study demonstrates Relative Risk estimation due to contamination of water, soil and food with respect to FIB and HuBac, to understand the magnitude of contamination in n-ODF villages in comparison to ODF villages. The study results indicate mitigation of risk due to faecal contamination of human origin in ODF villages in comparison to n-ODF villages albeit spectrum and intensity of reduction varies in different mediums of environment.
The findings with respect to water exhibits variable intensity of reduction, specifically groundwater indicates significant risk reduction. In case of piped water supply, considerable improvement is noticed. The potentiality of positive impacts of behavior changes component of the Swachh Bharat Mission (SBM) to improve handling and storage of water by adopting safe and hygienic practices resulted in interesting findings in case of HH storage water [41]. The findings with respect to soil manifest a relatively low risk reduction of faecal contamination of human origin in case of ODF villages as compared to n-ODF villages. This emphasizes the importance of faecal sludge and septage management together with solid and liquid waste management in more efficient ways to further prevent risks of soil contamination [42]. The investigations in context to food shows significant risk reduction due to faecal contamination of human origin in ODF villages, which may be due to notable improvement in terms of hygiene practices and probably the monitoring systems to ensure safe practices in terms of preparation and storage of food [5,6]. However, the major limitation of study was the non- availability of adequate size of food samples and hence investigations were carried out on available sample size.
This study provides the baseline status for the period December-2018 to January-2019, when ODF mission of the Government of India was still alive and active in rural areas and only few districts of three states namely Odisha, Bihar and West Bengal were still having villages with n-ODF status. Due to this reason and limitation, the study was conducted in only three states of India. However, by October-2019, entire Rural India (more than 660,000 villages) was declared ODF. Hence, investigation results for both ODF and n-ODF villages reported in this work, will set bottom-line for the future investigations.
In order to ensure sustainability in ODF behaviors, the Swachh Bharat Mission is moving towards next phase that is ODF plus to focus on providing interventions for the safe and adequate management of solid and liquid waste in villages as well as to reinforce the ODF behavior [43,44]. The implementation of ODF plus is further expected to reduce the risk of faecal contamination of environmental medium. The Relative Risk investigation framework will, therefore, be useful to assess the performance of ODF plus system.
Conclusion
The present study indicates mitigation of risk due to faecal contamination of human origin in ODF villages in comparison to n-ODF villages albeit spectrum and intensity of reduction varies in different environmental medium. In comparison to ODF villages, the relative risk due to faecal contamination traceable to human in n-ODF villages was estimated 12.66 times more likely in groundwater, 2.48 times more likely in household drinking water, 2.40 times more likely in piped water supply, 1.10 times more likely in soil and 2.16 times more likely in food. The findings in overall manifest the amelioration in sanitation and hygiene practices in ODF villages. The FIB and microbial source tracking based relative risk assessment matrix designed and used in present study, can be helpful towards evaluation of the performance ODF missions being implemented elsewhere in developing countries so that necessary corrective and preventive actions can be envisaged well in time to effectively achieve the targets of sanitation and hygiene as delineated by the Sustainable Development Goal 2030 of the United Nations. The study would also facilitate towards development of guidelines and protocols to assess the effectiveness of such interventions, which are the pressing needs to ensure sustainability. The evaluation of the effectiveness of the implementation of ODF system to achieve the targets of sanitation and hygiene is specifically important during the recovery phase of COVID-19 pandemic. To achieve this, the key recommendations of this study are to focus on social and behaviour change communication to create awareness amongst communities to understand importance of (i) open defecation free environment to accelerate sanitation coverage, (ii) adoption of overall cleanliness and hygiene practices including improved food storage practices to prevent contamination and (iii) improved water storage practices including disinfection of drinking water.
Abbreviations
HHSW: HouseholdStorage Water
PWS: PipedWater Supply
*To addressthe 'zeros' in effect outcome,the Haldane-Anscombe correction method39 has been used, which recommends substituting zeros with 0.5 (cells highlighted in ‘green’
Declarations
Data Availability
The data that supportthe findings of this study are availableupon request to the corresponding author.
Acknowledgements
Authors are immensely grateful to the Department of Drinking Water and Sanitation (DDWS), the Ministry of Jal Shakti (MoJS), the Government of India for providing advisory to the State Governments of Odisha, Bihar and West Bengal to support the research team to undertake the tasks of survey and sampling at various sites. The support extended to visiting research team for survey and sampling in respective states, by the officials of UNICEF Field Offices, District Collectors and Sanitation Coordinators, is acknowledged most thankfully. The communication number to this manuscript assigned by Shriram Institute for Industrial Research is SRI- MS#20210723-02.
Authors Contributions
J.K. developed the study design, methodology, sampling design and performed work execution, interpretation, data analysisand drafting of manuscript. D.S.C. participated in sampling execution, site analysis, landuse pattern and data interpretation. D.S. was involved in sampling and laboratory investigation. S.C. participated in laboratory investigation. G. participated in sampling and laboratory investigation. S.M. performed data analysis and interpretation. Su.M. developedsurvey concept and samplingdesign. N.O. developedstudy concept and performed project management and data analysis. M.D. performed overall review, in-depth analysis of facts and findings and overall value additions. All authors read and approved the final version of the manuscript.
Competing Interests
The authorsdeclare no competinginterests.
Additional information
Correspondence and requestfor materials should be addressedto J.K.
Ethical Approval
Not Applicable
Consent to Participate
Not Applicable
References
- United Nations. (2018). Sustainable Development Goal 6. Synthesis Report on Water and Sanitation.
Publisher | Google Scholor - UNICEF & WHO. (2020). State of the world’s sanitation: An urgent call to transform sanitation for better health, environments, economies, and societies. Summary Report.
Publisher | Google Scholor - WHO & UNICEF. (2019). Progress on household drinking water, sanitation and hygiene 2000–2017: Special focus on inequalities.
Publisher | Google Scholor - WHO & UNICEF. (2021). Progress on household drinking water, sanitation and hygiene 2000-2020: Five years into the SDGs. World Health Organization & United Nations Children’s Fund.
Publisher | Google Scholor - Department of Drinking Water and Sanitation (DDWS). (2016). Swachh Survekshan Gramin. Ministry of Jal Shakti.
Publisher | Google Scholor - Department of Drinking Water and Sanitation (DDWS-SWM-G). (2015). Guidelines for ODF verification and status of ODF villages. Swachh Bharat Mission (Gramin), Ministry of Jal Shakti.
Publisher | Google Scholor - UNICEF-SRI Joint Scientific Study. (2019). Impacts of the achievement of ODF status on the incidence of environmental contamination. Ministry of Jal Shakti.
Publisher | Google Scholor - Banda, K., Sarkar, R., Gopal, S., Govindarajan, J., Harijan, B. B., Jeyakumar, M. B., Mitta, P., Sadanala, M. E., Selwyn, T., Suresh, C. R., Thomas, V. A., Devadason, P., Kumar, R., Selvapandian, D., Kang, G., & Balraj, V. (2007). Water handling, sanitation and defecation practices in rural southern India: A knowledge, attitudes and practices study. Transactions of the Royal Society of Tropical Medicine and Hygiene, 101:1124-1130.
Publisher | Google Scholor - Ashbolt, N. J., Grabow, W. O. K., & Snozzi, M. (2001). Indicators of microbial water quality. In Fewtrell, L. & Bartram, J. (Eds.), Water quality guidelines, standards and health (pp. 289-316). IWA Publishing.
Publisher | Google Scholor - Cabral, J. P. S. (2010). Water microbiology, bacterial pathogens and water. International Journal of Environmental Research and Public Health, 7:3657-3703.
Publisher | Google Scholor - Kinzelman, J., Field, K. G., Green, H. C., Harwood, V. J., & McPhail, C. (2012). Indicators, sanitary surveys and source attribution techniques. In Dufour, A. L., Bartram, J., Bos, R., & Gannon, V. (Eds.), World Health Organization (WHO) Animal Waste, Water Quality and Human Health. IWA Publishing, 319-360
Publisher | Google Scholor - Zseni, A. (2015). Human excreta as an important factor of sustainable water management and agriculture. In 4th International Conference on Informatics, Environment, Energy and Applications. IPCBEE, 82:113-117
Publisher | Google Scholor - Domingo, J. W. S., & Edge, T. A. (2010). Identification of primary sources of fecal pollution. In Rees, G., Pond, K., Kay, D., Bartram, J., & Domingo, J. S. (Eds.), World Health Organization (WHO) Safe Management of Shellfish and Harvest Waters. IWA Publishing, 51-90.
Publisher | Google Scholor - Schriewer, A., Odagiri, M., Wuertz, S., Misra, P. R., Panigrahi, P., Clasen, T., & Jenkins, M. (2015). Human and animal fecal contamination of community water sources, stored drinking water, and hands in rural India measured with validated microbial source tracking assays. American Journal of Tropical Medicine and Hygiene, 93:509-516.
Publisher | Google Scholor - Staley, Z. R., Grabuski, J., Sverko, E., & Edge, T. A. (2016). Comparison of microbial and chemical source tracking markers to identify fecal contamination sources in the Humber River (Toronto, Ontario, Canada) and associated storm water outfalls. Applied and Environmental Microbiology, 82:6357-6366.
Publisher | Google Scholor - Xue, J., & Feng, Y. (2018). Evaluation of host-associated genetic markers for rapid PCR-based identification of fecal contamination sources in water. Open Access Journal of Environmental Science, 1(1):36-42.
Publisher | Google Scholor - Ahmed, W., Goonetilleke, A., Powell, D., Chauhan, K., & Gardner, T. (2009). Comparison of molecular markers to detect fresh sewage in environmental waters. Water Research, 43:4908-4917.
Publisher | Google Scholor - Bachoon, D. S., Lukman, M. M., & Burt, C. D. (2012). Detection of Stx 2 Gene of Escherichia coli and elevated levels of fecal bacteria in the cattle farming regions of Lake Oconee. Advances in Microbiology, 2:523-530.
Publisher | Google Scholor - Carson, C. A., Shear, B. L., Ellersieck, M. R., & Asfaw, A. (2001). Identification of fecal Escherichia coli from humans and animals by ribotyping. Applied and Environmental Microbiology, 67:1503-1507.
Publisher | Google Scholor - Sargeant, D., Kammin, W. R., & Collyard, S. (2011). Review and critique of current microbial source tracking (MST) techniques. Publication No. 11-03-038. Department of Ecology, State of Washington.
Publisher | Google Scholor - Malan, A., Kumar, V., & Sharma, H. R. (2020). Bacteriological evaluation of groundwater in open-defecation-free villages of Kurukshetra district, Haryana, India. International Journal of Environmental Studies, 77:928-941.
Publisher | Google Scholor - Census of India. (2011). District Census Handbook, Directorate of Census Operations, Village and Town Directory.
Publisher | Google Scholor - NITI Aayog. (2021). India National Multidimensional Poverty Index Baseline Report.
Publisher | Google Scholor - Central Ground Water Board (CGWB). (2020). National compilation of ground water resources of India. Ministry of Jal Shakti.
Publisher | Google Scholor - American Public Health Association (APHA), American Water Works Association (AWWA), & Water Environment Federation (WEF). (2017). Standard Methods for Examination of Water and Wastewater (23rd ed.).
Publisher | Google Scholor - Bureau of Indian Standards (BIS). (2018). Isolation, identification and enumeration of Escherichia coli (IS 5887 Part-1).
Publisher | Google Scholor - Layton, A., McKay, L., Williams, D., Garrett, V., Gentry, R., & Sayler, G. (2006). Development of Bacteroides 16S rRNA gene TaqMan-based real-time PCR assays for estimation of total, human, and bovine fecal pollution in water. Applied and Environmental Microbiology, 72:4214-4224.
Publisher | Google Scholor - Department of Drinking Water and Sanitation (DDWS). (2019). From ODF to ODF plus rural sanitation strategy 2019-2029. Ministry of Jal Shakti.
Publisher | Google Scholor - Department of Drinking Water and Sanitation (DDWS). (2020-21). Process manual for ODF plus baseline guidance notes for districts and field teams.
Publisher | Google Scholor