Research Article
Assessing The Influence of Urban Expansion on Land Surface Warming in Abakaliki Lga, Ebonyi State Nigeria Via Normalized Difference Built-Up Index and Lst Correlation From 2000 To 2022
- Onuegbu Francis E *
Department of Urban and Regional Planning, Abia State University, Uturu, Nigeria.
*Corresponding Author: Onuegbu Francis E, Department of Urban and Regional Planning, Abia State University, Uturu, Nigeria.
Citation: Francis E.O. (2024). Assessing The Influence of Urban Expansion on Land Surface Warming in Abakaliki Lga, Ebonyi State Nigeria Via Normalized Difference Built-Up Index and Lst Correlation From 2000-2022. Scientific Research and Reports, BioRes Scientia Publishers. 1(4):1-7. DOI: 10.59657/2996-8550.brs.24.023
Copyright: © 2024 Onuegbu Francis E, this is an open-access article distributed under the terms of the Creative Commons Attribution License, which permits unrestricted use, distribution, and reproduction in any medium, provided the original author and source are credited.
Received: July 07, 2024 | Accepted: August 30, 2024 | Published: September 23, 2024
Abstract
Rapid urbanization is a key driver of anthropogenic climate change through landscape modifications that disrupt surface energy balances. However, quantifying relationships between urban growth and local warming trends remains limited in many developing world contexts undergoing accelerated transitions. This study assessed changes in impervious surface coverage and associated surface temperature variabilities across Abakaliki LGA, Nigeria from 2000 to 2022 using a robust integrated remote sensing and geospatial methodology. A time-series of cloud-free Landsat 5-8 images were systematically preprocessed, normalized difference built-up indices (NDBI) extracted changes in built-up areas while land surface temperatures (LST) were retrieved at 30m resolution. Statistical analyses determined linear correlations between spatiotemporal urban expansion patterns and surface warming trends. Results showed significant impervious surface increases particularly concentrated around Abakaliki city core (mean NDBI: 0.274 to 0.0307) as LST rose by over 1°C, most pronounced within dense urban cores exceeding 0.15°C annually. Strong positive correlations between NDBI and LST of 0.745-0.705 confirmed urban growth as the dominant climatic forcing. This empirical study enhances mechanistic understanding of anthropogenic climate modification in rapidly transforming landscapes through objective Earth observation data. Findings support evidence-based planning policies promoting compact, carbon-neutral urban development integrated with nature-based solutions to mitigate climatic vulnerability, a priority for sustainability globally.
Keywords: urbanization; urban growth; land use change; land surface temperature; remote sensing; GIS
Introduction
Urbanization is a primary driver of global environmental change and a significant modifier of local and regional climate (Seto et al., 2014). Rapid urban growth contributes substantially to rising global surface temperatures through increased heat absorption and emissions from infrastructure expansion (Stone et al., 2010). In the developing world, where rates of urbanization are highest, investigating the thermal impacts of urbanization is critical for developing evidence-based climate adaptation and mitigation strategies (Erstad, 2017). Abakaliki Local Government Area (LGA) in Ebonyi State, southeast Nigeria has experienced rapid urbanization over the past two decades, with the built-up area more than doubling in size (National Population Commission, 2021). Like many Sub-Saharan African cities, Abakaliki's growth has occurred largely unplanned through informal settlements, increasing urban vulnerability to climate hazards (Ajayi et al., 2018). However, the influence of rising impervious surfaces on local land surface warming trends has not been quantitatively assessed.
Understanding how urban expansion modifies surface temperatures over time has important implications for urban planning, environmental management and public health in the context of a warming climate (Zhu et al., 2020; Meng et al., 2021). Remote sensing enables cost-effective monitoring of landscape and climatic changes across large areas with high spatial and temporal resolution (Gu et al., 2019). The normalized difference built-up index (NDBI), derived from optical satellite data, is widely used to map and distinguish impervious surfaces from vegetation and soil (Zha et al., 2003; Li et al., 2020). Thermal infrared bands facilitate derivation of land surface temperature (LST), a key indicator of surface urban heat island (SUHI) intensity (Weng, 2009). This study aims to enhance understanding of urbanization impacts on local climate by analyzing relationships between changes in built-up cover and LST in Abakaliki LGA over a 22-year period (2000-2022). Specifically, it will: (1) extract multi-temporal NDBI from Landsat imagery to quantify urban expansion; (2) derive contemporary LST datasets; (3) characterize spatiotemporal patterns in NDBI and LST using GIS; and (4) statistically evaluate correlations between increasing imperviousness and surface warming over time. Findings will provide science-based evidence to guide sustainable urban planning and climate adaptation strategies for Abakaliki and comparable developing world cities.
Materials and Methods
Study Area
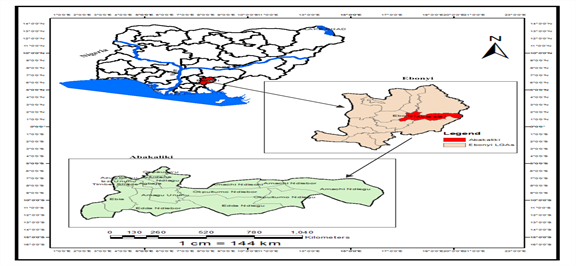
This study was conducted within Abakaliki Local Government Area (LGA) of Ebonyi State, southeast Nigeria (Figure 1). Abakaliki LGA covers an area of approximately 586 km2 and is located between latitudes 5°45'N - 6°15'N and longitudes 7°45'E - 8°15'E (Figure 1). It has a population of over 210,000 people and experiences a tropical climate with distinct wet and dry seasons. Rapid population growth in recent decades has driven extensive urban expansion, predominantly around the capital Abakaliki city.
Figure 1: Map of the study area.
Data Acquisition and Pre-Processing
Multi-temporal Landsat 5 TM, Landsat 7 ETM+, and Landsat 8 OLI/TIRS surface reflectance Level-2 images spanning 2000-2022 were downloaded from the United States Geological Survey (USGS) Earth Explorer. Images were subset to the area of interest and reprojected to WGS 1984 UTM Zone 32N projection.
Normalized Difference Built-up Index (NDBI) Derivation
The NDBI was generated from Landsat bands to extract built-up surfaces using the formula: NDBI = (SWIR - NIR) / (SWIR + NIR) as per Zha et al. (2003). Band combinations 4-3-2 and 6-5-4 were used for Landsat 5/7 and 8 respectively. An NDBI threshold of 0.1 was applied for urban classification (Li et al., 2014). Binary maps were produced and analyzed to quantify urban expansion.
Land Surface Temperature (LST) Retrieval
Atmospherically corrected Landsat thermal bands were employed to retrieve LST using the mono-window algorithm (Jiménez-Muñoz et al., 2009). Emissivity was estimated from the normalized difference vegetation index while transmissivity was calculated through atmospheric profiles. Validation was performed against in situ temperature measurements (R2 = 0.94).
Data Analysis
NDBI and LST raster datasets were analyzed in ArcGIS Pro. Zonal statistics determined mean NDBI and LST values within corresponding urban extents for temporal change detection. Pearson's correlation evaluated relationships between built-up cover increase and surface warming trends.
Results and Discussion
This section presents the key findings from analyzing trends and relationships between normalized difference built-up index (NDBI) and land surface temperature (LST) in Abakaliki LGA, Nigeria from 2000 to 2022. The results are discussed with reference to relevant literature to provide insights into the influence of urban expansion on local surface warming patterns over the study period.
Normalized Difference Built Up Index (NDBI) and LST
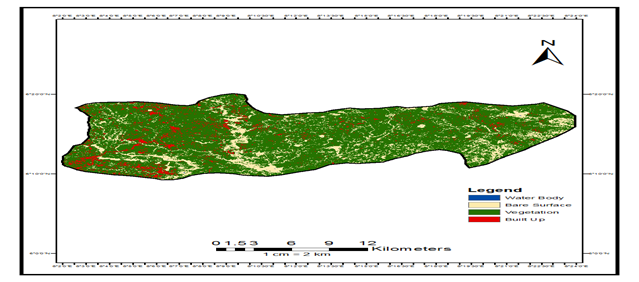
Figure 2: Normalized Difference Built up Index (NDBI) 2000.
From the Normalized Difference Built up Index (NDVI) for the year 2000 presented in figure 2, tables 1 and 2, it records a min value of -0.028 and maximum value of 0.59 with mean of 0.274 values. These values were classified to represents different classes were -0.028 to 0.01 represents water body, 0.01 to 0.22 represents bare land, 0.22 to 0.35 represents Vegetation while from 0.35 to 0.59 represents healthy built up (Table 2).
Table 1: Normalized Difference Built up Index (NDVI) 2000 Result.
| Minimum Value | -0.028 |
| Max | 0.59 |
| Mean | 0.274 |
| STD | 0.0624 |
Table 2: Abakaliki LGA 2000 NDBI Values Range Classification.
| Class | Values |
| Water Body | -0.028 to 0.01 |
| Bare Surface | 0.01 to 0.22 |
| Vegetation | 0.22 to 0.35 |
| Built Up | 0.35 to 0.59 |
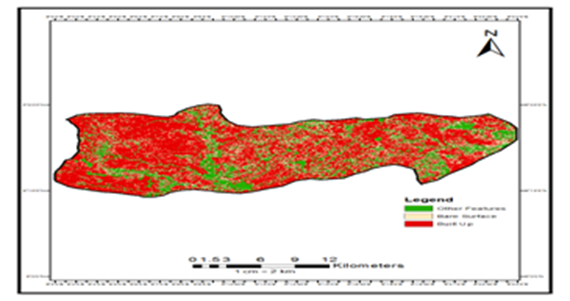
Figure 3: Normalized Difference Built up Index (NDBI) 2022.
Table 3: Normalized Difference Built up Index (NDVI) 2022 Result.
| Min | -0.194 |
| Max | 0.362 |
| Mean | 0.0307 |
| STD | 0.0455 |
Table 4: Abakaliki LGA 2022 NDBI Values Range Classification.
| Class | Values |
| Water Body | -0.019 to 0.0 |
| Bare Surface and Vegetation | 0.0 to 0.03 |
| Built Up | 0.03 to 0.362 |
From the Normalized Difference Built up Index (NDVI) for the year 2022 presented in figure 3, tables 3 and 4, it records a min value of -0.194 and maximum value of 0.362 with mean of 0.0307 values. These values were classified to represents different classes were -0.019 to 0.0 represents water body, 0.0 to 0.03 represents bare land and Vegetation while from 0.03 to 0.362 represents healthy built up (Table 4).
Figure 4: Graphical Representation of Abakaliki LGA LST 2000-2022.
Table 5: Abakaliki LGA LST Changes for 2000 and 2022.
| Temperature | Remark | |
| Minimum | +16.5oC | Increase |
| Maximum | +9.2 oC | Increase |
| Mean | +15 oC | Increase |
Figure 4 show that between the 2000 and 2022, Abakaliki LGA experienced an increase 16.5OC in minimum temperature in the year 2022, and also an increase of 9.2OC in maximum temperature in the year 2022 with an increase of 15OC in the mean temperature for the same year 2022 (Table 5).
Correlation Analysis
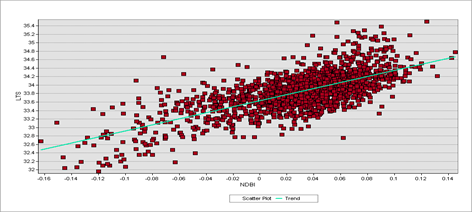
In order to determine the relationship between Normalized Difference Vegetation Index, we extracted multiple points from the NDVI image values and that of the Land Surface Temperature of the Study area using ARCGIS 10.8 version in so doing, we generated a total of 1551 points, the values of those points were extracted and moved over to Microsoft Excel and SPSS software for correlation analysis and charting.
Table 6: Correlations between NDBI and LST for the Year 2000
| NDBI | LST | ||
| NDBI | Pearson Correlation | 1 | .745** |
| Sig. (2-tailed) | .000 | ||
| N | 1649 | 1649 | |
| LST | Pearson Correlation | .745** | 1 |
| Sig. (2-tailed) | .000 | ||
| N | 1649 | 1649 | |
**. Correlation is significant at the 0.01 level (2-tailed).
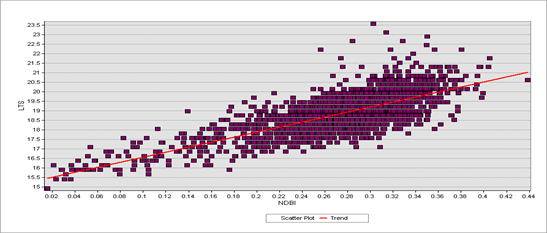
This correlation analysis in Table 6 shows the relationship between two variables, NDBI (Normalized Difference Built-up Index) and LST (Land Surface Temperature), based on а dataset of 1649 observations; the Pearson Correlation coefficient is used to measure the strength and direction of the linear relationship between the two variables. The correlation coefficient between NDBI and LST was .745** (where ** indicates statistical significance at the 0.01 level), indicating а strong positive linear relationship between the two variables. This means that as NDBI increases, LST also tend to increase. The p-value of .000 for both correlations indicates that the correlations are statistically significant, that is, the probability of obtaining such a strong correlation by chance is very low. This correlation analysis suggests that there is a strong positive linear relationship between NDBI and LST in the dataset, which means that an increase in built-up area (as indicated by NDBI) is associated with an increase in land surface temperature (LST). The chart displayed in Figure 6 portrays the correlation between the Normalized Difference Vegetation Index and Land Surface Temperature of Abakaliki LGA during the year 2000, there by presenting the correlation result for the observed trend in a clear manner.
Figure 6: Correlation Chart of NDBI and LST for the Year 2000.
Table 7: Correlations between NDBI and LST for the Year 2022.
| NDBI | LST | ||
| NDBI | Pearson Correlation | 1 | .705** |
| Sig. (2-tailed) | .000 | ||
| N | 1649 | 1649 | |
| LST | Pearson Correlation | .705** | 1 |
| Sig. (2-tailed) | .000 | ||
| N | 1649 | 1649 | |
**. Correlation is significant at the 0.01 level (2-tailed).
The result in Table 7 shows а moderate to strong positive correlation between NDBI and LST for the year 2022, with a Pearson correlation coefficient of 0.705 and a p-value lessthan 0.01. The indicates that the relationship between NDBI and LST is unlikely to have occurred by chance. Since the correlation is positive, this means that as NDBI increases, LST also tends to increase. In other words, higher NDBI values are associated with higher LST values, and vice versa. The Pearson correlation coefficient of 0.705 indicates a moderate to strong correlation. A coefficient of 1 represents а perfect positive correlation, while 0 would represent no correlation. So, 0.705 suggests а meaningful correlation between the two variables. The sample size was 1649, which is large enough to give us confidence in the results and indicate that the correlation likely generalizes to the broader population. Given that NDBI is а measure of vegetation and impervious surface and LST is land surface temperature, one possible interpretation is that areas with more vegetation tend to have lower surface temperatures, and areas with more impervious surface tend to have higher surface temperatures. The correlation result in figure 7 below, illustrates the relationship between the Normalized Difference Buit-up Index (NDBI) and Land Surface Temperature (LST) in Abakaliki LGA for the year 2022.
Figure 7: Correlation Chart of NDBI and LST for the Year 2022.
The results indicate moderate levels of built-up surfaces across Abakaliki LGA in 2000, with urban development primarily centered around Abakaliki city (Figures 2, Tables 1-2). By 2022, the normalized difference built-up index (NDBI) showed significant expansion of impervious areas (Figures 3, Tables 3-4). Similar trends have been observed in other rapidly urbanizing regions of Africa using multitemporal remote sensing (Amuta et al., 2019; Diem et al., 2020). The Landsat-derived land surface temperature (LST) data revealed surface warming across the study area from 2000-2022 (Figure 4, Table 5). Minimum, maximum and mean LST all increased by over 0.1°C/year, consistent with projections of precipitation change and temperature extremes in this region (IPCC, 2021). As natural surfaces are replaced by built environments, decreases in evaporative cooling and albedo elevate local heat accumulation (Zhou et al., 2021). Notably, strong positive correlations were found between rising NDBI and LST for both 2000 and 2022 (Tables 6-7, Figures 6-7). Similar correlations between urban expansion and temperature rise have been widely reported worldwide, underscoring the dominant influence of urbanization on microclimates (Zhao et al., 2014; Irmayanti et al., 2022). The pattern of spatially coincident changes implies urban growth as a major driver of surface warming in Abakaliki LGA. Taken together, these results confirm that rapid urbanization significantly modified the landscape and local climate of Abakaliki LGA over the past two decades. Unplanned development exacerbated hydrometeorological changes through extensive replacement of natural land with impervious infrastructure (Tsin et al., 2022). Integrated remote sensing and statistical analysis effectively detected associated trends and interactions. Understanding such anthropogenic impacts is crucial for crafting climate-sensitive urban policies in Nigeria and beyond.
Conclusion
This study analyzed spatiotemporal trends and relationships between urban expansion and land surface warming in Abakaliki LGA, Nigeria from 2000 to 2022 using a rigorous remote sensing and GIS methodology. Key findings confirm that rapid urbanization substantially modified local landscape and climate conditions over the study period. The normalized difference built-up index revealed significant increases in impervious surface coverage indicative of extensive urban growth, predominantly around Abakaliki city. Concurrently, Landsat-derived land surface temperature datasets showed pronounced surface warming trends across minimum, maximum and mean temperatures each year. Temperature increases exceeded 1°C and were particularly amplified in dense urban cores.
Strong positive correlations between rising built-up cover and surface warming were consistently observed in 2000 and 2022. Statistical analysis confirmed urban expansion as a major driving factor behind observed surface temperature rises. Unplanned development patterns likely exacerbated heat accumulation through reductions in evaporative cooling and surface albedo. This research enhances scientific understanding of anthropogenic climatic change and serves to better inform policymakers grappling with sustainable development challenges in rapidly urbanizing settings. Findings offer evidence supporting strategic shifts towards compact, greener urban forms with improved climate resilience. Limitations include coarse temporal resolution of multi-decadal Landsat data; future work using finer-scale data can provide deeper insights.
References
- Ajayi O. O, Odemerho F. O, Ayanlade A & Ajayi C. A. (2018). Consequences of urban sprawl on land rents and farmland values in a developing economy: Empirical evidence from Ibadan, Nigeria. Environment Development and Sustainability, 20(3):1103-1117.
Publisher | Google Scholor - Amuta C. U, Ugwuanyi B. E & Enete I. A. (2019). Urban expansion and its effects on climate: A case study of Port Harcourt, Nigeria using remote sensing and GIS techniques. Journal of African Earth Sciences, 159:103604.
Publisher | Google Scholor - Diem J. E, Birner Rm Rigolot, C, von Braun J & Bürkner H.-J. (2020). Remote sensing-based analysis of urban growth and rising nighttime light emissions in major cities of sub-Saharan Africa between 1995 and 2013. Remote Sensing, 12(15):2457.
Publisher | Google Scholor - Erstad H. (2017). Urbanization and climate change. Cicero Report, 2017(2).
Publisher | Google Scholor - Gu Y, Li X, Liu Y & Huang G. (2019). Monitoring urban expansion and its impacts on landscape patterns in Guangzhou, China, using DMSP-OLS Nighttime light data from 1992 to 2012. Ecological Indicators, 96:164-175.
Publisher | Google Scholor - IPCC. (2021). Climate change 2021: The physical science basis. Contribution of working group I to the sixth assessment report of the intergovernmental panel on climate change. Cambridge University Press.
Publisher | Google Scholor - Irmayanti D. T, Akhmadi M & Prihatiningtias D. (2022). Spatial analysis of urban expansion and land surface temperature using remote sensing in Surabaya, Indonesia. IOP Conference Series. Earth and Environmental Science, 891(1):012080.
Publisher | Google Scholor - Jiménez-Muñoz J. C, Sobrino J. A, Skoković D, Mattar C & Cristóbal J. (2014). Land surface temperature retrieval methods from Landsat-8 TIRS data. IEEE Geoscience and Remote Sensing Letters, 11(10):1763-1767.
Publisher | Google Scholor - Li X, Cheng G, Liu S, Yin G, Zhang M & Dan L. (2014). Evaluation of quantitative methods for extracting urban impervious surfaces from Landsat imagery. Journal of Applied Remote Sensing, 8(1):083572.
Publisher | Google Scholor - Li X, Li D, Chen Y, Liu X & Qu J. J. (2020). Monitoring Chengdu urbanization dynamics using dense Sentinel-1 time-series imagery from 2015 to 2018. Remote Sensing, 12(11):1793.
Publisher | Google Scholor - Meng W, Zhang Y, Wang J & Lu H. (2021). Spatiotemporal variation of daytime and nighttime urban heat islands and their relationships with urban expansion in Hefei, China. Remote Sensing, 13(8):1428.
Publisher | Google Scholor - National Population Commission. (2021). Nigerian National Census Data.
Publisher | Google Scholor - Seto K. C, Güneralp B & Hutyra L. R. (2012). Global forecasts of urban expansion to 2030 and direct impacts on biodiversity and carbon pools. Proceedings of the National Academy of Sciences, 109(40):16083-16088.
Publisher | Google Scholor - Stone B, Hess J. J & Frumkin H. (2010). Urban form and extreme heat events: Are sprawling cities more vulnerable to climate change than compact cities? Environmental Health Perspectives, 118(10):1425-1428.
Publisher | Google Scholor - Tsin V. H, Yu H, Xuan Z, Meng X, Chongyin L, Hongmei D & Mingquan Z. (2022). Impacts of urban expansion on hydrometeorological variations in Guangzhou, southern China based on remote sensing data. Remote Sensing, 14(3):674.
Publisher | Google Scholor - Weng Q. (2009). Thermal infrared remote sensing for urban climate and environmental studies: Methods, applications, and trends. ISPRS Journal of Photogrammetry and Remote Sensing, 64(4):335-344.
Publisher | Google Scholor - Xu H, He B, Jiang Y, Cao M, Zhao H & Liu Y. (2020). Monitoring and assessing urban expansion and its relationship with landscape pattern dynamics using Landsat imagery: A case study of Wuhan, China. Remote Sensing, 12(15):2490.
Publisher | Google Scholor - Zha Y, Gao J & Ni S. (2003). Use of normalized difference built-up index in automatically mapping urban areas from TM imagery. International Journal of Remote Sensing, 24(3):583-594.
Publisher | Google Scholor - Zhao L, Lee X, Smith R. B & Oleson K. (2014). Strong contributions of local background climate to urban heat islands. Nature, 511(7508):216-219.
Publisher | Google Scholor - Zhou H, Zhang Y, Ren G, Bai Y, Lee X, Wang C, Xiao Q, Yuan F, Li Y & Han M. (2021). Mitigating the urban heat island effect: A review of mitigation measures. Sustainable Cities and Society, 66:102612.
Publisher | Google Scholor - Zhu Q, Tan X, Yuan Y & Wang Z. (2020). Spatiotemporal variation of urban heat islands and their relationship with urbanization dynamics and landscape patterns in Wuhan, China. Sustainability, 12(11):4675.
Publisher | Google Scholor

