Research Article
Analyzing Tourism Reviews using Deep Learning and AI to Predict Sentiments
University of Sannio, Italy.
*Corresponding Author: Piergiorgio Marigliano,University of Sannio, Italy.
Citation: P. Marigliano. (2023). Analyzing Tourism Reviews Using Deep Learning and AI to Predict Sentiments. Clinical Case Reports and Studies, BioRes Scientia Publishers. 3(6):1-13. DOI: 10.59657/2837-2565.brs.23.089
Copyright: © 2023 Piergiorgio Marigliano, this is an open-access article distributed under the terms of the Creative Commons Attribution License, which permits unrestricted use, distribution, and reproduction in any medium, provided the original author and source are credited.
Received: November 24, 2023 | Accepted: December 08, 2023 | Published: December 15, 2023
Abstract
In this study, we investigate the application of Artificial Intelligence (AI), specifically through Deep Learning and neural networks, in analyzing and predicting sentiments expressed in tourism reviews. Our dataset comprised various hotel reviews, with the objective to predict whether each textual review indicates positive or negative feedback. The primary challenge was to use solely the textual data of the reviews for this prediction. Through meticulous data processing and analysis, we developed neural network-based models that highlight the efficacy of Deep Learning in the accurate interpretation of reviews. Our findings reveal a significant correlation between the content of reviews and their overall ratings, thereby providing new insights into the application of AI in automating and enhancing understanding of customer needs and perceptions in the tourism sector. The principal contribution of this study is the practical demonstration of how AI techniques can be effectively employed to analyze large volumes of textual data, opening new avenues for marketing strategies and service optimization in the hospitality industry. Each review represents a client’s assessment of a hotel. For each textual review, we aim to predict whether it corresponds to a positive review (the customer is satisfied) or a negative review (the customer is dissatisfied). The overall ratings of the reviews can range from 2.5/10 to 10/10. To simplify the issue, we’ll categorize them as follows: negative reviews have overall ratings of less than 5; positive reviews have ratings of 5 or higher. The challenge lies in predicting this information using only the raw textual data of the review.
Keywords: tourism; artificial intelligence; machine learning; deep learning; neural networks
Introduction
In the modern era, with the advent of the digital age, we are witnessing the emergence of novel unstructured data types. When combined with traditional structured data, this convergence has sparked a Big Data revolution. This revolution is further propelled by rapid advancements in computational capabilities and innovative algorithmic designs. These developments have culminated in sophisticated analytics that transcend traditional Business Intelligence, enabling deeper understanding and forecasting of future trends. Our study seizes upon these advancements to specifically address the tourism sector, posing a fundamental question: How can we utilize these cutting-edge technologies to uncover new insights within the tourism industry? In exploring the utilization of a diverse array of analytical techniques, the tourism sector stands to uncover previously hidden patterns, relationships, and perform real-time analysis for deeper insights. This approach leads us to our first research question: Can Artificial Intelligence (AI) and Deep Learning techniques effectively dissect and predict sentiments in hotel reviews to unveil customer preferences and experiences in the tourism sector? The complexity of statistically representing tourism arises from its composition of a myriad of services. To manage this complexity, our study hones in on hotel reviews, a rich source of direct traveler insights that reflect both demand and supply aspects of the tourism industry. We justify this focus by considering the potential of hotel reviews as a microcosm of broader tourism trends. Given the vast scope of data in tourism, which often qualifies as big data due to the multitude of individuals, operations, and activities it encompasses, we are driven to investigate how AI and Deep Learning can scrutinize and enhance the understanding of this data. Our introduction of 'smart tourism' and 'smart destinations' is deliberate, reflecting an ambition to delve into how tourism has evolved into a critical component of national economies. The consistent growth of the tourism sector, despite its fluctuations, prompts us to inquire: How do external factors and unforeseen events shape tourism trends, and how can AI contribute to mitigating their impacts? Focusing on international tourist movements, our study seeks to decipher patterns of tourism growth and demand trajectories. This leads us to another pivotal research question: In what ways can the analysis of hotel reviews, utilizing AI and Deep Learning techniques, enhance our understanding of these patterns and assist in predicting future tourist influxes? An essential part of our research involves delving into data mining and preprocessing. This process is crucial in transforming raw data into formats that are digestible and actionable for Machine Learning models. The often-imperfect nature of real-world data necessitates this initial step, making it a critical aspect of our analytical framework. Our exploration will encompass the use of advanced algorithms, including Neural Networks and Deep Neural Networks. Despite their inherent complexity, these tools offer remarkable accuracy in results. However, this complexity also leads us to a crucial research question: How can we render these intricate models more interpretable and user-friendly for experts in the field? In conclusion, this introduction provides a foundation for our investigation into the transformative potential of AI and Deep Learning in the realm of tourism, particularly through the analysis of hotel reviews. By addressing these research questions, our study aims to make a substantial contribution to both the fields of tourism research and the practical application of AI technologies.
Deep Learning and tourism in literature
In the past several years, tourism has solidified its position as a central pillar within a nation’s economic structure. The appetite for travel and exploration has consistently risen. Yet, this sector has faced intermittent disturbances due to unpredictable influencers and unforeseen events. Scholars, industry specialists, and regulatory figures have extensively scrutinized the evolutionary patterns and consumption tendencies in tourism, aspiring to foresee subsequent tourist migrations. The majority of research endeavors focusing on tourism demand anticipations have predominantly concentrated on international travel movements. This inclination is primarily due to the more detailed nature of data on international tourism compared to domestic travel insights, with a limited number of investigations touching upon domestic tourism nuances. Precise prognostications become indispensable for locales where authorities seek to either harness the momentum in the tourism sector or maintain a harmonious equilibrium between environmental and societal demands. In such scenarios, those forecasting international tourist demand have endeavored to encompass overarching conditions of source markets, target locales, and even adjacent or rival territories that could sway their tourism influxes. The body of work concerning tourism demand prediction is substantial, as an initial overview suggests. A significant portion of these studies has been dedicated to anticipating international tourist movements using a myriad of quantitative techniques (Song et al., 2019), encompassing time series, econometric approaches, and Artificial Intelligence methodologies. Conventional time series frameworks, such as Naive 1 models, Naive 2 models, exponential smoothing techniques, and basic AR models (Song - Li, 2008; Wu, Song - Shen, 2017), frequently serve as reference points in tourism projection analyses. Depending on the temporal data’s periodicity, ARIMA and SARIMA configurations are predominantly employed. The literature has also explored several adaptations of the ARIMA structure. In contrast to non-causal time series configurations, econometric frameworks facilitate the exploration of correlations between tourism demand and its primary influencers, and such insights can be pivotal for policy guidance. Beyond the realm of time series and econometric techniques, a plethora of methodologies grounded in Artificial Intelligence have made their mark in tourism forecasting literature. Foremost among these is the Artificial Neural Network (ANN) paradigm. This model is structured around multiple tiers, with each potentially comprising several neurons. The ANN approach, inherently non-parametric and driven by data, is adept at modeling intricate nonlinear associations. It stands out as the most recurrently deployed AI-centric method in tourism demand prediction endeavors (Choi, Chan - Wu, 2018). Deep Learning strategies represent evolved versions of artificial neural networks, characterized by a dense web of interlinked processing strata. For example, Law, Li, Fong - Han (2019) harnessed Deep Learning, integrating an attention mechanism to architect a grand-scale neural network. However, these advanced models often face the problem of overfitting. With the swift progression of the tourism sector, the anticipation of tourism demand has ascended in importance for both governmental bodies and commercial entities. As highlighted by the United Nations World Tourism Organization (UNWTO), the ascent of international tourism consistently overshadows global economic growth, positioning the tourism industry as a pivotal catalyst for worldwide economic enhancement and progression. Consequently, the prediction of tourism demand has been under intensified scrutiny over recent years, particularly considering the fleeting essence of tourism offerings. Precise forecasting empowers industry participants to strategize proactively, optimizing resource distribution. Furthermore, enterprises can recalibrate their operational approaches to amplify their efficacy. In the pursuit of refining forecast precision, innovative methodologies are ceaselessly being cultivated in the domain of tourism demand prediction.
Deep Learning and ANN (Artificial Neural Network), a theoretical overview
Deep Learning
Deep Learning is a subcategory of Machine Learning and refers to the branch of artificial intelligence that uses algorithms inspired by the structure and function of the brain called artificial neural networks. Scientifically speaking, we could say that Deep Learning is the learning of systems through data learned using algorithms. Indeed, Deep Learning is a subset of the expansive Machine Learning spectrum, centered around the absorption and interpretation of data representations, rather than deploying algorithms tailored for distinct tasks. Applications of Deep Learning architectures extend to realms such as Computer Vision, automated speech recognition, natural language interpretation, audio detection, and bioinformatics (which entails the utilization of computational tools to quantitatively and statistically delineate specific biological events). Deep Learning can be characterized as a system that harnesses a cadre of machine learning techniques that:
Employ several tiers of interconnected non-linear units dedicated to executing tasks related to feature distillation and modification. Every subsequent layer draws upon the output from its predecessor as its input source. These algorithms span both supervised and unsupervised categories, with their applications encompassing pattern evaluation (under unsupervised learning) and categorization (within supervised learning).
Operate on the foundation of unsupervised learning across multiple stratified layers of data attributes (and their portrayals). Features at an elevated level are formulated from those at more foundational levels, culminating in a tiered representation. Belongs to the expansive category of representation learning algorithms nestled within the domain of Machine Learning.
Acquire various tiers of representation aligning with distinct abstraction degrees; these layers coalesce into a conceptual hierarchy. Through the implementation of Deep Learning, we secure a system that independently orchestrates data classification and hierarchical arrangement, pinpointing the most pertinent and beneficial data for problem resolution (mirroring human cognitive processes), and enhancing its efficacy through perpetual learning.
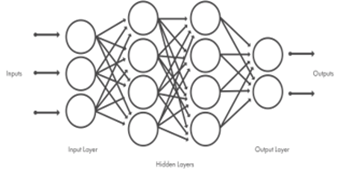
Figure 1: Neural networks, organized in layers that consist of a set of interconnected nodes.
The networks can contain tens or hundreds of hidden layers. (Deep Learning: Foundations and Concepts; Christopher M. Bishop, Hugh Bishop-2023). By integrating Deep Learning, we essentially equip ourselves with a “system” that possesses the capability to independently categorize and hierarchically organize data, discerning the most pertinent and advantageous information for issue resolution, and progressively enhancing its efficiency through ongoing learning. Much like the human brain employs its neurons to craft a reaction, tackle challenges, or infer a logical proposition, ultimately establishing our neural configurations. Deep Learning analogously employs artificial neural networks. Such systems are “malleable”, able to adapt their architecture (inclusive of nodes and interlinkages) contingent upon both external input and the intrinsic data traversing the neural network during the assimilation phase. Artificial neural networks are structured with multiple latent layers, often termed as hidden layers, encompassing a flexible count of nodes. Each node, or synthetic neuron, interlinks with others, bearing a specific weight and a designated threshold. Should the output from any distinct node surpass the set threshold magnitude, that node is triggered, forwarding data to the subsequent network tier. If not, the data remains stagnant, not progressing to the ensuing layer.
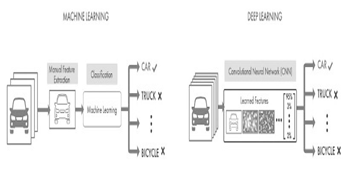
Figure 2: A comparison between a Machine Learning approach (on the left) and a Deep Learning approach (on the right) in vehicle categorization.
(Deep Learning: Foundations and Concepts; Christopher M. Bishop, Hugh Bishop-2023)
ANN - Artificial Neural Network
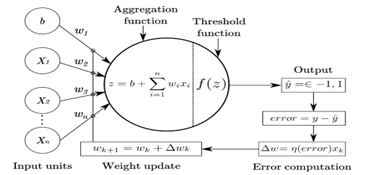
Artificial neural networks, as depicted in Figure 3 (Deep Learning: Foundations and Concepts; Christopher M. Bishop, Hugh Bishop - 2023), are mathematical constructs comprising synthetic neurons, designed in the vein of biological neural systems found in humans or animals. These networks are harnessed to address engineering challenges spanning multiple tech-centric domains like informatics, electronics, simulations, among other specializations. To delve deeper, neural networks can be elucidated as mathematical-digital frameworks mirroring the operations of organic neural systems. Essentially, these models revolve around intricate interlinkages of information. Such interlinkages spring from synthetic neurons and computation regimes grounded in the cognitive paradigm termed “connectionism”. This refers to the PDP – Parallel Distributed Processing approach to information handling: akin to how the human cortex processes sensory inputs concurrently and diffuses this data throughout the expansive network nodes. This is the crucial point underlying neural networks in the learning phase: a parameter, whether it’s the weight or the offset of the network, is varied to approach ever more accurate and precise prediction models. The set of weights and the offset value constitute the bias and represent precisely the information that the neuron learns during training and retains for subsequent reuses. The perceptron, although approaching this ideal concept, is not the best of artificial neurons, given that it is a binary classifier that therefore outputs 0 and 1: this detail is limiting because it will not allow us to observe a significant change in the model but only a variation due to the modification of the biases. The artificial neuron that best assimilates this behavior is instead the Sigmoid Neuron, represented in the same way as the perceptron, and which can therefore have up to n inputs (x1, x2..xn) with their respective weights (w1, w2..wn) and depends on the offset b; it has an output y, which can be applied again as input for other neurons on the network: the substantial difference from the perceptron is that the values that the inputs and outputs can assume are values that oscillate between 0 and 1. This will allow modeling of realistic systems.
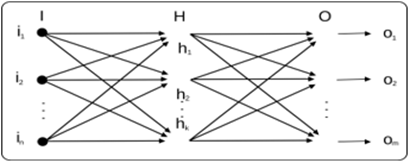
A neural network is therefore composed of an input layer and an output layer (Figure 4 - Deep Learning: Foundations and Concepts; Christopher M. Bishop, Hugh Bishop - 2023), which in the figure are the outermost layers, while the internal layers depend on the type of network implemented and determine the depth of the network.
Figure 3: Perceptron and potential activation functions.
The number of inputs depends on the purpose and implementation choices, while the output layer varies based on the number of output values of the model, and the presence of multiple output neurons can make the result more or less accurate. An output, in this structure, can be sent as input to the next layer, creating feed-forward networks as long as there are no cycles, so the information is always sent forward. If hypothetically we created cycles, we could speak of Recurrent Neural Networks (RNN), which are closer to human behavior but are less used in terms of application, computation, and results and will not be covered in this research.
Figure 4: RNN vs Feed Forward
Designing and training a neural network to simulate a prediction in the tourism field: an example based on hotel reviews.
Tourism, with its dynamic nature and constant evolution, stands today at the crossroads between tradition and innovation, where new digital technologies are reshaping how travel experiences are shared and perceived. In this vein, the current chapter aims to explore the intersection of artificial intelligence and the tourism sector, focusing on a specific application: the simulation of hotel rating predictions based on the analysis of reviews. Our analysis is rooted in the assumption that within the vast ocean of user-generated data lie valuable insights capable of transforming how the hospitality industry understands and meets its customers’ needs. To navigate these waters, we employ one of the most promising incarnations of AI: artificial neural networks, with their ability to learn from large volumes of data, present themselves as an invaluable tool for distilling knowledge from complex and not immediately apparent patterns. In particular, this chapter delves into the technical and methodological details governing the design, development, and training process of a deep learning model. Starting from the selection and acquisition of a representative dataset, we will dedicate ourselves to the art and science behind data cleaning and preparation, a fundamental step to ensure that the “nourishment” of our neural network is of the highest quality. Once the foundations are established, we will delve into the beating heart of the network, examining the model architecture in all its components: from the input layers, which act as an interface with the outside world, to the hidden layers, where the magic of learning occurs, to the output layer, which translates the network’s impulses into concrete and usable predictions. With a magnifying glass, we will scrutinize the evaluation metrics, discussing how accuracy, precision, and recall are not just numbers, but witnesses to how our model behaves in the real world, reflecting its ability to correctly interpret the subtle nuances hidden in human language. Simultaneously, we will not neglect the challenges and ethical implications of such an approach, aware that every technology brings with it responsibilities and questions to which we have to respond. Model transparency, data privacy, and the potential presence of bias are all aspects that we will address with the seriousness they deserve, outlining an ethical framework within which to take our steps. We will conclude the chapter by contemplating the future that awaits us, a future where neural networks and machine learning can provide not only predictions but also insights for increasingly personalized and attentive hospitality, inaugurating a new era for tourism and the traveler’s experience.
Dataset introduction
In the quest to harness the vast expanse of user-generated content within the hospitality industry, our study employs a comprehensive dataset derived from over 515,000 hotel reviews across Europe, meticulously compiled and made accessible for analysis. This rich corpus of text, sourced from a diverse array of hotels provide a fertile ground for applying advanced computational techniques to unravel patterns in customer sentiment and expectations. The foundation of our analytical framework is built upon a stack of sophisticated Python libraries, each chosen for its proven efficacy in data science and machine learning tasks. NumPy, a cornerstone for numerical computing, facilitates operations on large multi-dimensional arrays and matrices—a quintessential aspect of linear algebra required in our data processing endeavors. Pandas, renowned for its data manipulation capabilities, empowers us to seamlessly read, clean, and structure our CSV dataset into a form amenable to in-depth analysis. Visualization libraries such as Matplotlib, along with its patch’s module, provide the tools to graphically represent data, enabling the visualization of insights and patterns that might otherwise remain hidden in the raw textual data. To convert the textual data into a numerical format that is interpretable by machine learning algorithms, we employ the Tfidf Vectorizer and Count Vectorizer from the scikit learn library, which transform the text into feature vectors of term frequencies and inverse document frequencies, capturing the significance of words within the reviews relative to the entire dataset. Further dimensional reduction and noise filtering are achieved through the use of Truncated Singular Value.
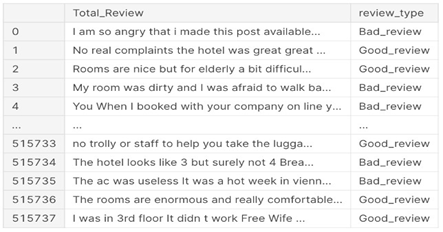
Figure 5: Dataset table
Decomposition (SVD), refining our feature set to the most expressive components. The tqdm library offers a smart progress meter, essential for monitoring lengthy operations over our large dataset. The Natural Language Toolkit (nltk), accompanied by its word tokenization and stop words capabilities, is instrumental in breaking down the text into tokens while filtering out common English words that offer little to no value in discerning unique textual features. To ensure robust predictive modeling, we incorporate machine learning algorithms such as Logistic Regression and the gradient boosting framework of XGBoost, along with their corresponding performance metrics—log loss, ROC AUC score, and accuracy score—to evaluate and iterate upon our models. The construction of our neural network architecture is facilitated by TensorFlow and Keras, where layers such as LSTM, GRU, and Bidirectional are orchestrated to process sequential data, capturing temporal dependencies within review texts. Dense, Dropout, and Batch Normalization layers are employed to avoid overfitting and to stabilize the learning process, while Convolutional layers, including GlobalMaxPooling1D and MaxPooling1D, excel in local feature extraction. With the inclusion of the TensorFlow Hub’s Universal Sentence Encoder, a cutting-edge model trained on a diverse range of text and capable of understanding multiple languages, we augment our model’s ability to comprehend the nuanced semantics embedded within the multilingual reviews. TensorFlow’s extensive ecosystem, including TensorFlow text for advanced text processing, provides us with a versatile and powerful toolkit to tackle the challenges of natural language understanding. As we venture further into the exploration of this dataset, we aim to not only predict hotel ratings but also uncover the underlying factors that influence customer satisfaction. The dataset acts as a portal through which we can peer into the collective experiences of travelers, drawing from their shared narratives to build a predictive model that is as informative as it is perceptive.
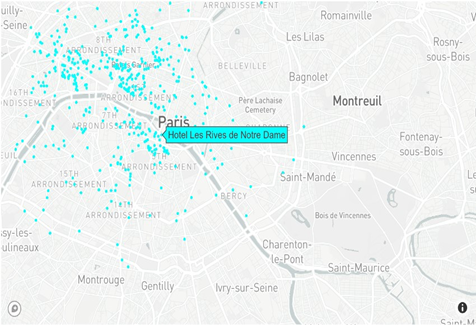
Figure 6: Drop off location of hotel.
To illustrate the geographical distribution of hotels within our dataset, we employ a sophisticated visualization technique that plots each hotel’s location on an interactive map. This is achieved through the integration of Python’s plotly library, renowned for its capability to create complex, interactive plots that are both informative and engaging. The first segment of the code defines a Scattermapbox trace, which is an object in plotly that represents a series of points on a map. Each point corresponds to a hotel, with its latitude and longitude derived from the data Data Frame columns ’lat’ and ’lng’, respectively. The hotels are displayed as markers, styled in cyan color with a slightly transparent appearance (an opacity of 0.7) for visual appeal and to prevent the map from appearing overly congested. In addition, each marker is associated with the hotel’s name, which is displayed as a hover text. This feature enhances user interactivity, as it allows the viewer to hover over any marker on the map to reveal the name of the hotel at that specific location. Finally, a Figure object is created, combining the data trace and layout. This object encapsulates all the information needed to render the map. The iplot function, which is part of the plotly interactive plotting interface, is called to display the figure. This command activates the visualization in a web browser, presenting an interactive and user-friendly map that allows stakeholders to visualize the spatial distribution of the hotel data effectively. By leveraging interactive geospatial plotting, we provide a compelling visual representation of data that can significantly enhance the comprehensibility of the patterns and trends within the tourism domain.
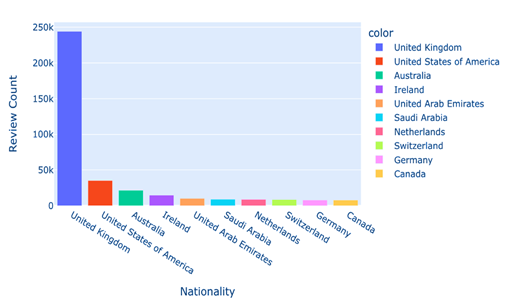
Figure 7: Top 10 Nationalities of Reviewer
In an effort to elucidate the demographic distribution of the reviewers in our hotel review dataset, we conducted an analysis focusing on the nationalities of the contributors. Understanding the diversity of the reviewers provides insight into the global reach of the hotels in question and can potentially highlight cultural influences on review content and ratings. The analysis commences with the extraction of the ’ReviewerNationality’ column from the dataset, applying the value-counts method to tally the frequency of each nationality present in the reviews. The dropna=False parameter ensures that even missing values are counted, preserving the integrity of our analysis. From this computation, we isolate the top ten most frequent nationalities, which represent the primary demographic of our dataset. Through this analysis and the resulting visualization, we can draw conclusions about the most active reviewer nationalities and speculate on the broader implications for the hospitality industry. Such insights are invaluable for hotel management and marketing strategies aiming to cater to a diverse international clientele.
Distribution Analysis of Reviewer Scores and Hotel Average Scores
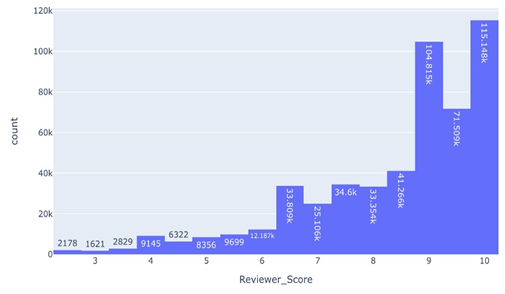
The first histogram we construct focuses on individual ’ReviewerScore’ data points, aiming to capture the essence of customer feedback in a single metric. We employ Plotly Express to generate a histogram that segments the entire range of review scores into 20 distinct bins. This granularity allows us to observe not only the commonality of certain score ranges but also to detect any patterns or anomalies, such as clustering or gaps within the score distribution. The command px.histogram(data, x=”ReviewerScore”, title=’Review Score Distribution’, nbins=20, textauto=True) constructs the histogram with automatic text labeling, providing immediate insight into the count within each bin. The title ’Review Score Distribution’ clearly denotes the chart’s intent, and the plot is displayed interactively in a web browser, enhancing the reader’s engagement with the data.
Figure 8: Review score Distribution.
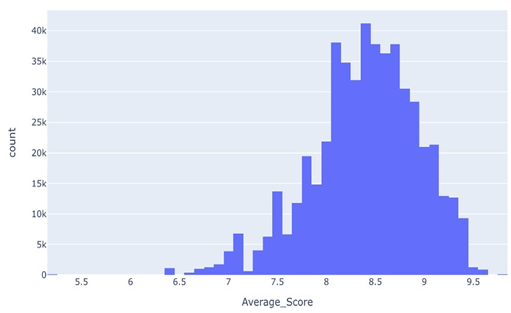
This second histogram serves a complementary purpose to the first: it provides a macroscopic view of hotel performance as perceived by the aggregate of customer reviews. The visualization allows stakeholders to identify general trends in customer satisfaction and to benchmark performance against a quantifiable metric. Both histograms are integral to our analysis, as they visually represent the core data upon which subsequent machine-learning models will be trained and evaluated. The interactive nature of the histograms, enabled by the fig. show () command, allows for an exploratory analysis.
Figure 9: Review Average score Distribution
Dataset preparation
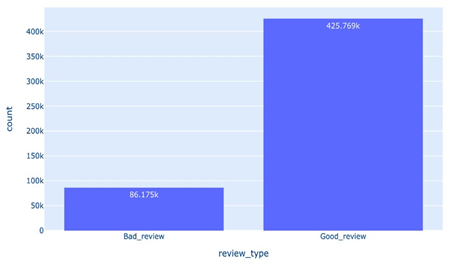
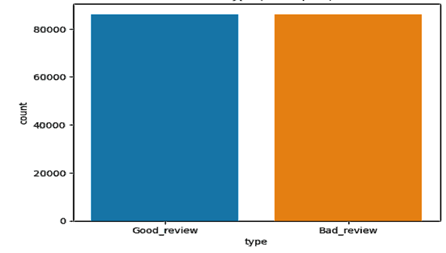
In the present study, we performed a sentiment analysis on a dataset of consumer reviews, intending to identify and compare the positive and negative perceptions expressed by users. The analysis process was carried out following the steps described below: First, we removed the placeholder strings ’No Positive’ and ’No Negative’ from the positive and negative review fields, respectively. This step is crucial to ensure that the analyzed texts reflect the reviewers’ true intentions. Next, we categorized the reviews into ’Goodreview’ or ’Badreview’ based on a score assigned by the reviewer. We considered reviews with a score of less than 7 as ’Badreview’ and those with a score of 7 or more as ’Goodreview’. As the class distributions were unbalanced, we proceeded with random sampling of the data to balance the number of ’Goodreviews’ with the number of ’Badreviews’. This allowed us to have a more balanced dataset for training the machine learning models.
Figure 10: Total and Type review
Figure 11: Type review
Figure 12: Balancing data review.
We encoded the review labels with a Label Encoder to facilitate processing by the machine learning algorithms. Finally, the dataset was divided into training and test sets to validate the effectiveness of the prediction model. Data preprocessing and class balancing are essential steps to ensure that machine learning models are not biased towards a dominant class. This paves the way for the application of advanced classification techniques, which will be analyzed in subsequent chapters.
Figure 13: Train and Test
Feature Engineering
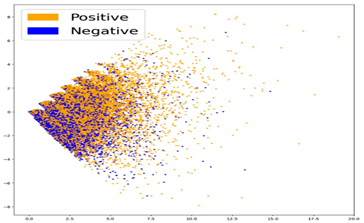
TF-IDF, short for term frequency-inverse document frequency, is a prevalent method in natural language processing (NLP) for converting text into numerical vectors suitable for machine learning models. This technique offers significant improvements over basic bag-of-words models, which simply tally term frequencies in documents. TF-IDF enhances the representation by adjusting the term frequencies based on their commonality across the entire text corpus. This adjustment diminishes the impact of frequently occurring words that might not contribute much to differentiating documents. Moreover, the inverse document frequency (IDF) component of TF-IDF emphasizes words that are distinct from specific documents, aiding in more effectively distinguishing between them. In essence, TF-IDF stands as an effective and popular approach for transforming textual information into numerical form for NLP applications. An LSA plot is a visualization tool in natural language processing (NLP) that illustrates the connections between documents and their associated topics. LSA, or Latent Semantic Analysis, is a method used for reducing the complexity of textual data in NLP. In such plots, each document is depicted as a point within a space that initially has as many dimensions as there are words or terms in the vocabulary. The LSA technique simplifies this space by uncovering the latent themes within the documents. This simplified, lower-dimensional space can then be displayed in a two or three-dimensional scatter plot. Here, each point represents a document, differentiated by color or label based on the topics it covers. LSA plots are beneficial for examining the interplay between documents and topics within a corpus, helping to spot clusters of similar documents. They’re also instrumental in tracing how topics have evolved by comparing LSA plots from different periods. While LSA effectively reduces text data to a more manageable form, it does have drawbacks. It assumes a bag-of-words model, ignoring word order, and may miss some nuanced meanings crucial for certain NLP tasks. Despite these limitations, LSA is still a common choice for dimensionality reduction and visualization in NLP.
Figure 14: Latent semantic analysis (LSA)
Deep Learning Model
The initial phase of our analysis involved preprocessing textual data, specifically customer reviews. We utilized the Universal Sentence Encoder (USE) to convert these reviews into high-dimensional vector embeddings. This process transforms each review into a dense representation, capturing its semantic meaning effectively. The transformation can be represented as:
where each review r is mapped to a vector in a continuous semantic space. The resulting embeddings for both training and test datasets are then reshaped and compiled into arrays, denoted as X train and X test , respectively. Our predictive model is constructed using TensorFlow’s Keras API, employing a sequential neural network architecture. The model is designed for binary classification and includes the following layers: A dense layer with 256 neurons and ReLU activation, processing the input embeddings. A dropout layer with a dropout rate of 0.25, to prevent overfitting. A second dense layer with 128 neurons, again using ReLU activation. Another dropout layer with the same dropout rate to further regularize the model. The output layer with a single neuron and sigmoid activation function, suitable for binary classification tasks. The model is compiled with a binary cross-entropy loss function, and the Adam optimizer with a learning rate of 0.001, an appropriate choice for this type of problem.
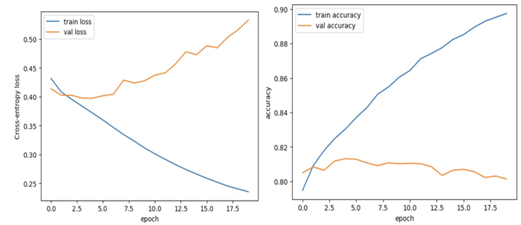
Figure 15: Training and Validation
The model undergoes training for 20 epochs with a batch size of 16, and a validation split of 20 is used. This validation split is crucial for monitoring the model’s performance and ensuring it does not overfit the training data. The training process involves shuffling the data for each epoch to maintain the randomness and independence of batches. Post-training, the model’s performance is evaluated on the test set. The evaluation metrics include loss and accuracy, which provide insights into the generalization ability of the model. The results are as follows:
(0.5371800661087036, 0.8009422421455383). Furthermore, the training and validation loss and accuracy are plotted against epochs. These plots are crucial for visualizing the model’s learning trajectory and identifying any signs of overfitting or underfitting.
Conclusion
The research presented in this paper aimed to develop a robust model for sentiment analysis, leveraging the capabilities of neural networks and natural language processing. Through the application of the Universal Sentence Encoder (USE), we transformed textual data - specifically, customer reviews - into dense vector representations. This approach enabled us to capture the nuanced semantic content of the text, providing a rich foundation for our predictive modeling. Our model, constructed using TensorFlow’s Keras API, represents a sequential neural network specifically tailored for binary classification tasks. The architecture, comprising dense layers interspersed with dropout layers, was strategically designed to balance complexity and generalizability. The dense layers, equipped with ReLU activation functions, were pivotal in capturing the non-linear relationships within the data. In contrast, the dropout layers played a critical role in mitigating overfitting, a common pitfall in deep learning models. The training process, conducted over 20 epochs with a batch size of 16, was carefully monitored using a validation split. This approach not only provided insights into the model’s learning trajectory but also ensured that our model generalized well to unseen data, rather than merely memorizing the training dataset. The shuffle mechanism in the training process further contributed to the robustness of the model by preventing any order-specific biases in the learning process. Upon evaluation, the model demonstrated promising results, as indicated by the test loss and accuracy metrics. These metrics not only reflect the model’s performance in terms of prediction accuracy but also its ability to generalize to new, unseen data - a crucial aspect of any predictive model. However, it is important to acknowledge that these results are preliminary and subject to the limitations of the dataset and experimental setup. The graphical analysis of training and validation losses and accuracies provided additional layers of insight. The trends observed in these plots are critical in diagnosing issues such as overfitting or underfitting and in understanding the learning dynamics of the model across epochs. They also serve as a visual affirmation of the model’s learning stability and convergence behavior. This research contributes to the burgeoning field of sentiment analysis by demonstrating the effectiveness of dense neural networks in handling complex, high-dimensional data derived from natural language. The successful application of the Universal Sentence Encoder in transforming textual data into a format amenable for neural network processing underscores the synergy between state-of-the-art NLP techniques and neural network architectures. However, this study is not without its limitations. The scope of the data and the specific architecture of the neural network model present avenues for further exploration. Future work could involve experimenting with different neural network architectures, such as recurrent neural networks or transformers, which might be more adept at capturing sequential dependencies in text. In addition, investigating the effects of different embedding techniques, or incorporating additional features, could provide more comprehensive insights. Moreover, the application of the model to a more diverse set of data sources would enhance its robustness and applicability to real-world scenarios. In conclusion, our research marks a significant step in sentiment analysis, providing a framework that can be built upon and refined in future studies. The integration of advanced NLP techniques with neural networks holds great promise for the field, and continued exploration in this domain is essential for the development of more sophisticated and nuanced sentiment analysis tools.
References
- Aggarwal, C. C., Zhai, C. (2012). Mining Text Data. Springer.
Publisher | Google Scholor - Bishop, C. M. (2006). Pattern Recognition and Machine Learning. Springer.
Publisher | Google Scholor - Chollet, F. (2017). Deep Learning with Python. Manning Publications.
Publisher | Google Scholor - Goodfellow, I., Bengio, Y., Courville, A. (2016). Deep Learning. MIT Press.
Publisher | Google Scholor - James, G., Witten, D., Hastie, T., Tibshirani, R. (2013). An Introduction to Statistical Learning: with Applications in R. Springer.
Publisher | Google Scholor - Jordan, M. I., Mitchell, T. M. (2015). Machine learning: Trends, perspectives, andprospects. Science, 349(6245):255-260.
Publisher | Google Scholor - LeCun, Y., Bengio, Y., Hinton, G. (2015). Deep learning. Nature, 521(7553):436444.
Publisher | Google Scholor - Liu, B. (2012). Sentiment Analysis and Opinion Mining. Morgan Claypool Publishers.
Publisher | Google Scholor - Murphy, K. P. (2012). Machine Learning: A Probabilistic Perspective. The MIT Press.
Publisher | Google Scholor - Pang, B., Lee, L. (2008). Opinion Mining and Sentiment Analysis. Now Publishers.
Publisher | Google Scholor - Russell, S., Norvig, P. (2010). Artificial Intelligence: A Modern Approach. PrenticeHall.
Publisher | Google Scholor - Tibshirani, R., Friedman, J. (2009). The Elements of Statistical Learning: DataMining, Inference, and Prediction. Springer.
Publisher | Google Scholor

