Research Article
Convolutional Neural Networks in Dermatology: Skin Cancer Detection and Analysis
The University of Burdwan, West Bengal, 713104, India.
*Corresponding Author: Manoj Ganthya, The University of Burdwan, West Bengal, 713104, India.
Citation: Manoj Ganthya. (2024). Convolutional Neural Networks in Dermatology: Skin Cancer Detection and Analysis. Journal of Cancer Management and Research, BioRes Scientia publishers. 2(2):1-14. DOI: 10.59657/2996-4563.brs.24.017
Copyright: © 2024 Manoj Ganthya, this is an open-access article distributed under the terms of the Creative Commons Attribution License, which permits unrestricted use, distribution, and reproduction in any medium, provided the original author and source are credited.
Received: September 02, 2024 | Accepted: November 11, 2024 | Published: November 18, 2024
Abstract
The application of Convolutional Neural Networks (CNNs) in the automated detection and classification of skin cancer has been investigated to give a non-invasive and reliable alternative to the traditional diagnostic methods, including visual examination and biopsies. An in-depth overview of CNN architecture, covering key components such as convolutional layers, pooling layers, activation functions, and the back propagation algorithm has been presented. Moreover, critical aspects of dataset preparation, including image pre- processing, augmentation techniques, and the use of large, annotated datasets to enhance model performance have been addressed.
Keywords: skin cancer detection; convolution neural network; neural network architecture; image classification
Introduction
Deep Learning, a subset of machine learning inspired by the structure and function of the human brain, has transformed the landscape of artificial intelligence (AI) over the past few decades [1,2,3]. The concept of artificial neural networks, which are the backbone of deep learning, dates back to the 1940s and 50s with early attempts to mimic brain functions. However, it was not until the 1980s that significant progress was made, particularly with the introduction of backpropagation, a method for training multi-layer networks.
The 2000s saw deep learning gain momentum with the advent of more sophisticated architectures such as convolutional neural networks(CNNs) for image processing and recurrent neural networks (RNNs)for sequential data. These innovations, coupled with the rise of powerful computing resources like GPUs, allowed for the training of deeper and more complex networks on large datasets.
A pivotal moment came in 2012 with the success of Alex Net in the ImageNet competition, showcasing the potential of deep learning in achieving unprecedented accuracy in image recognition tasks. This breakthrough spurred a surge in research and applications across various domains, from natural language processing to autonomous vehicles.
In recent years, the field has been revolutionized by the development of advanced architectures like transformers, which have set new benchmarks in tasks such as language translation and text generation. Deep learning continues to evolve, driving significant advancements in AI and reshaping industries with its ability to process and learn from vast amounts of data.
Brief explanation of CNN
Convolutional Neural Networks (CNNs) are a class of deep learning models that are particularly effective for analyzing visual data. They have revolutionized the field of computer vision, enabling advancements in image recognition, object detection, and more. Let's delve into the basics of CNNs, their history, and their key components.
Basic Concept of CNNs
CNNs are designed to automatically and adaptively learn spatial hierarchies of features from input images. They mimic the way humans perceive images, focusing on the spatial relationships among pixels.
Key Components of CNNs
Convolutional Layers: These layers apply filters to the input image to create feature maps. The filters, or kernels, slide over the image, detecting features such as edges, textures, and patterns.
Activation Functions: Non-linear functions like Re LU (Rectified Linear Unit) are applied to the feature maps to introduce non-linearity, allowing the network to learn complex patterns.
Pooling Layers: These layers reduce the spatial dimensions of the feature maps, retaining important information while decreasing computational complexity. Common pooling techniques include max pooling and average pooling.
Fully Connected Layers: After several convolutional and pooling layers, the final feature maps are flattened and passed through fully connected layers to make predictions or classifications.
Output Layer: This layer generates the final predictions, often using soft max for classification tasks.
History of CNNs
Early Concepts and Development (1980s-1990s):
The concept of CNNs dates back to the 1980s when Kunihiko Fukushima developed the Neocognitron, a neural network inspired by the visual cortex. It introduced the idea of using hierarchical layers to detect increasingly complex features. In the late 1980s and early 1990s, Yann Le Cun and his colleagues at AT&T Bell Labs made significant contributions by developing the first practical CNN, known as Le Net, which was used for digit recognition tasks such as reading handwritten digits on checks.
The Emergence of Modern CNNs (2000s)
The early 2000s saw limited success for CNNs due to computational constraints and limited availability of large datasets. However, researchers continued to refine the architecture and techniques. In 2006, Geoffrey Hinton's work on deep learning and unsupervised pre-training brought renewed interest in neural networks, setting the stage for more complex models.
Breakthrough with Alex Net (2012)
A major breakthrough came in 2012 when Alex Krizhevsky, Ilya Sutskever, and Geoffrey Hinton introduced Alex Net, a deep CNN that dramatically improved performance in the ImageNet Large Scale Visual Recognition Challenge. Alex Net significantly outperformed traditional methods in image classification, demonstrating the power of deep CNNs with large datasets and powerful GPUs.
Continued Advancements (2010s-Present)
Following Alex Net's success, deeper and more complex CNN architectures emerged, such as VGG Net, Google Net (Inception), and Res Net. These models pushed the boundaries of what CNNs could achieve, setting new benchmarks in various computer vision tasks. CNNs have since been widely adopted in numerous applications, including medical imaging, autonomous driving, facial recognition, and more.
Application of CNN
Convolutional Neural Networks (CNNs) have become indispensable tools in the field of artificial intelligence, particularly due to their ability to handle large-scale data and learn hierarchical features. They have made significant contributions across various domains, extending beyond their initial application in computer vision. Below, we explore the importance of CNNs in several key fields.
Computer Vision
Image Classification
CNNs have set new benchmarks in identifying objects and features within images. Models like Alex Net, VGG Net, and Res Net have excelled in competitions like ImageNet, showcasing their ability to classify images with high accuracy.
Object Detection
CNNs power systems like YOLO (You Only Look Once) and R-CNN (Region-based Convolutional Neural Networks), which can detect and localize objects in real-time. These technologies are crucial in applications ranging from security surveillance to autonomous driving.
Image Segmentation
CNNs enable precise segmentation of images, allowing for tasks such as medical image analysis where accurate delineation of structures is essential. Models like U-Net have proven effective in segmenting complex medical images, aiding in disease diagnosis and treatment planning.
Applications
Medical Imaging: Detecting anomalies like tumors in MRI scans, facilitating early diagnosis and treatment.
Autonomous Vehicles
Enabling vehicles to recognize and navigate around obstacles, pedestrians, and other vehicles.
Natural Language Processing (NLP)
Text Classification: CNNs can process text data for tasks like sentiment analysis, spam detection, and document classification by treating text sequences similarly to one-dimensional images. They can capture local correlations in text through convolutional operations.
Named Entity Recognition: CNNs help in identifying entities such as names, locations, and dates within text, crucial for information extraction and knowledge management.
Sentence Modeling: CNNs can effectively model sentences for tasks such as language translation and text summarization by capturing the hierarchical nature of linguistic features.
Applications
Spam Detection
Identifying spam emails by analyzing the textual content.
Customer Support
Classifying and routing customer inquiries to appropriate departments based on content.
Healthcare
Medical Image Analysis: CNNs are used for detecting and diagnosing diseases from medical images, including X-rays, MRIs, and CT scans. They can identify patterns and anomalies that might be missed by human experts.
Genomics
CNNs analyze DNA sequences to identify genetic markers associated with diseases, facilitating personalized medicine.
Applications
Disease Detection: Identifying diseases like cancer or pneumonia from radiographic images with high accuracy.
Drug Discovery
Analyzing biological data to discover new drugs and predict their efficacy.
Robotics
Object Recognition
CNNs enable robots to identify and interact with objects in their environment, essential for tasks like assembly line work and autonomous navigation.
Motion Analysis
CNNs help in analyzing and predicting the movements of robots, improving their ability to perform complex tasks autonomously.
Applications
Manufacturing: Robots using CNNs to inspect products for defects and ensure quality control.
Autonomous Navigation
Enabling drones and robots to navigate through complex environments by recognizing obstacles and planning paths.
Understanding CNN
Basic architecture of CNN
The basic architecture of a CNN consists of several key layers, each serving a specific function to progressively extract and learn features from the input data. Here's an overview of the fundamental components of a CNN
Input Layer
The input layer receives the raw data, typically in the form of an image represented by a matrix of pixel values. For instance, a grayscale image is represented by a 2D matrix, while a color image is represented by a 3D matrix with dimensions corresponding to width, height, and color channels (e.g., RGB).
Example:
For a 28x28 grayscale image, the input layer would be a matrix of size 28x28.
Convolutional Layer
A Convolutional Layer is a fundamental building block of CNNs. It performs a convolution operation, which is a specialized kind of linear operation. Convolutional layers are primarily used for feature extraction from input data, such as images, by applying convolutional filters (kernels) to the input.
Filters/Kernels
Kernels are fundamental for feature extraction in CNNs. Each kernel learns to detect specific features from the input data.
Here the green matrix is the input image, where we apply kernel which is moving over matrix to learn the different features of the original image. The kernel firstly move over x-axis, then shift down and again mover over x-axis. The sum of the dot product of the image pixel value gives the output matrix.
If a m x m image convolved with n x n kernel, the output image is of size (m - n + 1) x (m - n + 1).
Standard Type of Kernels/Filters
We can use any matrix as a Kernels in CNNs. In CNNs, basically we follow some standard kernel for optimize output.
Identity Kernel
This Kernel does not alter the image, it often used as a starting padding.
0 0 0
(0 1 0)
0 0 0
Edge Detection Kernels
These kernels are used to highlight edge in images.
Sobel Kernel
−1 0 1
(−2 0 2)
−1 0 1
Prewitt Kernel
−1 0 1
(−1 0 1)
−1 0 1
Laplacian Kernel
0 −1 0
(−1 6 −1)
0 −1 0
Blurring Kernels
These kernels are used to smooth out the image, reducing noise and details.
| Box Blur Kernel | 1/9 1/9 1/9 (1/9 1/9 1/9) 1/9 1/9 1/9 |
| Gaussian Blur Kernel | 1/16 2/16 1/16 (2/16 4/16 2/16) 1/16 2/16 1/16 |
Emboss Kernel
This kernel gives a 3D shading effect.
-2 -1 0
(-1 1 1)
0 1 2
Small matrices(e.g., 3x3 or 5x5) that detect local patterns such as edges, textures, and shapes.
Padding
Padding refers to the practice of adding extra pixels to the borders of an input image before applying the convolution operation. Basically, we face two problems without padding
Problem 1: In image classification task, we need to apply multiple time convolution. If m x m is original image with n x n kernel, then our output matrix will be m - n + 1, m - n + 1. So, after multiple convolutions, our original image will much small.
Problem 2: When kernel moves over original matrix, it touch the edge less than middle part of image. So, the corner features of any image or edges are not use much in the output.
To fixed, this problem we introduce Padding to preserve the size of original image with essential features. So, if m x m original matrix with n x n kernel with p padding, then output will be (m + 2p – n +1) x (m + 2p – n +1) matrix.
Stride
Stride is the number of pixels shifts over the input matrix. Stride affects the spatial dimensions of the output feature maps and the computational efficiency of the network. When the stride is set to 1, the kernel moves one pixel at a time. This results in overlapping applications of the kernel and produces an output feature map with the maximum possible spatial dimensions. When the stride is set to a value greater than 1, the kernel moves by that many pixels at a time. This reduces the spatial dimensions of the output feature map and increases computational efficiency, but it may result in loss of spatial detail.
For padding p, input image m x m, kernel n x n, with stride s, then output matrix will be (m+2p-n + s1) x (m+2p-n + 1)s
Activation Function
In Convolutional Neural Networks (CNNs),an activation function is a crucial component that introduces non- linearity into the network. This allows the network to learn and model complex patterns. The activation function decides whether a neuron should be activated or not by calculating the weighted sum and further adding bias to it. The purpose of the activation function is to introduce non-linearity into output of a neuron.
A neural network without a function is essentially just a linear regression model. The activation function does the non-linear transformation to the input making it capable to learn and perform more complex tasks.
Most Useful Activation Function are
Sigmoid Function
Tanh
ReLU
SoftMax
Linear vs. Non-Linear Functions
Linear Functions
A linear function is of the form f(x) = ax + b, which can only capture linear relationships between inputs and outputs. If all layers in a neural network were linear, the entire network could be reduced to a single linear transformation. No matter how many layers we stack, the final transformation would still be linear. This limitation severely restricts the ability of the network to model complex patterns in the data.
Non-Liner Functions
Non-linear functions can capture a wide range of behaviors and relationships that linear functions cannot. Examples of non-linear functions include polynomials, exponential functions, and trigonometric functions. Non- linearity allows the network to create complex mappings from inputs to outputs, enabling it to learn and model intricate patterns in data. Importunacy of Non-Linear Function in CNNs are
Non-linear activation functions allow neural networks to approximate any continuous function. This is known as the Universal Approximation Therefore, which states that a neural network with at least one hidden layer and a non-linear activation function can approximate any continuous function to any desired accuracy given sufficient neurons.
In CNNs, stacking layers helps in creating hierarchical feature representations. Early layers might detect simple features like edges and textures, while deeper layers can capture more complex features like shapes and objects. Non-linearity between these layers allows each layer to build upon the previous one in a meaningful way.
Sigmoid Function
The sigmoid function is a type of activation function that maps any real-valued number into a range between 0 and 1. It is a function which is plotted as ‘S’ shaped graph. This is express by 1
σ = 1 + e-x
Properties
Domain: (-∞, +∞)
Range: (0, 1)
Continuous, Differentiable, monotonically increasing everywhere.
The sigmoid function is commonly used in the output layer of a binary classification model, as its output range is [0, 1], which can be interpreted as a probability. A threshold (e.g.,0.5) is often used to decide the class label (1 if the value is greater than 0.5, otherwise 0). It is derivative 
Tanh Function
The hyperbolic tangent (tanh) function is another activation function that maps any real-valued number into a range between -1 and 1. This express by tanh x = x-x
e-e
ex + e-x
Properties
Domain: (−∞, +∞)
Range: (−1, +1)
Continuous: The function is continuous everywhere.
Differentiable: The function is differentiable.
Zero-Centered: Unlike the sigmoid function, the tanh function is zero-centered, which can help with faster convergence. Zero-centered means that the activation function's output values range symmetrically around zero. For the tanh function, the range is (−1, +1) with a mean value of 0.
It’s derivative () = 1 - tanh2 (x)
ReLU Function
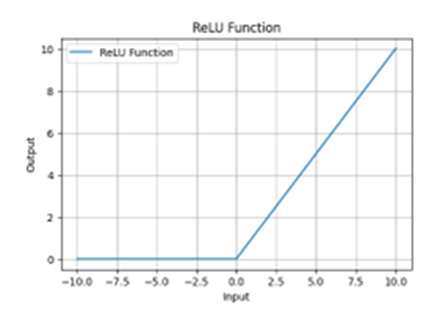
The Rectified Linear Unit (ReLU) is an activation function that outputs the input directly if it is positive, otherwise, it outputs zero. This express by
This express by ReLU(x) = max (0, x)
Properties Domain: (−∞, +∞) Range: [0, +∞)
Continuous: The function is continuous but not differentiable at
Non-Saturating: Unlike sigmoid and tanh, ReLU does not saturate for positive values, which helps mitigate the vanishing gradient problem.
Softmax Function
The softmax function is an activation function used in the output layer of a neural network for multi-class classification problems. This express by softmax(xi) = e(xi)/(x) ∑j e j

i=1 c=1
Where N is the number of samples, C is the number of classes, yic is the binary indicator (o or 1), yic is the predicted probability that sample i belong to class c.
Mean Squared Error (MSE)

Niii=1
Where N is the number of samples, yi is the true value for the i-th sample, yi is the predicted value for i-th sample.
Binary Cross-Entropy Loss

i=1
Where N is the number of samples, C is the number of classes, yic is the binary indicator (0 or 1), yic is the predicated probability that sample i belong to class C.
Categorical Cross-Entropy

i=1 c=1
Where N is the number of samples, C is the number of classes, yic is the binary indicator is the (0 or 1), y predicated probability that samples i-th belong to class C.
Backpropagation
The purpose of backpropagation is to update the weights of the network to minimize the loss function. It adjusts the parameters of the network based on the error between the predicted output and the actual target. Compute the loss (error) using a loss function. Then we apply backward pass, Compute the gradient of the loss with respect to the output of the network. Propagate the gradient back through the fully connected layers, updating the weights and biases using gradient descent. Pass the gradient through the pooling layers. In the case of max pooling, the gradient is routed to the location that had the maximum value in the forward pass. the gradient of the loss with respect to the filters and the input feature maps. Update the filters (weights) using gradient descent. The gradients are passed through the activation functions using the chain rule. For functions like ReLU, this involves simple operations, while for sigmoid or tanh, it involves computing derivatives. Adjust the weights and biases of the network using the computed gradients. This is typically done using an optimization algorithm like stochastic gra- dient descent (SGD), Adam, or RMSprop.
Iteration
The entire process of forward propagation, loss calculation, and backpropagation is repeated for many epochs (iterations over the training dataset) until the model converges to a solution (i.e., the loss is minimized).
3- Skin Cancer Classification Using CNN
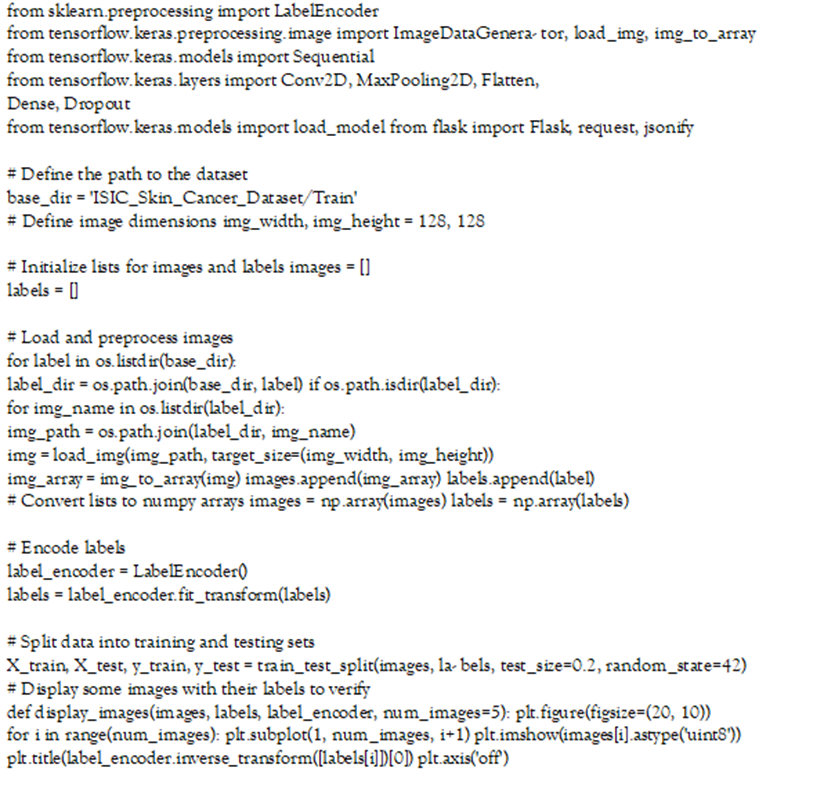
Skin Cancer Claasification project is an exciting exploration into developing a Convolutional Neural Network (CNN) model designed to classify various types of skin cancer from images. To assist medical professionals by providing an accurate, automated tool that aids in the early detection and diagnosis of skin cancer, potentially saving lives through early intervention.
Objective of the Project
Skin cancer is one of the most common types of cancer, but early detection significantly improves the chances of successful treatment. However, identifying the type of skin cancer can be challenging even for experienced dermatologists. Our objective is to create a CNN model that can reliably classify skin cancer images into distinct categories, providing a valuable second opinion that can enhance diagnostic accuracy and speed.
Dataset Used for Training and Testing
For this ambitious endeavor, we used the International Skin Imaging Collaboration (ISIC) dataset. This com- prehensive dataset comprises thousands of dermatoscopic images representing common pigmented skin lesions, including:
Actinic Keratosis
Basal Cell Carcinoma
Dermatofibroma
Melanoma
Nevus
Pigmented Benign Keratosis
Seborrheic Keratosis
Squamous Cell Carcinoma
Vascular Lesion
We divided the dataset into training and testing sets, ensuring our model was trained on a wide variety of images and evaluated rigorously to assess its performance.
Architecture of the CNN Model Implemented
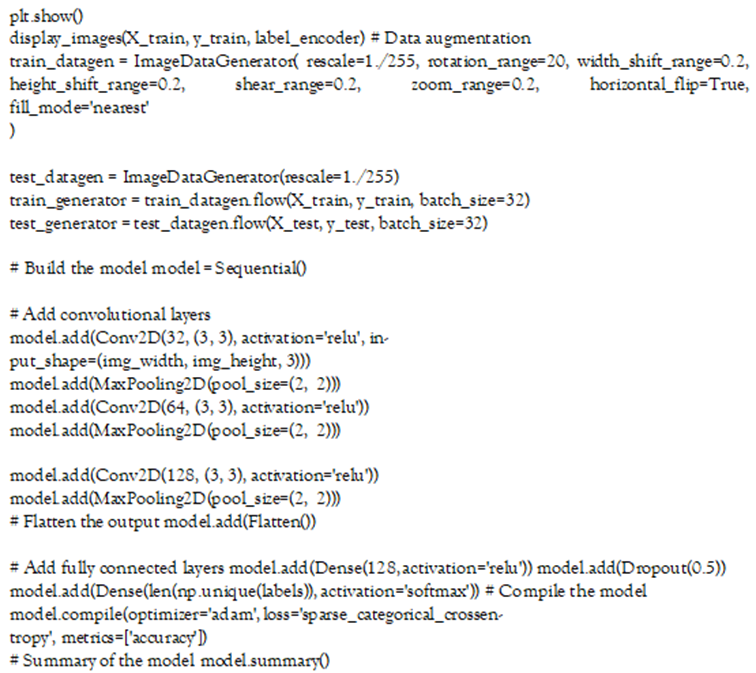
Our CNN model is a carefully crafted network designed to extract and learn from the complex patterns within skin lesion images. Here's a closer look at its architecture:
Input Layer: The model starts by accepting images of size 128x128x3 (height, width, and color channels). Convolutio99nal Layers:
The first Conv2D layer uses 32 filters with a 3x3 kernel size and ReLU activation to detect edges and textures.
A MaxPooling2D layer follows, reducing the spatial dimensions and emphasizing the most critical features.
The second Conv2D layer expands to 64 filters, deepening the network’s understanding of the image.
Another MaxPooling2D layer to consolidate learning.
The third Conv2D layer, with 128 filters, captures even more detailed patterns.
A final MaxPooling2D layer further distills the feature maps.
Flatten Layer: This layer transforms the 3D feature maps into a 1D vector, making it suitable for dense layers.
Dense Layers: A Dense layer with 128 units and ReLU activation processes the combined features. A Dropout layer with a rate of 0.5 helps prevent overfitting by randomly disabling neurons during training. The output layer is a Dense layer with 9 units (one for each class), using softmax activation to produce probabilities for each class.
Results Achieved
| Layer (Type) | OutputShape | Param |
| Conv2d | (None, 126, 126, 32) | 896 |
| Max_pooling2d | (None, 63, 63, 63) | 0 |
| Conv2d_1 | (None, 61, 61, 64) | 18,496 |
| Max_pooling2d_1 | (None, 30, 30, 64) | 0 |
| Conv2d_2 | (None, 28, 28, 128) | 73,856 |
| Max_pooling2d_2 | (None, 14, 14, 128) | 0 |
| Flatten | (None, 25088) | 0 |
| Dense | (None, 128) | 3,211,392 |
| Dropout | (None, 128) | 0 |
| Dense_1 | (None, 9) | 1,161 |
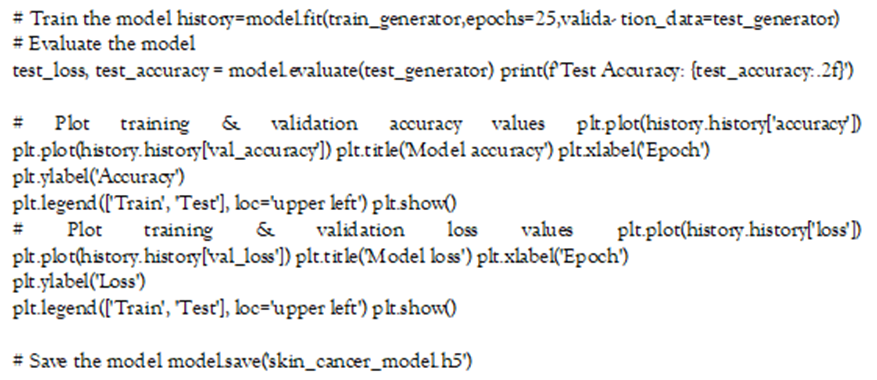
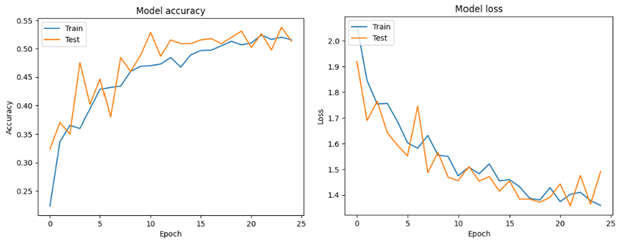
After training our model for 25 epochs, we evaluated its performance on the test dataset using accuracy and loss as key metrics. Here’s a summary of our findings:
| Accuracy | Loss | |
| Training | 48.96% | 1.38 |
| Validation | 51.34% | 1.49 |
| Test | 47.35% | 1.57 |
These results,while promising, indicate that there is room for improvement. By experimenting with more advanced architectures, fine-tuning hyperparameters, and employing data augmentation techniques, we believe the model's accuracy can be significantly enhanced.
Conclusion
In this project, we have taken discussed of deep learning to aid in the early detection and classification of skin cancer. The CNN model, trained on the extensive ISIC dataset, showcases the potential of AI in medical diagnostics. While journey is ongoing, and there are challenges to overcome, the progress made thus far is encouraging. With further refinement, this technology could become an invaluable tool in the fight against skin cancer, ultimately saving lives through timely and accurate diagnosis.
References
- Goodfellow I, Bengio Y & Courville A. (2016). Deep Learning. MIT Press.
Publisher | Google Scholor - LeCun Y, Bengio Y & Hinton G. (2015). Deep learning. Nature, 521(7553):436-444.
Publisher | Google Scholor - Krizhevsky A, Sutskever I & Hinton G. E. (2012). Imagenet classification with deep convolutional neural networks. Advances in Neural Information Processing Systems, 25:1097-1105.
Publisher | Google Scholor

