
Research Article
Shear Wave Elastography as a new Imaging predictor for difficult laparoscopic Cholecystectomy
1 Department of Radiology, Advanced Diagnostics and Institute of Imaging, Amritsar, India.
2 Departments of Surgery, Parwati Hospital, Sukh Sagar Hospital. Amritsar, India.
*Corresponding Author: Atul Kapoor, Department of Radiology, Advanced Diagnostics and Institute of Imaging, Amritsar, India.
Citation: Kapoor A., Bholla S. Sidhu, Singh J. (2026). Shear Wave Elastography as a new Imaging predictor for Difficult laparoscopic Cholecystectomy, Journal of Surgical Case Reports and Reviews, BioRes Scientia Publishers. 5(1):1-7. DOI: 10.59657/2993-1126.brs.26.036
Copyright: © 2026 Atul Kapoor, this is an open-access article distributed under the terms of the Creative Commons Attribution License, which permits unrestricted use, distribution, and reproduction in any medium, provided the original author and source are credited.
Received: April 10, 2026 | Accepted: July 20, 2026 | Published: August 03, 2026
Abstract
Background: Laparoscopic cholecystectomy is a common surgical procedure for gallbladder removal. Preoperative imaging, particularly ultrasound, is routinely used to assess gallbladder pathology and predict surgical difficulty.
Aim: This study aimed to evaluate the efficacy of shear wave elastography in predicting the difficulty of laparoscopic cholecystectomy and compare the results with routine ultrasound predictors, including gallbladder wall thickness, cystic duct length, and gallbladder distension.
Methods: A prospective study was conducted on 146 patients with cholelithiasis and/or chronic cholecystitis who underwent abdominal ultrasound examinations and subsequent laparoscopic cholecystectomy. Patients were categorized into three groups based on imaging findings and surgical difficulty.
Results: Statistical analysis revealed significant differences in wall thickness and adhesion among the patient groups, with adhesions showing the best predictive performance (81.6% accuracy) compared to wall thickness and cystic length. Tukey's post hoc analysis showed significant differences in wall thickness between Groups A vs. C and B vs. C, and in adhesion across all group comparisons. The total score, combining multiple factors, demonstrated excellent predictive ability with an accuracy of 97.3%.
Conclusion: These findings highlight the importance of considering both wall thickness and adhesion in the clinical assessment of cholelithiasis and suggest that adhesions should be prioritized as a key predictor when assessing surgical difficulty. The study provides novel insights into the independent nature of wall thickness and adhesion in patients with cholelithiasis and introduces a novel approach using confusion matrices to compare the predictive reliability of different surgical difficulty measures.
Key Points
The study assessed the effectiveness of shear wave elastography in predicting the complexity of laparoscopic cholecystectomy procedures, juxtaposing its performance with conventional ultrasound predictors.
An analysis encompassing 146 subjects revealed statistically significant variations in wall thickness and adhesions across different groups, with adhesions demonstrating superior predictive capability (81.6% accuracy).
Contrary to previous assumptions, wall thickness exhibited lower reliability as a predictor.
The composite PLAS score, which incorporated multiple factors, displayed exceptional predictive accuracy (97.3%).
This research underscores the importance of prioritizing adhesions as a primary indicator of surgical complexity and introduces an innovative methodology utilizing confusion matrices to comparatively evaluate the predictive reliability of diverse measures.
Keywords: shear wave elastography; laparoscopic cholecystectomy; gallbladder wall thickness; cystic duct length; gallbladder distension; adhesions; ultrasound predictors
Background
Laparoscopic cholecystectomy is a commonly performed procedure for gallbladder removal. Current imaging techniques such as ultrasound are routinely used to evaluate gallbladder pathology prior to surgery. However, the accuracy and reliability of ultrasound alone for predicting difficult laparoscopic cholecystectomy remains uncertain. Ultrasound predicts difficult laparoscopic cholecystectomy based on several key findings: Gallbladder wall thickening >3-5mm, pericholecystic fluid collection, and difficulty identifying anatomical structures due to severe inflammation are significant ultrasound predictors of difficult LC [1-3]. Additionally, a contracted or distended gallbladder, structural anomalies, and the presence of a cirrhotic liver on ultrasonography can indicate potential difficulties [1]. Specific ultrasound findings like irregular or absent gallbladder wall, fat hyperdensity, and hydrops are also associated with difficult LC [4]. Interestingly, while most studies have focused on gallbladder-specific findings, one study found that the common bile duct diameter was also a significant predictor of operative difficulty [5]. However, it is important to note that ultrasonography is not the sole predictor of difficult LC. Other factors, such as patient demographics, clinical history, and laboratory data, also play a crucial role [6,7]. In conclusion, preopera-tive ultrasound examination is valuable for predicting LC difficulties, with gallbladder wall thickness being a particularly strong predictor [7]. However, for comprehensive assessment, ultrasound findings should be combined with other clinical and laboratory parameters to develop scoring systems that can more accurately predict difficult LC [8]. Such predictive models can help in proper patient counselling and surgical planning, and potentially reduce conversion rates to open cholecystectomy. There is a need to add new techniques to enhance the predictive value of ultrasound can improve surgical outcomes and reduce intraoperative complications. Therefore, we evaluated shear wave along with routine ultrasonography to determine whether preoperative ultrasound effectively predicts difficult laparoscopic cholecystectomy.
Aim/Objective
This study aimed to evaluate the efficacy of Shear wave elastography in predicting the difficulty of laparoscopic cholecystectomy and to compare the results with routine ultrasound predictors of gall bladder wall thickness, cystic duct length, and gall bladder distension.
Methods
A study was conducted on 146 potential patients with cholelithiasis and/or chronic cholecystitis who presented with symptoms of upper abdominal discomfort, indigestion, and emesis. These individuals underwent abdominal ultrasound examinations while fasting, using a Siemens Sequoia system with a 5C1 transducer, adhering to a specified protocol. The investigation focused on several key aspects: a) gallbladder position, b) wall thickness, c) calculus dimensions, d) cystic duct length, e) common bile duct, f) adhesions around the gallbladder at various locations, and g) potential complications. Shear wave elastography was performed with patients positioned supine or in the left lateral decubitus position, capturing images in the axial and oblique sagittal planes of the gallbladder. The region of interest (ROI) was centrally placed in the gallbladder, and circular measurements were taken to quantify regional stiffness. Ten healthy volunteers with normal gallbladder characteristics were examined using the same procedure. The mean values of the gallbladder wall and the surrounding area were determined using a 95% confidence interval. Each finding was rated on a scale of 0-3, and the cumulative score was calculated. Patients were then classified into three categories based on their scores: Group A (no difficulty), Group B (some difficulty), and Group C (serious difficulty with complication risks), as shown in (Table 1).
Table 1: Pre-Laparoscopic Assessment Score (PLAS)
| S.No. | Property | 0 | 1 | 2 | 3 |
| 1 | Distension | Normal | Partially distended | Not distended | Collapsed |
| 2 | Wall Thickness | 0 | 2.5 - 4 | > 4mm | |
| 3 | Calculus Size | < 10 mm | 10 - 20 mm | > 20 mm | |
| 4 | Adhesion | < 12 | 12 to 15 | 15 - 18 | > 18 |
| 5 | Cystic Duct Visualised | 20 mm | <20 mm | Not Visualised | |
| 6 | Gall Bladder complication | Nil | Acute inflammation | Collection | Perfusion/Gangrene |
| 7 | Congenital anomaly | Absent | Minor Abnormality/ Shape | Location/ Duplication |
Group A; No difficulty level - Total Score <3; Group B: Moderate difficulty level: 3-6; Group C: High difficulty level and likelihood of complication: >6.
All patients subsequently underwent laparoscopic cholecystectomy, and the entire procedure was documented using video recording. The surgeon evaluated the operation's difficulty and any complications categorizing the patients into three groups (A-C), with B and C being somewhat and most difficult respectively and were assigned surgical score of 1-2, 3-4 and above 4.
Statistical analysis was performed using the Xlstat software. An ANOVA test along with Tukey’s HD post hoc analysis was performed for each variable along with the correlation matrix. Cohen D test along with Random Forest classification using confusion matrix was performed for variable importance, Diagnostic analysis was done to determine sensitivity, specificity and accuracy for each imaging variable, along with AUCs.
Results
Informed consent was obtained from 146 prospective patients undergoing laparoscopic cholecystectomy for cholelithiasis who presented to us for abdominal sonography for suspected gallbladder disease over a period of one year, from December 2023 to October 2024. Approval for study was obtained from the institutional ethics committee. There were 76 males and 70 females with median BMI of 26.4. All the imaging variables were recorded and total score calculated based on which they were categorized in three groups tabulated in [Table 2] [Figures 1,2]. Normality of data on the Shapiro Wilkson normality Test was observed only for adhesions while all other variables deviated from normality. Box plot distribution of five variables is seen in box plot [Figure 3]. ANOVA of means was done and showed that only two variables i.e., detection of adhesions and wall thickness had statistically significant differences (Table 3) p value <0.001. Cohen D analysis was done for pair wise differences between these groups for each variable.
The effect Sizes for the wall thickness variable showed that the effect sizes were small to medium (A vs. B: -0.12, B vs. C: -0.72, A vs. C: -0.77), indicating moderate differences between groups, especially between B and C, and A and C. For adhesion, the effect sizes were large (A vs. B: -0.94, B vs. C: -1.51, A vs. C: -2.66), showing substantial differences across all group comparisons. Also, Correlations matrix test indicated no strong relationships (|r| > 0.5) between the variables, suggesting that the variables were relatively independent of each other (Figure 5). Tukey, s HSD test was done for all significant variables (Table 4). For Wall Thickness: Significant differences between Groups A vs. C and B vs. C and for Adhesion Significant differences across all group comparisons and the mean values increased progressively from Group A (2.25 mm) to Group C (2.96 mm). Tukey's HSD test showed significant differences between Groups A vs. C and B vs. C. The effect sizes indicate moderate differences between groups (e.g., A vs. C: -0.77).
Similarly for adhesions: The mean values increased significantly from Group A (10.18) to Group C (18.37). The Tukey's HSD test showed significant differences across all groups. The effect sizes were large, especially between A and C (-2.66). Other Variables i.e., distension, Calculus, and Cystic Length were not significantly different between the groups. The correlation analysis revealed weak or no relationships between most variables, except for a weak positive correlation between adhesion and wall thickness (r = 0.30). Weak positive correlation was seen between Adhesions Vs Wall Thickness (r = 0.30) while Calculus vs Distension had weak negative correlation (r = -0.24). Weak or no correlation was seen between Cystic Length and all other variables (r = -0.09-0.01). Similarly, adhesions vs distension and calculus also showed very weak or no positive correlation (r = 0.11, 0.15) respectively. Diagnostic analysis done for variables and Total score along with AUC (figure 6) using the confusion matrix four key prediction categories (Figure 7).
- Adhesions was the best Predictor which out of total of 147 cases had true Negatives (TN): 30 (20.4%) as Correctly predicted easy cases, 4 (2.7%) were false Positives (FP) i.e., surgical easy cases incorrectly predicted as difficult, false Negatives (FN) were: 23 (15.6%; difficult cases incorrectly predicted as easy), true Positives (TP): 90 (61.2%; correctly predicted difficult cases).
- Wall Thickness: showed True Negatives (TN):27 (18.4%) Correctly predicted easy cases, false Positives (FP):7(4.8%) Easy cases incorrectly predicted as difficult, false Negatives (FN):60 (40.8%) Difficult cases incorrectly predicted as easy, true Positives (TP):53(36.1%) Correctly predicted difficult cases
- Cystic Length: had true Negatives (TN): 1 (0.7%; Correctly predicted easy cases), false Positives (FP): 33 (22.4%), false Negatives (FN): 3 (2.0%) - Difficult cases incorrectly predicted as easy, true Positives (TP): 110 (74.8%) - Correctly predicted difficult cases
AUC analysis revealed AUC of 0.85,0.61 and 0.35 for best three variables. (Figure6a)
Diagnostic analysis done for total score using same method revealed Sensitivity, specificity PPV and NPV of 0.965,1.000,1.000 and 0.895 respectively with an accuracy of 0.97% with an AUC of 0.97. (Figure6b).
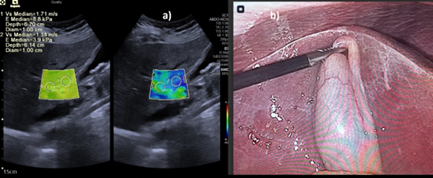
Figure 1: a) image showing stiffness of 3.9KPa with b) absent adhesions seen on laparoscopy.
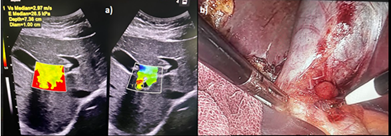
Figure 2: a) Group C patient with SW image showing stiffness of 26.5KPa b) Laparoscopy showing marked adhesions & inflammation with enlarged lundh node.
Table 2: Summary Statistics of Variables Across Groups (Mean ± SD)
| Variable | Group A (n=33) | Group B (n=71) | Group C (n=42) |
| Wall Thickness | 2.25 ± 0.47 | 2.35 ± 0.52 | 2.96 ± 0.84 |
| Distension | 0.58 ± 0.82 | 0.46 ± 0.89 | 0.64 ± 0.93 |
| Calculus | 11.88 ± 6.12 | 14.44 ± 5.73 | 14.61 ± 5.42 |
| Adhesions | 10.18 ± 2.84 | 13.18 ± 2.93 | 18.37 ± 3.12 |
| Cystic Length | 22.39 ± 2.31 | 21.22 ± 2.71 | 21.73 ± 2.52 |
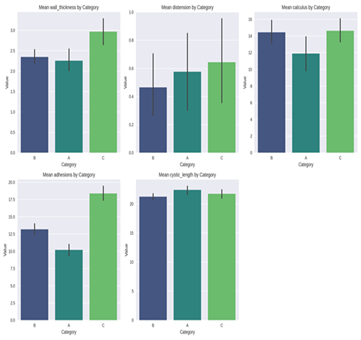
Figure 3: Box plot distribution of the imaging variables
Table 3: ANOVA results of the variables for groups A-C.
| Variable | Group A (n=33) | Group B (n=71) | Group C (n=42) | p-value | Significance |
| Wall Thickness | 2.25 ± 0.47 | 2.35 ± 0.52 | 2.96 ± 0.84 | 0.0002 | *** |
| Distension | 0.58 ± 0.82 | 0.46 ± 0.89 | 0.64 ± 0.93 | 0.5886 | ns |
| Calculus | 11.88 ± 6.12 | 14.44 ± 5.73 | 14.61 ± 5.42 | 0.0647 | ns |
| Adhesions | 10.18 ± 2.84 | 13.18 ± 2.93 | 18.37 ± 3.12 | 0.0000 | *** |
| Cystic Length | 22.39 ± 2.31 | 21.22 ± 2.71 | 21.73 ± 2.52 | 0.0623 | ns |
Significance levels: ***: p < 0.001; **: p < 0.01; *: p < 0.05; ns: not significant
Table 4: Tukey,s HSDT Test for wall thickness and Adhesions
| Wall Thickness | ||||||
| Multiple Comparison of Means – Tukey HSD, FWER = 0.05 | ||||||
| Group 1 | Group 2 | Mean Diff | p-adj | Lower | Upper | Reject |
| A | B | 0.0905 | 0.8641 | -0.3257 | 0.5067 | False |
| A | C | 0.7097 | 0.0010 | 0.2502 | 1.1693 | True |
| B | C | 0.6192 | 0.0006 | 0.2347 | 1.0038 | True |
| Adhesions | ||||||
| Multiple Comparison of Means – Tukey HSD, FWER = 0.05 | ||||||
| Group 1 | Group 2 | Mean Diff | p-adj | Lower | Upper | Reject |
| A | B | 3.0015 | 0.0001 | 1.3741 | 4.6289 | True |
| A | C | 8.1867 | 0.0000 | 6.6389 | 9.9836 | True |
| B | C | 5.1852 | 0.0000 | 3.6815 | 6.6889 | True |
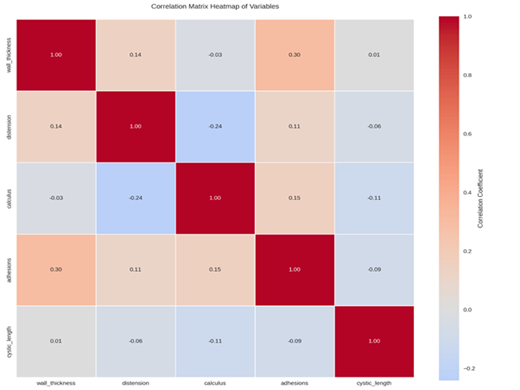
Figure 4: Correlation matrix Heatmap of the variables
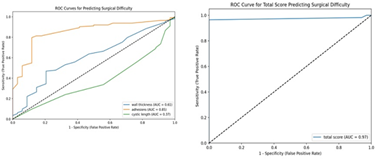
Figure 5: a) AUC for individual Variables. b) AUC for total PLAS Score
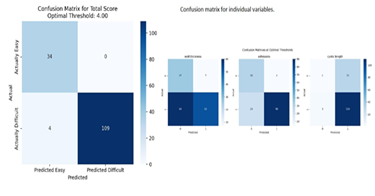
Figure 6: Confusion matrix for PLAS and individual variables
Discussion
The primary objective of this study was to evaluate the differences in wall thickness and adhesion among patients with cholelithiasis using imaging findings. Our findings revealed based on variables using shear wave elastography with ultrasonography patients can be categorized into three groups of surgical difficulty. No such study has been done earlier and only one study was done by our group showing using of virtual touch imaging on gall bladder evaluation [9]. All other studies [10,11] so far have stressed mainly on the gall bladder wall thickness as a key factor which the present study shows is not the most accurate variable alone. The effect sizes for wall thickness were moderate between groups B and C, and A and C, while the effect sizes for adhesion were substantial across all group comparisons. In the current study there are significant differences in wall thickness and adhesion among the three patient groups. Understanding the differences in these parameters is crucial for improving the diagnosis and treatment of gallbladder diseases. Contrary to some earlier studies, our correlation matrix indicated no strong relationships between the variables, suggesting their relative independence. This also explains the reason why the total PLAS score had better accuracy than any of the variables alone and that the total score was an excellent predictor of surgical difficulty, performing better than any individual measure analysed earlier. The total score combined multiple factors and provided a more reliable prediction of surgical difficulty than any single measurement. However, findings based on Tukey's post hoc analysis highlight the importance of considering both wall thickness and adhesions in the preoperative assessment of cholelithiasis rather than any variable alone. Out of all variables alone adhesion has the highest accuracy of 81.6% in defining difficulty level while wall thickness and cystic length showed lower reliability. Contrary to some earlier findings of previous studies which indicated varying levels of accuracy for different predictors of surgical difficulty, with adhesions often being cited as a reliable measure but could not preoperatively image them directly by the available tools and adopted different clinical and radiological scores to predict difficulty level. Maximum stress was based on detection of gall bladder wall thickness. Contrary to these earlier findings, our study shows that wall thickness has a higher rate of false negatives, making it less reliable than previously thought. The confusion matrix for adhesions showed a true positive rate of 61.2% and a true negative rate of 20.4%, highlighting its balanced predictive ability while for gall bladder wall thickening it was 36% and 18%. Compared to wall thickness and cystic length, adhesions demonstrated superior predictive performance, with the highest true positive and true negative rates. Our study shows that wall thickness has a higher rate of false negatives, making it less reliable than previously thought.
Conclusion
This study provides novel insights into the independent nature of wall thickness and adhesions in patients with cholelithiasis and helps pre surgical decision-making to tailor more effective operative strategies for patients with gallbladder disease. Identifying the most reliable predictors of surgical difficulty is crucial for improving surgical outcomes and patient safety. The study significantly provides a comprehensive comparison of different predictors of surgical difficulty, emphasizing the reliability of adhesions. The findings suggest that clinicians should prioritize adhesions as a key predictor when assessing surgical difficulty to enhance decision-making processes. While adhesions showed the best performance, it is important to consider the context and individual patient factors when interpreting these results. This study also introduces a novel approach by using confusion matrices to compare the predictive reliability of different surgical difficulty measures. One limitation of this study is the relatively small sample size, which may affect the generalizability of the findings.
References
- Augustine, A., and Vivek, M.A. M., Rao, R. (2014). Comprehensive predictive scoring method for difficult laparoscopic cholecystectomy. Journal of Minimal Access Surgery, 10(2), 62.
Publisher | Google Scholor - Ćwik, G., Skoczylas, T., Wallner, G., & Wyroślak-Najs, J. (2013). Percutaneous ultrasound value for predicting conversion from laparoscopic to open cholecystectomy due to acute cholecystitis. Surgical Endoscopy, 27(7), 2561–2568.
Publisher | Google Scholor - Nidoni, R. (2015). Predicting Difficult Laparoscopic Cholecystectomy Based on Clinicoradiological Assessment. Journal Of Clinical and Diagnostic Research,9(12).
Publisher | Google Scholor - Di Buono, G., Buscemi, S., Gulotta, L., Agrusa, A., Romano, G., et al., (2021). Difficult laparoscopic cholecystectomy and preoperative predictive factors. Scientific Reports, 11(1).
Publisher | Google Scholor - Daradkeh, S. S., Abu‐Khalaf, M., & Suwan, Z. (1998). Preoperative ultrasonography and prediction of technical difficulties during laparoscopic cholecystectomy. World Journal of Surgery, 22(1), 75–77.
Publisher | Google Scholor - Fried, G. M. and Barkun, J. S., Sigman, H. H., Joseph, L., Clas, D., et al., (1994). Factors determining conversion to laparotomy in patients undergoing laparoscopic cholecystectomy. The American Journal of Surgery, 167(1), 35–41.
Publisher | Google Scholor - Gupta, N., Ranjan, G., Arora, M. P., Goswami, B., Chaudhary, P., et al., (2013). Validation of a scoring system to predict difficult laparoscopic cholecystectomy. International Journal of Surgery, 11(9), 1002–1006.
Publisher | Google Scholor - Schrenk, P., Woisetschläger, R., Wayand, W. U., & Rieger, R. (1998). Diagnostic score to predict the difficulty of laparoscopic cholecystectomy based on preoperative variables. Surgical Endoscopy, 12(2), 148–150.
Publisher | Google Scholor - Kapoor A, Sidhu BS, Singh J, Brar N, Singh P, et al., (2022). Adhesions Detection and Staging Classification for Preoperative Assessment of Difficult Laparoscopic Cholecystectomies: A Prospective Case-Control Study. J Med Ultrasound.,10;31(2):137-143.
Publisher | Google Scholor - Dinkel HP, Kraus S, Heimbucher J, Moll R, Knüpffer J, et al., (2000). Sonography for selecting candidates for laparoscopic cholecystectomy: A prospective study. AJR Am J Roentgenol.,174:1433–1439.
Publisher | Google Scholor - Corr P, Tate JJ, Lau WY, Dawson JW, Li AK. (1994). Preoperative ultrasonography to predict technical difficulties and complications in laparoscopic cholecystectomy. Am J Surg.,168:54–56.
Publisher | Google Scholor