
Research Article
Patient Safety Incident Reporting Behavior and Associated Factors Among Nurses Working in Public Hospitals in Addis Ababa, Ethiopia (2024)
1 Addis Ketema Sub-City Health Office, Woreda10Health Center, Addis Ababa, Ethiopia.
2 Departments of Public Health, Yekatit 12 Hospital Medical College, Addis Ababa, Ethiopia.
*Corresponding Author: Solomon Negewo Gemeda, Addis Ketema Sub-City Health Office, Woreda10Health Center, Addis Ababa, Ethiopia.
Citation: Solomon N. Gemeda, Kibret A. (2025). Patient Safety Incident Reporting Behavior and Associated Factors Among Nurses Working in Public Hospitals in Addis Ababa, Ethiopia (2024), Journal of BioMed Research and Reports, BioRes Scientia Publishers. 8(1):1-13. DOI: 10.59657/2837-4681.brs.25.168
Copyright: © 2025 Solomon Negewo Gemeda, this is an open-access article distributed under the terms of the Creative Commons Attribution License, which permits unrestricted use, distribution, and reproduction in any medium, provided the original author and source are credited.
Received: May 03, 2025 | Accepted: May 17, 2025 | Published: May 24, 2025
Abstract
Background: Patient safetyisessentialto the quality of caregiven to patients, and it remains a challenge for countries at all stages of development. There appears to be a common acceptance of the necessity of building patient safety culture within health care organizations. Hospitals with a positive patient safety culture are transparent and fair with staff when incidents occur, learn from mistakes, and rather than blaming individuals, look at what went wrong in the system. Health care providers are willing to report the errors but, due to poor reporting system and culture of blame and shame, there exists struggle of disclosure of adverse events.
Objective: This study aimed to assess incident reporting behavior and associated factors among Nurses working in Addis Ababa Public hospitals in Addis Ababa, Ethiopia, 2024.
Methods: A cross-sectional institutional-based study was conducted with a total of 233 randomly selected participant samples drawn from six public hospitals in Addis Ababa, between July 16 and September 16, 2024. A structured interviewer-administered questionnaire and observational checklist based on previous studies were employed for data collection. Bivariate and multivariate analysis used a binary logistic regression model to determine the relationships between the dependent variables and the independent variables and the strength of association was calculated as Adjusted Odds Ratios (AOR), and 95% Confidence Interval (CI) at <0.05 p-value.
Result: A total of 245 study subjects were recruited. 233 were interviewed yielding response rate of 95.8% of the 233 participants were female (162(69.5%)), and had a degree (145 (62%)). The largest group of study participants reported having 6-10 years of experience in the hospital (53.5%) and in the current unit (40%). Additionally, Degree nurse participants had 3.027 times greater odd of of reporting patient safety incident when compared to Diploma Nurse (AOR: 3.027; 95%CI: 1.736-5.279). Nurses that reported more than 5 years (31.7%) of experience had 1.71 times greater odd of reporting safety incidents compared to nurses that reported less than 5 years of experience (AOR: 1.71; 95%CI: 1.236- 2.379).
Conclusion: - Safety incident reporting culture score of participants was less than 70%. Training on patient safety and incident reporting positively affects reporting. Clear guidelines should be put on patient safety and incident reporting. Focus should be given to trainings.
Keywords: safety culture; reporting; among nurse addis ababa
Introduction: Background
The health care delivery system is a complicated, by design and prone to errors with many medical practices and risks in the system emerging as major challenges for patient safety by contributing significantly to the burden of harm due to unsafe care [1]. Patient safety which includes actions taken to avoid and lessen unfavorable outcomes that Colden danger patients while they are receiving treatment is a basic component of the provision of healthcare. An essential tool for recognizing and resolving patient safety issues in healthcare settings is incident reporting. By reporting incidents, healthcare professionals contribute to the identification of system failures the implementation of corrective measures and the improvement of overall patient care quality [2]. Patient safety is defined as the reduction of risk of unnecessary harm associated with health care to an acceptably minimum degree. In contrast, a patient safety incident (PSI) is any event or situation that, via one way or another, may have caused or really did cause needless harm to a patient [3]. The provision of high-quality healthcare is thought to be inextricably linked to patient safety, making it a fundamental and crucial component [4].
One of the top priorities for the global health community is for healthcare facilities to establish a patient safety culture, and incident reporting is regarded as a crucial component of this effort [1, 3]. Evaluating the current patient safety culture is the first step towards creating a new one [4]. Positive patient safety cultures in health organizations are predicted by a number of factors, including shared understanding of the value of patient safety, communication based on mutual trust, synchronized information flow, leadership commitment, and the absence of a punitive approach to incident reporting [4-6]. Depending on the level of injury the patient experiences, a safety incident can be categorized into one of three categories: harmful, which includes harm that results from a patient not receiving the intended or anticipated treatment. Adverse Events (AEs) and/or Sentinel Events are included in the definition of a harmful incident. An event falling under the PSI classification of "No Harm Incident" happens but does not cause harm to the patient [5]. Reporting previously occurring occurrences is one strategy to enhance patient safety. Learning from mistakes would be facilitated by an inclusive and methodical approach to event reporting. Health workers can trace and discuss a variety of errors and safety-related accidents through incident reporting, which enables the construction of preventive measures. The magnitude of underreporting, however, remains high in different countries [7,8]. In Ethiopia, as in many other low- and middle-income countries, the promotion of patient safety and the establishment of robust incident reporting systems are essential priorities for improving health care quality and reducing adverse events. However, little study has been done expressly on the incident reporting practices of Ethiopian nurses employed at public hospitals in Addis Ababa. The absence of sufficient knowledge impedes the development of focused treatments and policies that aim to improve patient safety within the local healthcare setting.
Materials and Methods
Study design, area and period
Addis Ababa is one of the highest capital cities in the world, rising about 2,400meters (7,900feet) above sea level. Geographically, the city is in the middle of the nation, which has shaped its growth into a major commercial, political, and cultural hub. With a population of over 8 million, Addis Ababa is Ethiopia's largest city.
The study was conducted in public hospitals under the Addis Ababa City Administration in Addis Ababa, Ethiopia. Addis Ababa, the capital city of Ethiopia, is home to 13 government hospitals—six federal hospitals, six administered by the Addis Ababa Health Bureau, one owned by the police force, and one owned by the armed forces. This study focused on the six hospitals managed by the Addis Ababa Health Bureau. Data collection took place from July 16 to September 16, 2023 (Figure 1).

Figure 1: Map of Addis Ababa Sub-city, Addis Ababa Ethiopia (2025)
Population
All Nurses working in the Addis Ababa Health Bureau Public Hospital Addis Ababa, Ethiopia were the source population.
Sample size determination and sampling procedure
The single population proportion formula was used to determine the sample size with the following assumptions: The estimated proportion of respondents who reported incidents always is 25% (31) the margin of error 5%, confidence interval (CI) 95% and non-response rate 10%. The required sample size (n) was calculated as follow
The estimated number of participants were proportionally recruited from the hospitals based on the respective number of nurses they have working in their hospital. Nurse worker was selected to participate in the study as they are more directly involved inpatient care. The study Subjects was selected by using simple random sampling technique after obtaining a list of Nurse Staff from each hospital.
Based on the proportional allocation formula the total sample size was allocated to the Addis Ababa Health Bureau Public hospitals based on the number of nurses they have in their hospitals.
Operational Definitions
Safety culture composite/dimension: a collection of questions that that aim to assess a specific safety related feature of a hospital [37].
Safety culture items: a single question in a composite that assesses specific safety related feature of a hospital [37].
Health care professionals: Nurses with different qualifications; with bachelor degree, master’s degree and diploma were considered health professionals in this study.
Percent positive is the percentage of positive responses (Agree, strongly agree/ Most of the time, Always) to positively worded items or, (Disagree, strongly disagree/ Rarely, Never) to negatively worded items [37].
Area of strength: To be considered as area of strength, an item must have positive responses by at least 75 % of the respondents [37, 38].
Is a requiring improvement: Items which had positive responses by less than 50% of the respondents? [37, 38].
Data Collection Tools and Technique
Data were collected from July 16 to September 16, 2024, using a pre-tested, structured, self-administered questionnaire in the Amharic language, supplemented by observational checklists. The questionnaire was initially prepared in English, translated into Amharic, and then back-translated into English to ensure consistency. Training was provided to data collectors and supervisors before data collection. Two BSc-level health professionals were recruited as data collectors and trained on clarification of terms and data collection tools. Healthcare providers completed the questionnaire.
The questionnaire consisted of nine sections, including an observational checklist covering multiple aspects of food hygiene:
- Socio-demographic section: Included six questions to gather demographic data of participants.
- Food safety knowledge: Comprised ten closed-ended questions assessing knowledge about food safety. Responses were scored 1 for correct answers and 0 for incorrect or unanswered ones.
- Waste management: Included four questions to assess waste management practices.
- Hygienic practices: Featured 21 questions (including observations) evaluating hygiene-related practices. One point was awarded for each safe practice, and zero for unsafe practices.
- Water supply: Included eight questions about the availability and quality of water.
- Food preparation and processing: Consisted of six questions on food preparation practices.
- Transportation and food handling: Included four questions assessing transportation and handling of food.
- Vending unit and equipment: Contained three questions evaluating the condition and cleanliness of vending units and equipment.
- Food safety regulation: Included three questions to assess awareness and compliance with food safety regulations.
Data were collected through face-to-face interviews and direct observation. Food hygiene knowledge and food handling practices were scored similarly, with one point awarded for standard practices and zero for unsafe practices.
Data Processing and Analysis
After data collection, questionnaires were checked for completeness and coded. Data were cleaned and assessed for outliers, missing values, and inconsistencies, then entered into and analyzed using SPSS version 25. Descriptive statistics were used to summarize participants’ socio-demographic and professional characteristics, patient safety culture composites, and incident reporting behavior. Variables associated with the frequency of PSI reporting (p-value ≤ 0.25) from bivariate analysis were included in multivariable analysis. A p-value < 0>
Ethical Considerations
The findings of this study were submitted to Yekatit 12 Hospital Medical College, the Department of Public Health Quality, Addis Ababa City Administration Health Bureau, and the Federal Ministry of Health. Participating hospitals and interested stakeholders were informed, and oral presentations were delivered at various conferences and workshops. As scientific work is considered incomplete without dissemination, the study was also submitted for publication in a peer-reviewed journal.
Results
Socio-demographic and Professional Characteristics of Participants
Out of the 245 study participants recruited, 233 completed the interview, resulting in a response rate of 95.8%. Among them, 162 (69.5%) were female, and 145 (62%) held a bachelor's degree. The majority of participants (53.5%) had 6–10 years of experience in the hospital, and 40% had 6–10 years of experience in their current unit (Table 1).
Table 1
| No | Variables | Category | Frequency | Percentage |
| 1 | Age | 20-29Yrs | 110 | 47.2 |
| 30-39Yrs | 97 | 41.6 | ||
| 40-49 yrs | 25 | 10.7 | ||
| >50yrs | 1 | 0.4 | ||
| 2 | Sex | Male | 71 | 30.5 |
| Female | 162 | 69.5 | ||
| 3 | Educational status | Diploma | 23 | 10 |
| BSc | 145 | 62 | ||
| MSc | 65 | 28 | ||
| 4 | Work experience in the hospital in years | 1to5 | 79 | 40 |
| 6to10 | 125 | 53.5 | ||
| 11to15 | 22 | 9.4 | ||
| 16to20 | 7 | 3 | ||
| 5 | Work experience in current profession/specialty in years | <1> | 20 | 8.6 |
| 1to5 | 93 | 40 | ||
| 6to10 | 80 | 34.3 | ||
| 11to15 | 40 | 17.1 | ||
| 6 | Workhours/week | <20> | 0 | 0 |
| 20to39 | 30 | 12.8 | ||
| 40to59 | 29 | 12.4 | ||
| 60to79 | 125 | 53.6 | ||
| 80to99 | 40 | 17.1 | ||
| 100ormore | 9 | 3.8 |
Patient Safety Culture Dimensions
The percentage of positive reactions for the selected eight patient safety culture measurements ranged from 53% to 71%. The mean positive reaction score across all measurements was calculated to be 63%. The lowest scoring measurements were "Communication openness" and "Feedback and communication about error," with scores of 50.8% and 52.9%, respectively. In contrast, the "Teamwork within units" dimension received the highest positive response rate at 70.1%, followed by general recognition of patient safety. Except for "Organizational learning – continuous improvement" (67.6%), all other safety culture dimensions scored below 60% (Figure 2).
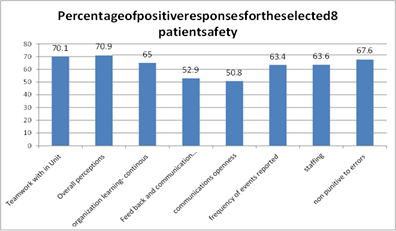
Figure 2: Percentage of positive responses scores of eight safety culture dimensions in Addis Ababa city Administration Public hospitals in Addis Ababa, Ethiopian, 2024.
Patient safety culture items
Whereas computing the positive reaction rate for each of the things of the safety culture measurements, scores extended from 49 to 75%. 'We are effectively doing things to move forward or improve patient safety (75%) In this unit individuals treat each other with regard had the highest (75%) positive reaction rate. We work in 'crisis mode attempting to do as well much, as well quickly.' And when an occasion is reported, it feels just like the individual is being composed up, not the problem.” scored 49%, which makes them as things with the most reduced lowest positive reaction rate. In total there were 18 safety culture things within the 26things of the eight culture dimensions/composites with less than50% normal positive score (Table 2).
Table 2: Percent of average positive response for items in composite
| Composite items | Score % (a) | Mean (SD) (b) |
| Teamwork Within Units | ||
| A1. People support one another in this unit. | 69.3 | 4.16(1.082) |
| A2. When a lot of work needs to be done quickly, we work together as a team to get the work done. | 69.1 | 4.01(1.068) |
| A3. In this unit, people treat each other with respect. | 75 | 3.79(1.06) |
| A4. When one area in this unit gets really busy, others help out. | 67 | 3.66(1.171) |
| Organizational Learning – Continuous Improvement | ||
| A6. We are actively doing things to improve patient safety. | 71.6 | 3.96(1.062) |
| A8. Mistakes have led to positive changes here. | 72.9 | 4.03(1.023) |
| A12. After we make changes to improve patient safety, we evaluate their effectiveness. | 68.3 | 3.97(1.072) |
| Overall Perceptions of Patient Safety | ||
| A14. Patient safety is never sacrificed to get more work done. | 68.8 | 3.96(1.074) |
| A17. Our procedures and systems are good at preventing errors from happening. | 58.8 | 3.79(1.084) |
| A9. It is just by chance that more serious mistakes don't happen around here. | 67.9 | 3.95(1.078) |
| A16. We have patient safety problems in this unit. | 64.8 | 3.96(1.029) |
| Feedback and Communication About Error | ||
| C1. We are given feedback about changes put into place based on event reports. | 54.5 | 3.73(1.074) |
| C3. We are informed about errors that happen in this unit. | 51.1 | 3.70(1.093) |
| C5. In this unit, we discuss ways to prevent errors from happening again. | 53.2 | 3.68(1.084) |
| Communication Openness | ||
| C2. Staff will freely speak up if they see something that may negatively affect patient care. | 52.3 | 3.73(1.055) |
| C4. Staff feel free to question the decisions or actions of those with more authority. | 49 | 3.66(1.060) |
| C6. Staff are afraid to ask questions when something does not seem right. | 51.1 | 3.70(1.072) |
| Frequency of Events Reported | ||
| D1. When a mistake is made, but is caught and corrected before affecting the patient, how often is this reported? | 64 | 3.89(1.055) |
| D2. When a mistake is made, but has no potential to harm the patient, how often is this reported? | 65.3 | 3.92(1.058) |
| D3. When a mistake is made that could harm the patient, but does not, how often is this reported? | 60.9 | 3.88(1.093) |
| Staffing | ||
| A2. We have enough staff to handle the workload. | 56.7 | 3.56(1.26) |
| A5. Staff in this unit work longer hours than is best for patient care. | 67.8 | 3.91(1.061) |
| A14. We work in "crisis mode" trying to do too much, too quickly. | 66.5 | 3.93(1.106) |
| Non-Punitive Response to Error | ||
| A8. Staff feel like their mistakes are held against them. | 72.9 | 4.00(1.040) |
| A12. When an event is reported, it feels like the person is being written up, not the problem. | 64.8 | 3.94(1.089) |
| A16. Staff worry that mistakes they make are kept in their personnel file. | 65.2 | 3.90(1.020) |
Percentage of positive responses was calculated according to AHRQ instructions for every safety culture item in the composites.
Mean and standard deviation of responses were calculated by computing the mean and standard deviation of all (both positive and negative) responses.
Incident Reporting Behaviors of the Participant.
The proportion of health professionals who believed PSI were reported in all situations was 39%. This was done by summation of all ‘Always’ responses to all three situations or patient condition after error took place (Table 3).
Table 3: Frequency of events reported (in%) by health professionals in Addis Ababa city Administration Public hospitals in Addis Ababa, Ethiopia, 2024.
| Situation | Always | Most of the time | Sometimes | Rarely | Never |
| D1 | 37.8 | 26.2 | 24 | 11.6 | 0.4 |
| D2 | 39.1 | 26.2 | 22.7 | 11.6 | 0.4 |
| D3 | 39.9 | 21 | 26.6 | 11.6 | 0.9 |
D1. When a mistake is made, but is caught and corrected before affecting the patient, how often is this reported?
D2. When a mistake is made, but has no potential to harm the patient, how often is this reported?
D3. When a mistake is made that could harm the patient, but does not, how often is this reported?
N.B The proportion of health care professionals who believed that incidents were reported ‘Always’ and ‘Most of the Time’ are 73.4%. This was computed by calculating the positive response rate of the three situations as shown in the table below (Table 4).
Table 4: Average positives core for frequency of incidents reported by health professionals working in Addis Ababa city Administration Public hospitals in Addis Ababa, Ethiopia, 2024.
| Three Items Measuring Frequency of Events Reported | Number Of “Always’ Or “Most of The Time” Responses | Total number of Responses to Item (Excluding Missing Responses) | Percentage Positive Response to Item |
| D1 | 149 | 233 | 149*100/233=63.9% |
| D2 | 152 | 233 | 152*100/233=65.2% |
| D3 | 142 | 233 | 142*100/233=60.9% |
| Average% positive response across the 3 items=63.9+65.2+60.9/ | |||
D1. When a mistake is made, butis caught and corrected before affecting the patient, how often is this reported?
D2. When a mistake is made, but has no potential to harm the patient, how often is this reported? D3. When a mistake is made that could harm the patient, but does not, how often is this reported?
Training on patient safety and incident reporting
Another component that was included in the study is whether or not participants had ever been involved in training related to patient safety and incident reporting. Accordingly, only 45.5% of the participants reported having received such training.
Number of Events Reported
The233participantswereaskedthenumber of reports they filled and submitted to the incident officers in their work unit within the past 12 months. 142 (60.9%) of the study participants said they had not reported any. Whereas 47 (20.2%) have reported1to 2PSIwith in the past 12 months (Figure 3).
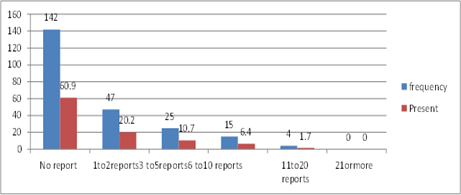
Figure 3: Number of reports submitted in the past 12 months by health professionals working in Addis Ababa city Administration public hospitals in Addis Ababa, Ethiopia, 2024 Safety grade.
When asked to grade the hospital they work in with regard to patient safety, 34.5% graded the hospitals as having a poor safety. (Figure 4).
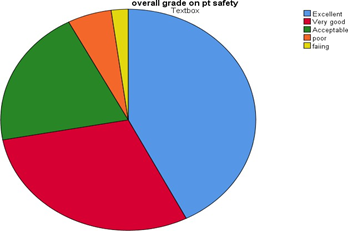
Figure 4: patient safety grade of Addis Ababa City Administration Public Hospital in Addis Ababa, Ethiopia, 2024.
Associated Factors to Reporting Behavior of Participants
Socio-demographic and professional characteristics of participants were assessed to identify possible associations with the number of incidents reported. Bivariate analysis revealed that training and job position had a statistically significant relationship with the likelihood of reporting at least one patient safety incident within the past 12 months.
Although not statistically significant, participants who were female, worked in acute care units, had 1–5 or more than 5 years of experience in their current unit, and had over 5 years of experience in their profession were more likely to report at least one incident compared to their counterparts (Table 5).
Five variables—including sex and four other factors—met the criteria for inclusion in multivariable logistic regression analysis using a p-value threshold of 0.25. Three variables were identified as significantly associated with patient safety incident reporting behavior:
- Participants who received training had nearly eight times higher odds of reporting incidents compared to those without training (AOR: 7.719; 95% CI: 3.59–16.64).
- Degree-holding nurses had 3.03 times higher odds of reporting incidents compared to diploma-holding nurses (AOR: 3.027; 95% CI: 1.736–5.279).
- Nurses with more than 5 years of professional experience had 1.71 times higher odds of reporting incidents compared to those with less than 5 years of experience (AOR: 1.71; 95% CI: 1.236–2.379).
The remaining two variables included in the model were not significantly associated with incident reporting behavior (Table 6).
Table 5: Bivariate analysis on factors associated with patient safety incident reporting behavior among health care professionals working in Addis Ababa city Administration Public hospitals in Addis Ababa Ethiopia,2024 (n = 233)
| Variables | Category | PSI report status | Crude Odds Ratio (95%CI) | |
| No | Yes | |||
| Sex | Female | 39(24) | 123(76) | 0.66(0.35-1.223) |
| Male | 23(32.3) | 48(67.6) | 1.00 | |
| Training | Yes | 44(25.) | 127(74.2) | 7.719(3.59-16.64) |
| No | 9(14.5) | 53(85.5) | 1.00 | |
| Experience in the current hospital in years | ≤5 | 26(35.6) | 47(64.3) | 1.00 |
| >5 | 35(21.8) | 125(78.1) | 3.027(1.74-5.27) | |
| Working hours per week | <40> | 4(25) | 12(75) | 1.625(0.132-9.9) |
| 40-79 | 8(23.5) | 26(76.4) | 1.33(0.67-6.42) | |
| >=80 | 37(20.2) | 146(79.8) | 1.00 | |
| Work experience in current profession/ specialty in years | <1> | 6(30) | 14(70) | 1.00 |
| 1to5 | 28(30.4) | 64(69.5) | 1.08(0.31-3.74) | |
| >5 | 20(16.5) | 101(83.47) | 4.24(1.530-11.778) | |
Table 6: Multivariate analysis on factors associated with patient safety incident reporting behavior among health care professionals working in addis ababa city administration public hospitals in addis ababa Ethiopia 2024 (n=233)
| Variables | Category | Adjusted Odds Ratio (95%CI) |
| Sex | Female | 1.135(0.53-2.421) |
| Male | 1.00 | |
| Training | Yes | 5.869(2.62-13.21) |
| No | 1.00 | |
| Working hours per week | <40> | 1.53(0.41-7.75) |
| 40-79 | 0.63(0.25-1.58) | |
| >=80 | 1.00 | |
| Educational Level | Diploma | 1.574(0.773-3.202) |
| Degree | 1.00 | |
| Work experience in current profession/ specialty in years | <1> | 1.00 |
| 1to5 | 1.24(0.80-1.93) | |
| >5 | 0.94(0.69-5.39) |
Discussion
Improving patient safety culture in healthcare organizations is the first step in reducing medical errors and improving patient outcomes [39]. Tools that assess patient safety cultures, such as the HSOPSC, provide a standardized and comprehensive understanding of issues related to patient safety. These tools are increasingly used to track cultural changes over time [39, 40]. This study assessed the current status of patient safety culture in Addis Ababa public hospitals among nurses, with a specific focus on incident reporting culture. The findings showed that the overall positive response rate for all HSOPSC dimensions was 63%, which aligns with findings from similar studies conducted within the city and country. For instance, one study in public hospitals of Addis Ababa and another in Jimma Zone reported overall mean scores for positive perception of patient safety culture at 46% and 36.77% respectively [41]. These results suggest that the safety culture among nurses in Addis Ababa hospitals is not significantly different from other hospital units. While the findings of this study are comparable to other domestic studies, higher scores have been recorded in other low- and middle-income countries. Reported scores include China (65%), Iran (65.5%), Oman (58%), South India (58%), Saudi Arabia (61%), Taiwan (64%), and Yemen (67%) (35, 42). These differences may reflect variations in national safety policies and socioeconomic contexts. According to HSOPSC standards, none of the patient safety culture composites in this study qualified as areas of strength. Similar results were found in other hospital-based studies within Ethiopia (43, 44). This is likely due to the relatively recent focus on safety and quality of care in the country following efforts to achieve universal coverage.
This study identified multiple areas requiring improvement. The highest scoring dimensions, 'Teamwork within units' and 'Organizational learning–continuous improvement,' scored 70.1% and 65%, respectively. Although the highest, these scores still fall below the HSOPSC threshold of 75% to be considered areas of strength. In contrast, these dimensions were classified as areas of strength in countries like China (84% & 88%) and Taiwan (94% & 84%) [42, 45]. Conversely, the lowest scoring dimensions were 'Communication openness' (50.8%) and 'Feedback and communication about error' (52.9%). These low scores indicate that staff members may fear criticism when reporting incidents. A similar pattern was observed in the Bale Zone, where 'Non-punitive response to error' scored just 31.2% [43]. Comparable findings were noted in studies from Jimma Zone (28.32%) (41), South India (41.2%) [46], and Iranian public hospitals (23.5%) [35]. Regarding safety grading, 27.3% of nurses rated their hospitals as having poor safety, while 42.5% rated them as excellent and 29.6% as very good. These results are similar to those from a Bale Zone survey, where 29% rated safety as poor and 38.3% as very good or excellent [43]. A study in Addis Ababa public hospitals reported that 37% rated their hospitals as excellent or very good in terms of patient safety [44], suggesting that acute care units are generally consistent in safety perceptions across facilities.
In Iran, 34.2% of emergency department nurses rated safety as excellent or very good [47], while a U.S. study found a much higher 76% rating for these categories [48]. One primary aim of this study was to assess incident reporting behavior and its associated factors among nurses. Incident reporting and learning from past experiences are critical for improving patient safety [49]. When asked about the number of incidents reported in the past year, half of the participants stated they had not filed any reports. This is lower than findings from Addis Ababa public hospitals, where two-thirds reported at least one incident [44], but aligns with U.S. data from 2016 (46) and exceeds Iran’s 78% non-reporting rate among emergency nurses [49]. Training was significantly associated with a greater likelihood of incident reporting. Nurses who received training were nearly twice as likely to report incidents. Ideally, nurses are trained to be transparent and accountable, including acknowledging any errors. In the traditional 'blame and shame' culture, errors were often wrongly attributed to incompetence or carelessn Improving patient safety culture in healthcare organizations is the first step in reducing medical errors and improving patient outcomes [39]. Tools that assess patient safety cultures, such as the HSOPSC, provide a standardized and comprehensive understanding of issues related to patient safety. These tools are increasingly used to track cultural changes over time [39, 40]. This study assessed the current status of patient safety culture in Addis Ababa public hospitals among nurses, with a specific focus on incident reporting culture. The findings showed that the overall positive response rate for all HSOPSC dimensions was 63%, which aligns with findings from similar studies conducted within the city and country. For instance, one study in public hospitals of Addis Ababa and another in Jimma Zone reported overall mean scores for positive perception of patient safety culture at 46% and 36.77% respectively [41]. These results suggest that the safety culture among nurses in Addis Ababa hospitals is not significantly different from other hospital units. While the findings of this study are comparable to other domestic studies, higher scores have been recorded in other low- and middle-income countries. Reported scores include China (65%), Iran (65.5%), Oman (58%), South India (58%), Saudi Arabia (61%), Taiwan (64%), and Yemen (67%) (35, 42). These differences may reflect variations in national safety policies and socioeconomic contexts. According to HSOPSC standards, none of the patient safety culture composites in this study qualified as areas of strength. Similar results were found in other hospital-based studies within Ethiopia (43, 44). This is likely due to the relatively recent focus on safety and quality of care in the country following efforts to achieve universal coverage.
This study identified multiple areas requiring improvement. The highest scoring dimensions, 'Teamwork within units' and 'Organizational learning–continuous improvement,' scored 70.1% and 65%, respectively. Although the highest, these scores still fall below the HSOPSC threshold of 75% to be considered areas of strength. In contrast, these dimensions were classified as areas of strength in countries like China (84% & 88%) and Taiwan (94% & 84%) [42, 45]. Conversely, the lowest scoring dimensions were 'Communication openness' (50.8%) and 'Feedback and communication about error' (52.9%). These low scores indicate that staff members may fear criticism when reporting incidents. A similar pattern was observed in the Bale Zone, where 'Non-punitive response to error' scored just 31.2% [43]. Comparable findings were noted in studies from Jimma Zone (28.32%) (41), South India (41.2%) [46], and Iranian public hospitals (23.5%) [35]. Regarding safety grading, 27.3% of nurses rated their hospitals as having poor safety, while 42.5% rated them as excellent and 29.6% as very good. These results are similar to those from a Bale Zone survey, where 29% rated safety as poor and 38.3% as very good or excellent [43]. A study in Addis Ababa public hospitals reported that 37% rated their hospitals as excellent or very good in terms of patient safety [44], suggesting that acute care units are generally consistent in safety perceptions across facilities.
In Iran, 34.2% of emergency department nurses rated safety as excellent or very good [47], while a U.S. study found a much higher 76% rating for these categories [48]. One primary aim of this study was to assess incident reporting behavior and its associated factors among nurses. Incident reporting and learning from past experiences are critical for improving patient safety [49]. When asked about the number of incidents reported in the past year, half of the participants stated they had not filed any reports. This is lower than findings from Addis Ababa public hospitals, where two-thirds reported at least one incident [44], but aligns with U.S. data from 2016 (46) and exceeds Iran’s 78% non-reporting rate among emergency nurses [49]. Training was significantly associated with a greater likelihood of incident reporting. Nurses who received training were nearly twice as likely to report incidents. Ideally, nurses are trained to be transparent and accountable, including acknowledging any errors. In the traditional 'blame and shame' culture, errors were often wrongly attributed to incompetence or carelessness, leading to emotional distress among healthcare professionals [50]. Staff often feel guilty, frustrated, and fearful of legal consequences when reporting incidents. Despite the desire to be transparent, few are trained to disclose unanticipated outcomes or medical errors effectively. In fact, evidence suggests some professionals are still taught to avoid discussing adverse events [51]. This study confirms that trained nurses were nearly twice as likely to report incidents compared to untrained peers, supporting similar findings from local and international studies [35, 43].
The importance of education and training in enhancing patient safety and healthcare quality is well-documented. Safety curricula have shown to increase knowledge and improve processes worldwide [51]. Another significant factor associated with incident reporting was the nurse’s educational level. Degree-holding nurses were 2.37 times more likely to report incidents compared to diploma-holding staff. Studies in Jordan also found that nurses were significantly more likely than physicians to know the local reporting system and complete a report [49]. In six South Australian hospitals, nurses were twice as likely to know how to access, complete, and submit incident reports compared to physicians [51]. In a U.S. study, 89% of incidents were reported by nurses, while only 1.9% were reported by physicians [46]. Similar findings emerged from a general surgery department in the United Kingdom, where nurses were more familiar with the reporting system and had completed reports more frequently than doctors [52].
Healthcare Research and Quality (AHRQ), overall patient safety scores and average safety culture composite scores in Addis Ababa public hospitals were low. The rate of adverse event reporting among nurses was poor, largely due to fear of punitive responses. Incident reporting was more frequent among nurses who had received training and those with higher educational qualifications.
Limitations and Strengths of the Study
Limitations: Using an English questionnaire may have led to misunderstandings. The study only included diploma-level nurses and above in public hospitals, excluding other healthcare staff. The cross-sectional design limits the ability to infer causality. Additionally, the reliance on self-reported data introduces the possibility of reporting bias.
Strengths: This is the first study specifically examining patient safety incident reporting among nurses in Addis Ababa. A standardized assessment tool was used, with careful adherence to recommended guidelines for data collection and analysis.
Declarations
Acknowledgement
We extend our sincere appreciation to the Department of Public Health, Yekatit 12 Hospital Medical College, as well as the data collectors and study participants, for their invaluable support and contributions.
Author Contributions
Solomon Negewo conceptualized the study, conducted initial data analysis, and finalized the manuscript. Alemu Kibret contributed to data analysis, manuscript writing, and review.
Funding
This study received no external funding.
Availability of Data and Materials
The datasets generated during this study are available from the corresponding author upon reasonable request.
Ethical Approval and Consent to Participate
Ethical approval was obtained from the Research Ethics Review Board of Yekatit 12 Hospital Medical College. Written informed consent was secured from all participants, and for those unable to read, consent was obtained through legally authorized representatives.
Competing Interests
The authors declare no competing interests.
Consent for Publication
Not applicable.
Author Details
Addis Ketema Sub-City Health Office, Woreda 10 Health Center, Addis Ababa, Ethiopia.
Department of Public Health, Yekatit 12 Hospital Medical College, Addis Ababa, Ethiopia.
References
- Jha, A. K., Audera-Lopez, C., Prasopa-Plaizier, N., Waters, H., & Bates, D. W. (2016). The global burden of unsafe medical care: Analytic modelling of observational studies. BMJ Quality & Safety, 10(22):809–815.
Publisher | Google Scholor - Camargo, C. A. T. C., Sullivan, A. F., Cleary, P. D., Gordon, J. A., Guadagnoli, E., et al. (2018). Safety climate and medical errors in 62 US emergency departments. Annals of Emergency Medicine.
Publisher | Google Scholor - World Health Organization (WHO). (2014). Definitions of key concepts from the WHO patient safety curriculum guide.
Publisher | Google Scholor - Mitchell, P. H. (2018). Patient safety and quality. In Patient safety and quality: An evidence-based handbook for nurses (Section I).
Publisher | Google Scholor - [DJ]. (2014). What is a patient safety incident? Open Disclosure Handbook, 9–11.
Publisher | Google Scholor - Brunsveld-Reinders, A. H. A. M., De Vos, R., & De Jonge, E. (2016). Incident and error reporting systems in intensive care: A systematic review of the literature. International Journal for Quality in Health Care, 2(18):2–13.
Publisher | Google Scholor - Agegnehu, W. A. A., Ololo, S., & Melese, D. (2019). Incident reporting behaviors and associated factors among health care professionals working in public hospitals in Addis Ababa, Ethiopia, 8(5):182–187.
Publisher | Google Scholor - Addis Ababa University School of Nursing and Midwifery. (2018). Assessments of magnitude and contributing factors of medication administration error among nurses in tertiary hospitals, Addis Ababa, Ethiopia.
Publisher | Google Scholor - TE. (2019). What's new in the patient safety world August 2019: How often do preventable errors occur?
Publisher | Google Scholor - South African National Department of Health. (2017). National guideline for patient safety incident reporting and learning in the public health sector.
Publisher | Google Scholor - World Health Organization. (2004). World Alliance for Patient Safety: Forward Programme.
Publisher | Google Scholor - El-Menyar, E. M. (n.d.). Patient safety in developing and transitional countries: New insights from Africa and the Eastern Mediterranean.
Publisher | Google Scholor - World Health Organization. (2015). Patient safety in developing countries: Retrospective estimation of scale and nature of harm to patients in hospital.
Publisher | Google Scholor - Nie, Y., Mao, X., Cui, H., He, S., & Zhang, M. (2013). Hospital survey on patient safety culture in China. BMC Health Services Research, 13(1).
Publisher | Google Scholor - World Health Organization. (n.d.). Europe – Patient safety data and statistics.
Publisher | Google Scholor - Makary, M. A., & Daniel, M. (2014). How many die from medical mistakes? Scientific American, 9:20.
Publisher | Google Scholor - Pan American Health Organization. (2018). Patient safety: Global action on patient safety.
Publisher | Google Scholor - OECD. (1993). The economics of patient safety.
Publisher | Google Scholor - Poorolajal, J. R. S., & Aghighi, N. (2015). Barriers to medical error reporting. International Journal of Preventive Medicine.
Publisher | Google Scholor - Fordyce, J. A., Pekow, P., Smithline, H., Ritter, G., & Gehlbach, S. (2013). Errors in a busy emergency department.
Publisher | Google Scholor - Forster, A. J., Van Walraven, C., & Stiell, I. (2017). Adverse events following an emergency department visit. Quality and Safety in Health Care, 16(1):17–22.
Publisher | Google Scholor - Vincent, C. A. (2015). The safety and quality agenda in critical care medicine. Intensive Care Medicine 10 Years, 61–69.
Publisher | Google Scholor - Leape, L. L. (2004). Error in medicine. JAMA, 272:1851–1857.
Publisher | Google Scholor - Mekonnen, A. B. (2017). Hospital survey on patient safety culture in Ethiopian public hospitals: A cross-sectional study.
Publisher | Google Scholor - Hall, M. E., Smith, S. M., & Gorski, J. D. (2013). Development of a theory-based safety climate instrument, 9(1):58–69.
Publisher | Google Scholor - Ministry of Health, Federal Democratic Republic of Ethiopia. (2014). Health Sector Development Programme.
Publisher | Google Scholor - Chuang, P. C., & Yang, C. (2013). A multi-level patient safety culture effect on safety performance: The case of nurses, 13(1).
Publisher | Google Scholor - Barrow, M. (2012). Measuring the current patient safety culture in the Gambian public hospitals.
Publisher | Google Scholor - Snijders, C., van Lingen, R., Fetter, W. P. F., & Molendijk, H. (2009). Which aspects of safety culture predict incident reporting behavior in neonatal intensive care units? On behalf of the NEOSAFE Study Group.
Publisher | Google Scholor - District Hospital, South Africa. (2016). Patient safety culture in a district hospital: An issue of quality.
Publisher | Google Scholor - EHE. (2016). Incident reporting behaviors and associated factors among nurses working in Gondar University Comprehensive Specialized Hospital, Northwest Ethiopia. Scientifica (Cairo).
Publisher | Google Scholor - Ajri-Khameslou, M. A. S., Hosein Pishgooie, A., Jafari-Golestan, N., & Farokhnezhad Afshar, P. (2018). Factors affecting reporting of nursing errors: A qualitative content analysis study. Annals of Medical and Health Sciences Research, 5:215–219.
Publisher | Google Scholor - Al-Assaf, S. (2016). Medical error reporting attitudes of healthcare personnel, barriers and solutions: A literature review. Journal of Nursing Care, 5(6).
Publisher | Google Scholor - Agegnehu, W. (2017). The influence of patient safety culture on incident reporting among health care professionals working in public hospitals in Addis Ababa, Central Ethiopia. Ethiopian Medical Journal.
Publisher | Google Scholor - Khoshakhlagh, A. H., Akbarzadeh, I., Yazdanirad, S., & Sheidaei, A. (2019). Analysis of affecting factors on patient safety culture in public and private hospitals in Iran. BMC Health Services Research, 19(1):1–14.
Publisher | Google Scholor - AACAH. (2024). Human resource of nurses and total hospital statistics.
Publisher | Google Scholor - Sorra, J. G., & Streagle, S. (2016). AHRQ hospital survey on patient safety culture.
Publisher | Google Scholor - Mekonnen, A. B., Brien, J. E., Mekonnen, D., & Abay, Z. (2017). Hospital survey on patient safety culture in Ethiopian public hospitals: A cross-sectional study. Safety in Health, 3(1):1–11.
Publisher | Google Scholor - Nekoei-Moghadam, M. R., & Heidarijamebozorgi, M. (2019). Patient safety culture in university hospital emergency departments: A case study. International Journal of Health Planning and Management.
Publisher | Google Scholor - Burström, L., Engström, M. L., Berglund, A., & Enlund, M. (2014). Patient safety culture as perceived by staff at two different emergency departments. BMC Health Services Research, 14(1).
Publisher | Google Scholor - Belay Gizaw, A. B., & Tamiru Negese, D. (2018). Perception towards patient safety practice and associated factors among health care providers of Jimma zone public hospitals. Advances in Tech Biology & Medicine, 6(3).
Publisher | Google Scholor - Nie, Y., Mao, X., Cui, H., He, S., Li, J., & Zhang, M. (2013). Hospital survey on patient safety culture in China. BMC Health Services Research, 13, Article 228.
Publisher | Google Scholor - Kumbi, H. M. A., Lette, A., Nuriye, S., & Morka, G. (2020). Patient safety culture and associated factors among health care providers in Bale Zone hospitals, Southeast Ethiopia: An institutional-based cross-sectional study. Drug, Healthcare and Patient Safety, 12:1–14.
Publisher | Google Scholor - Mekonnen, A. B., Brien, J. E., Mekonnen, D., & Abay, Z. (2017). Hospital survey on patient safety culture in Ethiopian public hospitals: A cross-sectional study. Safety in Health, 3(1):Article 11.
Publisher | Google Scholor - Chen, I. C., & Li, H. (2010). Measuring patient safety culture in Taiwan using the Hospital Survey on Patient Safety Culture. BMC Health Services Research, 10.
Publisher | Google Scholor - Rajalatchumi, A. R. T., Muruganandham, K., Thulasingam, M., Selvaraj, K., & Reddy, M. M. (2018). Perception of patient safety culture among healthcare providers in a tertiary care hospital, South India. Journal of Natural Science, Biology and Medicine, 9:14–18.
Publisher | Google Scholor - Farsaraei, L. M. (2017). Patient safety culture from the perspective of emergency nurses, 15(10):289–295.
Publisher | Google Scholor - Westat, S. J., Famolaro, T., & Dyer, M. (2010). Hospital survey on patient safety culture: User comparative database report, 1–78.
Publisher | Google Scholor - AbuAlRub, R. F. A.-A. N., & Alatari, N. H. (2019). Perceptions of reporting practices and barriers to reporting incidents among registered nurses and physicians in Jordanian hospitals. Journal of Clinical Nursing.
Publisher | Google Scholor - Evans, S. M., Smith, B. J., Esterman, A., Selim, P., & O'Shaughnessy, J. (2006). Attitudes and barriers to incident reporting: A collaborative hospital study. Quality and Safety in Health Care.
Publisher | Google Scholor - Wu, A. W. B. I. P. S. (2019). A new basic science for professional education. GMS Journal for Medical Education, 36(2):1–15.
Publisher | Google Scholor - Kreckler, S., McCulloch, P., & Handa, A. (2009). Factors influencing incident reporting in surgical care. Quality and Safety in Health Care, 18:116–120.
Publisher | Google Scholor