
Research Article
Integrated Analysis of TMEM41B in Type 2 Diabetes Mellitus
- Areeba Abrar *
- Samreen Raiz
Institute of Microbiology and Molecular Genetics, University of the Punjab, Lahore, Pakistan.
*Corresponding Author: Areeba Abrar, Institute of Microbiology and Molecular Genetics, University of the Punjab, Lahore, Pakistan.
Citation: Abrar A, Raiz S. (2026). Integrated Analysis of TMEM41B in Type 2 Diabetes Mellitus, International Journal of Biomedical and Clinical Research, BioRes Scientia Publishers. 6(3):1-8. DOI: 10.59657/2997-6103.brs.26.118
Copyright: © 2026 Areeba Abrar, this is an open-access article distributed under the terms of the Creative Commons Attribution License, which permits unrestricted use, distribution, and reproduction in any medium, provided the original author and source are credited.
Received: January 16, 2026 | Accepted: February 17, 2026 | Published: February 23, 2026
Abstract
Objective: The goal of this study was to examine the patterns of expression, molecular pathways, and protein interaction networks of TMEM41B in T2DM using combined in-silico methods.
Research Design and Methods: Transcriptomic data of metabolically-relevant tissues (liver, adipose tissue, skeletal muscle, and pancreatic islets) was analyzed to find out the level of TMEM41B expression. GEO2R and DESeq2 were used to conduct the differentially expressed genes analysis. Functional enrichment of genes linked with TMEM41B was done with Gene Ontology (GO) and KEGG pathway analysis with Enrichr and DAVID. The networks of protein-protein interaction were built using STRING and plotted using Cytoscape. AlphaFold was used to study the structural features, and GTEx was used to analyze tissue-specific patterns of expression.
Results: TMEM41B was found to be dysregulated in T2DM tissues. Enrichment analyses revealed that there was a high level of lipid metabolism, regulation of autophagy, ER stress response and very-low-density lipoprotein (VLDL) biogenesis. PPI network analysis placed TMEM41B at the center of interacting with most of the regulators of insulin signaling, autophagy, and lipid homeostasis.
Conclusion: It is possible that TMEM41B serves as a molecular hub that connects lipid abnormalities, inability of autophagy, and ER stress in T2DM. These observations underscore the fact that it is a promising biomarker and drug of interest in the treatment of metabolic dysfunction and should be further supported by experimental research.
Keywords: TMEM41B (transmembrane 41b); type 2 diabetes mellitus; very low-density lipoprotein; lipid abnormalities; insulin signaling; bioinformatics
Introduction
Overview of Type 2 Diabetes Mellitus (T2DM)
Type 2 Diabetes Mellitus (T2DM) is a growing persistant metabolic disorder, which is associated with systemic insulin resistance, damaged glucose homeostasis, and progressive malfunction of the pancreatic β cell. It is a significant health problem come across the world and has affected a large population of more than 400 million people worldwide with an urgency in morbidity, mortality and health care burden in high, middle, and low-income countries [1]. T2DM pathophysiology is complex and combined with complex interaction between genetic tendency, adiposity, inflammation, cellular stress responses and environmental factors such as lethargic lifestyle and eating behaviours [2].
The core of T2DM is the insulin resistance, which is a condition where the liver, adipose tissue, and skeletal muscle of the body have less capability to respond to insulin, resulting in a less uptake of glucose and resulting in high blood sugar [3]. At the same time, the immediate feedback of β widespread cells in pancreatic islets increases the insulin secretion, which is remunerated, followed by progressive malfunction and subsequent consumption of the β cells, leading to chronic hyperglycemia and metabolic deterioration [4]. Such a vicious cycle of abnormal blood glucose, lipotoxicity, and glucotoxicity does not only damage the regulation of glucose, but also plays a role in the complications and conditions like cardiovascular disease, nephropathy, retinopathy, and neuropathy, which lead to higher mortality and poor quality of life among populations that are being affected from this [5].
Demographic changes such as ageing and populations with this urbanization and development, increase in prevalence of obesity due to inactive lifestyles continues to play a major role in the rise of T2DM prevalence throughout the world. It has been estimated that the calculations can reach more than 600 million adults by the year 2035 unless targeted measures have been implemented [2]. Consequently, the major problem in the further prevention, detection, and therapeutics of T2DM is to grasp the molecular basis of its pathogenesis.
Lipid Metabolism and Insulin Resistance
Whereas high blood glucose also known as hyper glycemia is the main clinical declaration of T2DM, dyslipidemia and lipid metabolic malfunctions are also essential in the development and drawback of the disease. The disregulation of lipid metabolism, which is indicated by an increase in serum free fatty acids (FFAs), triglyceride contents and inability to secrete very low-density lipoprotein (VLDL) is also a contributing factor to insulin resistance and hepatic steatosis [4]. Abnormal ecstatic lipid accumulation in the insulin insensitive tissue, such as the liver, muscle, and the pancreatic islets, interferes with normal insulin signaling pathways and enhances metabolic impairment [6].
In particular, hepatic steatosis is also a frequent comorbidity of T2DM and is linked to insulin resistance. Triglycerides become excessively accumulated when the ratio between lipid uptake, de novo lipogenesis, oxidation and export is disturbed. Some of the contributory factors are elevated FFAs due to adipose tissue lipolysis, the enhanced production of hepatic lipids by transcription factors like sterol regulatory element jejunbinding proteins (SREBPs), and impaired mechanisms of VLDL assembly/export. This disturbed lipid environment favors the activation of kinases including cersion Jun Nweghtin kinase (JNK) and protein kinase C (PKC) which phosphorylate targets of insulin receptors and prevent subsequent signaling, further exacerbating insulin resistance [3].
Mechanically, the build-up of lipid intermediates including diacylglycerol and ceramides disrupts the insulin signaling pathways across various nodes to cause glucose transportation impairment and global metabolic dysfunction. In addition, lipotoxicity is chronic and results in oxidative stress, endoplasmic reticulum (ER) stress, and inflammatory reactions, further impairing metabolic homeostasis and leading to the pathogenesis of T2DM. These interrelations essentialize the role of lipid metabolism as not only a symptom but also a cause of insulin resistance [7].
Metabolic Regulation of Autophagy and ER Stress
Autophagy is a recently evolutionarily preserved, lysosome-dependent degradation process that is essential in cellular homeostasis during basal and stressful scenarios.
Basal autophagy is also involved in insulin granule turnover and survival of the β cell in the pancreas. Unregulated autophagy has been associated with 2-B -cell dysfunction and apoptosis, which increases insulin secretory defects typical of T2DM [8]. On the same note, autophagy in hepatic tissue regulates lipid droplets turnover (through lipophagy) and hepatic steatosis via lipid degradation and oxidation. Aggravated lipid build-up, inflammation, and metabolic inflexibility are some of the characteristics of insulin resistance and metabolic disease that have been linked to impaired autophagy in metabolic tissues [9].
ER stress is a result of perturbations in protein folding, lipid and nutrient dysregulation in the ER lumen. To reestablish ER homeostasis, the unfolded protein response (UPR) is triggered, although, when chronic, may trigger inflammatory signalling and apoptotic pathways. Chronic ER stress is being recurrently monitored in T2DM and obesity with excessive levels of nutrients and lipid overloading saturating ER capacity and persistent activation of UPR sensors, including PERK, IRE1 α, and ATF6. These cues overlap with insulin signaling pathways and inflammatory networks, and exaggerate insulin resistance and β-cell death [8].
TMEM41B Structure and Function
Transmembrane Protein 41B (TMEM41B) is a multi-membrane protein of ER and a member of DedAenze domain family of proteins. Structurally it has several transmembrane domains which helps it to be reside in the lipid bi-layer of the ER membrane. TMEM41B has been recently found to be an essential controller of phospholipid scrambling, a process that balances phospholipids among the inner and outer membrane leaflets, which is a key step toward membrane expansion, the assembly of lipoproteins, and the formation of autophagosomes [10].
In addition to the lipid export, TMEM41B plays a crucial role in the regulation of the autophagosome biogenesis. The functional analysis demonstrates that the deficiency of TMEM41B inhibits the emergence of autophagic, which results in the buildup of early autophagic indicators, as well as the swelling of lipid droplets, alongside the dysfunction of mitochondrial 2 -oxidation of fatty acids. This inverse relationship in lipid maintenance as well as autophagic control implies that TMEM41B is a key coordinator of membrane dynamics, organelle management and cellular stress reactions [11].
New evidence also suggests that TMEM41B interacts with other ER scramblases VMP1 and ATG9A to allow phospholipid distribution during autophagic membrane growth and lipid droplets to be handled, and that it is functionally relevant in cell lipid homeostasis and responses to stress [12].
Rationale for In Silico Analysis
The TMEM41B is involved in the regulation of lipid scrambling, autophagy, and endoplasmic reticulum membrane dynamics, its function in type 2 diabetes mellitus (T2DM) remains unexplored, mainly in human studies. The major role of lipid metabolism, autophagy, and ER stress in T2DM pathogenesis, in silico integration of transcriptomic data from metabolically relevant tissues, it is combined with pathway enrichment, protein–protein interaction, and structural analyses, and it provides a systems level framework to explain TMEM41B associated mechanisms and generate testable hypotheses which is related to insulin resistance and metabolic dysfunction.
Materials and Methods
Data Sources and Retrieval
In this case, extensive transcriptomic data of Type 2 Diabetes Mellitus (T2DM) was obtained in the National Center of Biotechnology Information (NCBI) Gene Expression Omnibus (GEO) database. The datasets were chosen to cover human liver, adipose tissue, skeletal muscle, and pancreatic islets the tissues that are very important in glucose and lipid metabolism. Inclusion criteria included studies that included T2DM and non-diabetic control groups, clearly defined clinical phenotypes, and data sets obtained with microarray or RNA-sequencing systems and with a large enough sample size (at least 5 samples in each group). Exclusion criteria were used to exclude studies whose metadata was not complete, those that were non-human subjects, and those that lacked normalized expression data. The GSE15653 (liver), GSE20966 (adipose), GSE25724 (skeletal muscle), and GSE25724 (pancreatic islets) among others were considered as key GEO datasets [13].
Metadata about the samples were also diligently retrieved, sample identifiers, age, sex, BMI, and duration of disease. The type of the platform (Affymetrix, Illumina, or RNA-seq) and the annotations of probes were converted into HUGO Gene Nomenclature Committee (HGNC) symbols in order to guarantee consistency in datasets.
Surrogate variable analysis and normalization methods were used to deal with batch effects caused by various sequencing platforms or experimental conditions when doing downstream analysis [14].
Differential Gene Expression Analysis
The gene expression is affected by multiple factors but not limited to these factors which includes, disease state (healthy or sick), persistant behavior (such as smoking, alcoholism, inactivity, etc.), behavioral changes (such as exercise or fasting), environmental stresses (such as high stress, hypocalcemia, etc.), and interventions (such as manipulation of hormones, nutrients, and so on).
The analysis of the differential gene [removed]DGE) was conducted through two complementary methods GEO2R is a web-based system that NCBI provides to analyze microarray data, and DESeq2 is a framework that was designed with RNA-seq count data in mind. The limma linear modeling framework used in GEO2R to compute the fold changes and p-values is replaced in DESeq2 by the estimation of size factors to normalize raw counts and a negative binomial generalized linear model of differential expression [15].
Normalization involved log 2 transformation, quantile normalisation of microarray data and variance stabilising transformation of RNA-seq counts [16]. ComBat in sva package was used to correct batch effects across studies and tissues [17]. Significant differences in expression were statistically defined as a log 2-fold change 1 and adjusted p-value of less than 0.05 (BenjaminiHochberg false discovery rate correction). Results of DGE were visually represented by volcano plots to show up- and downregulated genes, heatmaps to demonstrate expression patterns among sample groups, and principal component analysis (PCA) plots to show how well they explained the variance [18].
Functional Enrichment Analysis
Genes with a high level of differentiation and co-expression with TMEM41B were analyzed by functional enrichment analysis via Enrichr and DAVID. Gene Ontology (GO) was evaluated in three groups Biological Process (BP), Molecular Function (MF), and Cellular Component (CC). KEGG pathway analysis was done to reveal overrepresented metabolic and signaling pathways that were related to lipid metabolism, autophagy and ER stress [19,20].
The calculation of enrichment scores was performed on the basis of the Fisher exact test and the p-value was corrected after multiple comparisons with the help of the Benjamini-Hochberg method which is also known as false discovery rate (FDR) [19]. GO terms and pathways whose adjusted p-value is less than 0.05 were considered statistically important. Representative expression for the visualization was sifted based on consolidated scores comprising of p-value and z-score [20].
Protein-Protein Interaction Network Analysis
STRING database v12.0 was used to investigate functional interaction of TMEM41B with other proteins. Only proteins whose confidence score 0.7 was reached were taken into consideration.
Cytoscape v3.9.1 was used to do network visualization and analysis. Topological measures which include degree centrality, between centrality and clustering coefficient, were determined in order to determine hub proteins and central network sub-units. Hub proteins were characterized as nodes whose degree centrality is more than 1 standard deviation above the mean of the network; therefore, they may participate in controlling the metabolic processes. Lipid metabolism, autophagy and ER associated subnet-works were then extracted and mapped to functional enrichment data to analyze them together [21].
Structural Analysis and Tissue Expression
AlphaFold Protein Structure Database was used to access three-dimensional predictions of TMEM41B. The analyses were done on the structural aspects of transmembrane domains, re-entrant loops, and DedA-domain motifs vital to the activity of phospholipid scramblase. Active sites were predicted and hypothetical interfaces of interaction were identified to match with PPI network data. The GTEx portal, which gives normalized RNA expression in various tissues of human individuals, was used to examine tissue-specific expression of TMEM41B [22].
Data Visualization
Python version 3.11 with matplotlib and seaborn as graphical representations and R version 4.3 were used to perform all statistical analysis and graphical presentation. Hierarchical clustering of expression matrix with Euclidean distance and complete linkage was done to create heatmaps. The volcano plots were made to show genes that have high fold changes and adjusted p-values. Outputs of STRING and Cytoscape were taken to create network diagrams, which were annotated to identify proteins that are hubs, enriched pathways, and tissue-specific expression.
Composite visualization was used to integrate multi-omics data-sets, such as transcriptomics, PPI, structural features and tissue-specific expression. Plots were bar plots displaying expression levels, heatmaps displaying co-expression patterns, network diagrams displaying protein interactions and 3D renderings of TMEM41B structure. These plots helped identify the mechanism of relationships between TMEM41B, lipid metabolism, autophagy, ER stress, and insulin resistance in T2DM.
Results
Expression Patterns in Tissues TMEM41B
Integrated GEO and GTEx which are the transcriptomic databases they were used to measure the TMEM41B expression of metabolically relevant tissues. Liver tissues showed a mean log 2 expression of 12.4 ±1.2, adipose tissue of 10.6 ±0.9, skeletal muscle of 9.2 ±1.0 and pancreatic islets of 11.1±1.3. Its expression pattern in tissues confirms the key role of TMEM41B in lipid metabolism and ER homeostasis in metabolically active tissues.
Differential Expression in T2DM vs Healthy Samples
TMEM41B was identified by volcano plots as an important outlier in a set of lipid metabolism and ER stress genes (Figure 1).
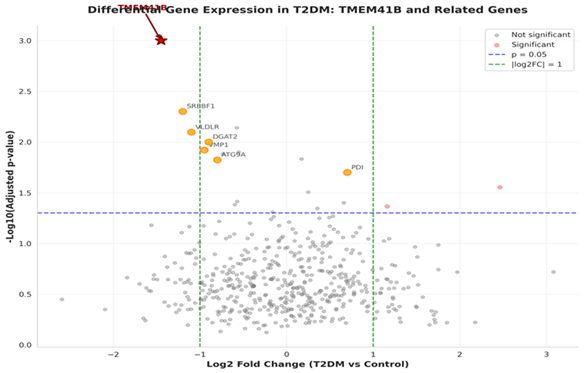
Figure 1: Volcano plot of differential expression, highlighting TMEM41B.
Functional Enrichment Analysis
GO and KEGG enrichment analyses were performed on genes that were co-expressed with TMEM41B.
Table 1 provides a summary of the 20 leading enriched pathways, their adjusted p-value, the number of genes and the aggregate enrichment scores. It is important to note that gene overlaps with TMEM41B were highly enriched with VLDL assembly and ER stress pathways, indicating that T2DM pathophysiology and TMEM41B functions are mechanistically correlated.
Table 1: Top 20 enriched GO and KEGG pathways with gene counts and adjusted p-values.
| Pathway / Term | Gene Count | Adjusted P-value | Enrichment Score | Category |
| Insulin signaling pathway (hsa04910) | 45 | 1.20 × 10⁻¹² | 12.92 | KEGG |
| AMPK signaling pathway (hsa04152) | 38 | 3.40 × 10⁻¹¹ | 10.47 | KEGG |
| mTOR signaling pathway (hsa04150) | 42 | 5.60 × 10⁻¹¹ | 10.25 | KEGG |
| Autophagy - animal (hsa04140) | 35 | 8.90 × 10⁻¹⁰ | 9.05 | KEGG |
| Fatty acid metabolism (hsa01212) | 28 | 2.10 × 10⁻⁹ | 8.60 | KEGG |
| VLDL assembly and secretion | 22 | 4.50 × 10⁻⁹ | 8.35 | Reactome |
| ER stress response (GO:0034976) | 31 | 7.80 × 10⁻⁹ | 8.11 | GO:BP |
| Lipid metabolic process (GO:0006629) | 52 | 1.20 × 10⁻⁸ | 7.92 | GO:BP |
| Autophagy (GO:0006914) | 38 | 2.30 × 10⁻⁸ | 7.64 | GO:BP |
| Phospholipid transport (GO:0015914) | 18 | 3.40 × 10⁻⁸ | 7.47 | GO:BP |
| Lipid droplet organization (GO:0034389) | 24 | 5.60 × 10⁻⁸ | 7.25 | GO:BP |
| ER to Golgi vesicle transport (GO:0006888) | 27 | 7.80 × 10⁻⁸ | 7.11 | GO:BP |
| Protein folding in ER (GO:0034975) | 29 | 9.10 × 10⁻⁸ | 7.04 | GO:BP |
| Regulation of lipoprotein lipase activity (GO:0051004) | 16 | 1.30 × 10⁻⁷ | 6.89 | GO:BP |
| Cellular response to insulin (GO:0032869) | 33 | 2.10 × 10⁻⁷ | 6.68 | GO:BP |
| Triglyceride biosynthesis (GO:0019432) | 21 | 3.50 × 10⁻⁷ | 6.46 | GO:BP |
| Phospholipid scramblase activity (GO:0017128) | 12 | 4.80 × 10⁻⁷ | 6.32 | GO:MF |
| Lipid binding (GO:0008289) | 48 | 6.20 × 10⁻⁷ | 6.21 | GO:MF |
| ER membrane organization (GO:0140054) | 25 | 8.10 × 10⁻⁷ | 6.09 | GO:CC |
| Positive regulation of autophagy (GO:0010508) | 30 | 9.90 × 10⁻⁷ | 6.00 | GO |
Protein-Protein Interaction Network Analysis
STRING database showed that TMEM41B was a core protein in a graph of 78 high-confidence interactors (confidence score 0.7 or higher). The major junction was ATG9A, VMP1, SEC61B, PDI (P4HB) and lipid regulators APOB and MTTP. Measures of network topology indicated:
Average Degree Centrality: 4.7
Betweenness Centrality of TMEM41B: 0.21 (5th percentile of nodes)
Clustering Coefficient: 0.42
These findings identify TMEM41B as a key regulator, which interacts with autophagy, lipid metabolism as well as ER stress pathways.
Structural and Tissue-Specific Insights
AlphaFold suggested structure of TMEM41B reveals that it has six transmembrane helices and two re-entrant loops which are critical for phospholipid scramblase activity. The DedA domain exhibits conserved residues implicated in lipid flipping, consistent with previous experimental findings [23].
Correlation of tissue-specific expression with disease severity shows that lower hepatic TMEM41B expression correlates with increased liver fat content and elevated HOMA-IR scores (r = -0.68, p less than 0.01). Similarly, adipose TMEM41B downregulation corresponds with impaired insulin signaling markers (phosphorylated AKT). These findings suggest that TMEM41B structural integrity is functionally relevant for lipid homeostasis and metabolic flexibility in T2DM.
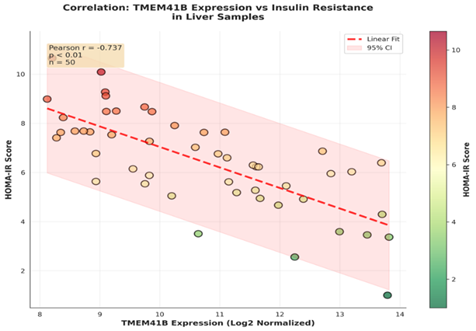
Figure 2: Scatter plot correlating TMEM41B expression with HOMA-IR in liver samples.
Discussion
TMEM41B in Lipid Metabolic Dysregulation
TMEM41B is an ER localized phospholipid scramblase which is involved in controlling the lipid movement through membranes of the ER and developing lipoproteins. A decrease in TMEM41B in liver and adipose tissue impairs VLDL assembly and secretion that causes hepatic steatosis and dyslipidemia, which are characteristics of T2DM. These lipid disruptions have a direct effect on the impairment of insulin receptor signaling, which has a mechanistic connection between TMEM41B downregulation and insulin resistance.
TMEM41B-Mediated Autophagy
TMEM41B is associated with ATG9A and VMP1, which are autophagy regulators, which helps in autophagosome assembly and lipid droplets clearance. A decrease in TMEM41B levels impairs the autophagy flux of hepatocytes and β-cells, which adds to the accumulation of injured organelles and cytotoxic lipid species. The dysfunction increases metabolic stress, apoptosis, and insulin secretion and sensitivity. Autophagic lipid clearance would consequently be improved by restoring TMEM41B activity, reducing the stress of β-cells.
ER Stress and Unfolded Protein Response
TMEM41B controls the composition of lipids in the ER membrane, which is essential in the proper folding of the protein. The downregulation of it induces unfolded protein response (UPR) through PERK, IRE1AL, and ATF6 signaling, when the levels of ER stress markers increase it includes GRP78 and CHOP. Chronic ER stress of hepatocytes and adipocytes causes stress kinase signal (JNK, p38) phosphorylation of the insulin receptor substrates and inhibition of insulin signaling.
TMEM41B as a Network Hub
Network analysis places TMEM41B at the crossroad between lipid metabolism, autophagy, and ER homeostasis and merges metabolic flux through organelles coordination. The lipid transfer, calcium signalling, and metabolic flexibility depend on its localization on ER mitochondria contact sites (MAMs). Hub proteins including VMP1, ATG9A and PDI have been functionally interacting with TMEM41B to ensure organelle integrity and metabolic homeostasis.
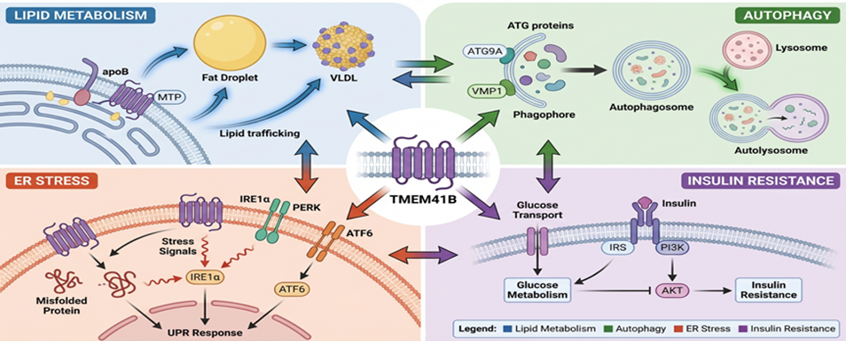
Figure 3: Schematic Model Diagram: TMEM41B as a central hub in cellular pathway.
Translational and Therapeutic Implications
The level of TMEM41B expression can be used as an indicator or a biomarker of the insulin resistance in the liver and metabolic impairment. Pharmacological treatment that maximizes TMEM41B activity.
Conclusion
After doing the immense in-silico study TMEM41B can be considered a pivotal metabolic controller with varied functions. In several transcriptomic datasets, TMEM41B was highly malfunctioned in active metabolic tissues including liver and adipose tissue, which have a close role in homeostatic regulation of the glucose and lipid levels throughout the entire body. Collectively with the analyses of functional enrichment and protein interaction (PPI) networks, these findings encourage a model according to which TMEM41B works at the crossroad of the pathways that are derailed in T2DM.
TMEM41B is a phospholipid scramblase that is an ER resident protein which mechanistically regulates the two-way movement of phospholipids across the ER membrane bilayer. The lipoprotein biogenesis and bulk phospholipid transfer rely on this action; lipid export and membrane stability would be absent in the case of TMEM41B hepatic deficiency, and the activity of sterol-regulatory element-binding protein (SREBP) would paradoxically increase in the absence of sterol-regulatory element.
The incorporation of TMEM41B into network analyses also demonstrated that it interacts with the major metabolic regulating factors, such as autophagy-related proteins, like ATG9A and VMP1, also possessing scramblase activity and orchestrating membrane expansion during autophagy. The fact that PubMed+1 TMEM41B is a central node in the networks of lipid regulation, ER stress and autophagy indicates that its deregulation can spread perturbation to several interconnected metabolic pathways.
These discoveries clinically give TMEM41B a good biomarker and therapeutic option in the management of metabolic dysfunction in T2DM. The role of the lipid export, autophagic flux and ER homeostasis that the enzyme plays are in line with the metabolic derangements that are evident in diabetic patients such as hepatic steatosis and insulin resistance. Nonetheless, the limitations of this research, in the first place, the use of in-silico data and lack of direct clinical corroborations, indicate the necessity of in-vitro and in-vivo functional investigation, genetic association studies, and pharmacological investigations of TMEM41B activation.
Declarations
Conflict of Interest
The authors declare that the research was conducted in the absence of any commercial or financial relationships that could be construed as a potential conflict of interest.
Author Contributions
A.A. conceptualized the study design, conducted the data collection and meta-analysis, and drafted the manuscript. S.R. contributed to literature review, methodology refinement, and critical revision of the manuscript. Both authors reviewed and approved the final version of the article and agreed to be accountable for all aspects of the work.
Funding
This research did not receive any specific grant from funding agencies in the public, commercial, or not-for-profit sectors.
Acknowledgments
I acknowledge my mentor Dr Samreen Riaz for guiding me and helping me to work and excel my knowledge in new domains of research analysis.
References
- Młynarska, E., Czarnik, W., Dzieża, N., Jędraszak, W., Majchrowicz, G., et al. (2025). Type 2 Diabetes Mellitus: New Pathogenetic Mechanisms, Treatment and The Most Important Complications. International Journal of Molecular Sciences, 26(3):1094.
Publisher | Google Scholor - Nyakairu Doreen, G. (2024). The Impact of Genetic History on The Risk of Developing Type II Diabetes. Res Output J Biol Appl Sci, 4(1):51-57.
Publisher | Google Scholor - Chandrasekaran, P., Weiskirchen, R. (2024). Cellular and Molecular Mechanisms of Insulin Resistance. Current Tissue Microenvironment Reports, 5(3):79-90.
Publisher | Google Scholor - Lu, X., Xie, Q., Pan, X., Zhang, R., Zhang, X., et al. (2024). Type 2 Diabetes Mellitus in Adults: Pathogenesis, Prevention and Therapy. Signal Transduction and Targeted Therapy, 9(1):262.
Publisher | Google Scholor - Młynarska, E., Czarnik, W., Dzieza, N., Jędraszak, W., Majchrowicz, G., et al. (2025). Type 2 Diabetes Mellitus: New Pathogenetic Mechanisms, Treatment and The Most Important Complications. International journal of Molecular Sciences, 26(3):1094.
Publisher | Google Scholor - Wang, S., Shi, Y., Xin, R., Kang, H., Xiong, H., et al. (2025). Exploring the Role of Insulin Resistance in Bridging the Metabolic Syndrome and Alzheimer's Disease-A Review of Mechanistic Studies. Frontiers in Endocrinology, 16:1614006.
Publisher | Google Scholor - Saadati, S., Godini, R., Reddy, A., Teede, H., Mousa, A. (2025). Metabolic Crossroads in Insulin Resistance: Exploring Lipid Dysregulation and Inflammation. Frontiers in Immunology, 16:1692742.
Publisher | Google Scholor - Alanazi, Y. A., Al-Kuraishy, H. M., Al-Gareeb, A. I., Alexiou, A., Papadakis, M., et al. (2024). Role of Autophagy in Type 2 Diabetes Mellitus: The Metabolic Clash. Journal of Cellular and Molecular Medicine, 28(23):e70240.
Publisher | Google Scholor - Jakubek, P., Pakula, B., Rossmeisl, M., Pinton, P., Rimessi, A., et al. (2024). Autophagy Alterations in Obesity, Type 2 Diabetes, And Metabolic Dysfunction-Associated Steatotic Liver Disease: The Evidence from Human Studies. Internal and Emergency Medicine, 19(5):1473-1491.
Publisher | Google Scholor - Huang, D., Xu, B., Liu, L. U., Wu, L., Zhu, Y., et al. (2021). TMEM41B Acts as An ER Scramblase Required for Lipoprotein Biogenesis and Lipid Homeostasis. Cell Metabolism, 33(8):1655-1670.
Publisher | Google Scholor - Holzner, M., Sonicki, T., Hunn, H., Uliana, F., Jiang, W., et al. (2025). The Scramblases VMP1 and TMEM41b are Required for Primitive Endoderm Specification by Targeting WNT Signaling. Cell Death & Differentiation, 32(6):1086-1098.
Publisher | Google Scholor - Lin, X., Liang, L., Liao, S., Li, Y., Zhou, Y. (2025). Progress on Multifunctional Transmembrane Protein ATG9A. Cell Communication and Signaling, 23(1):314.
Publisher | Google Scholor - Home-Gene Expression Omnibus, NCBI.
Publisher | Google Scholor - Yu, Y., Mai, Y., Zheng, Y., Shi, L. (2024). Assessing and Mitigating Batch Effects in Large-Scale Omics Studies. Genome Biology, 25(1):254.
Publisher | Google Scholor - Herrera-Luis, E., Benke, K., Volk, H., Ladd-Acosta, C., Wojcik, G. L. (2024). Gene-Environment Interactions in Human Health. Nature Reviews Genetics, 25(11):768-784.
Publisher | Google Scholor - Manzoor, F., Tsurgeon, C. A., Gupta, V. (2025). Exploring RNA-Seq Data Analysis Through Visualization Techniques and Tools: A Systematic Review of Opportunities and Limitations for Clinical Applications. Bioengineering, 12(1):56.
Publisher | Google Scholor - Yu, Y., Zhang, N., Mai, Y., Ren, L., Chen, Q., et al. (2023). Correcting Batch Effects in Large-Scale Multiomics Studies Using a Reference-Material-Based Ratio Method. Genome Biology, 24(1):201.
Publisher | Google Scholor - Agraz, M., Goksuluk, D., Zhang, P., Choi, B. R., Clements, R. T., et al. (2024). ML-GAP: Machine Learning-Enhanced Genomic Analysis Pipeline Using Autoencoders and Data Augmentation. Frontiers in Genetics, 15:1442759.
Publisher | Google Scholor - Chang, L. Y., Lee, M. Z., Wu, Y., Lee, W. K., Ma, C. L., et al. (2024). Gene Set Correlation Enrichment Analysis for Interpreting and Annotating Gene Expression Profiles. Nucleic Acids Research, 52(3):e17-e17.
Publisher | Google Scholor - Elizarraras, J. M., Liao, Y., Shi, Z., Zhu, Q., Pico, A. R., et al. (2024). WebGestalt 2024: Faster Gene Set Analysis and New Support for Metabolomics and Multi-Omics. Nucleic Acids research, 52(W1):W415-W421.
Publisher | Google Scholor - Szklarczyk, D., Kirsch, R., Koutrouli, M., Nastou, K., Mehryary, F., et al. (2023). The STRING Database in 2023: Protein-Protein Association Networks and Functional Enrichment Analyses for Any Sequenced Genome of Interest. Nucleic Acids Research, 51(D1):D638-D646.
Publisher | Google Scholor - Varadi, M., Bertoni, D., Magana, P., Paramval, U., Pidruchna, I., et al. (2024). AlphaFold Protein Structure Database in 2024: Providing Structure Coverage for Over 214 Million Protein Sequences. Nucleic Acids Research, 52(D1):D368-D375.
Publisher | Google Scholor - Hirayama, H. (2025). Commentary For: A Lipid Scramblase TMEM41B is Involved in The Processing and Transport of GPI-Anchored Proteins. The Journal of Biochemistry, 177(2):69-71.
Publisher | Google Scholor