
Research Article
Harnessing Box-Behnken Design for Next-Gen Orodispersible Tablets: A Leap Towards Superior Bioavailability
- Krutika Mandloi
- Akash Yadav *
- Dinesh Kumar Jain
IPS Academy College of Pharmacy, Indore, Madhya Pradesh, India.
*Corresponding Author: Akash Yadav, IPS Academy College of Pharmacy, Indore, Madhya Pradesh, India.
Citation: Mandloi K., Yadav A., Dinesh K. Jain. (2025). Harnessing Box-Behnken Design for Next-Gen Orodispersible Tablets: A Leap Towards Superior Bioavailability, Journal of Clinical Research and Clinical Trials, BioRes Scientia Publishers. 4(3):1-16. DOI: 10.59657/2837-7184.brs.25.053
Copyright: © 2025 Akash Yadav, this is an open-access article distributed under the terms of the Creative Commons Attribution License, which permits unrestricted use, distribution, and reproduction in any medium, provided the original author and source are credited.
Received: March 11, 2025 | Accepted: May 02, 2025 | Published: May 08, 2025
Abstract
Objective: In order to improve salbutamol sulphate's bioavailability, immediate response, and patient compliance, the Box-Behnken design was used for establishing orodispersible tablets. To arrive at an optimal formulation, the impact of a binder and natural superdisintegrants on crucial formulation parameters was examined.
Methods: The Box-Behnken design was used in the study to maximize the effectiveness of salbutamol sulfate orodispersible tablets. The superdisintegrants Lepidium sativum seed mucilage and Jackfruit seed starch, as well as the binder PVP K-30, were assessed. Extraction, pre-compressional, and post-compressional investigations were carried out. In order to identify the best formulation for increased bioavailability, response variables were examined.
Results: Salbutamol sulfate orodispersible tablets were examined for their organoleptic characteristics, size, shape, melting point, solubility, and calibration curve. 15 formulations were tested and their pre- and post-compressional properties analyzed. By recognizing critical elements influencing drug release, hardness, and disintegration time, the Box-Behnken design improved the formulation. Rapid disintegration (41.56 seconds), 90.87% drug release after 30 minutes, and appropriate hardness (3.357 kg/cm2) were all demonstrated by the optimized batch. By improving bioavailability and patient compliance, this formulation effectively treats respiratory diseases.
Conclusion: The enhanced salbutamol sulfate orodispersible tablets improved bioavailability and patient compliance by demonstrating quick breakdown (41.56 seconds) and 90.87% drug release in 30 minutes. The formulation enhanced tablet characteristics and therapeutic efficacy by utilizing PVP K-30 and natural superdisintegrants, making it a potentially patient-friendly method for managing respiratory diseases.
Keywords: respiratory diseases; customized orodispersible tablets; salbutamol sulphate; box-behnken design; jackfruit seed starch; lepidium sativum seed mucilage; PVP K30
Introduction
The respiratory system is the system of exchange of gases, i.e., the inhalation of oxygen and exhalation of carbon dioxide with the help of the lungs, trachea, and alveoli. The gaseous exchange, or any part of the respiratory system, is affected mainly by breathing difficulties, which causes respiratory diseases. The respiratory diseases are the third leading cause of death. Focusing on respiratory diseases is important because of their high prevalence, impact on quality of life, and economic burden. Respiratory diseases like asthma, COPD, bronchitis, etc. [1].
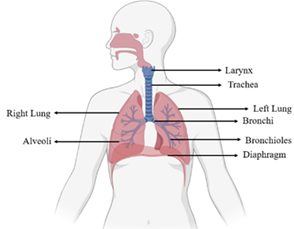
Figure 1: Respiratory system.
Asthma is a chronic respiratory disease that causes inflammation in the airways marked by bronchial hyperresponsiveness and reversible airflow obstruction, which makes it difficult to breathe, with symptoms including wheezing, shortness of breath, chest tightness, and coughing [2]. A common respiratory disease that affects both adults and children. The severity of disease is influenced by genetic factors, environmental triggers, and airway inflammation and remolding. There are many types of medication to treat asthma, like salbutamol sulphate [3].
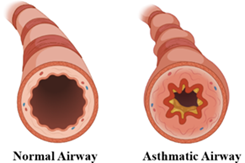
Figure 2: The normal airways and the asthmatic airways.
Salbutamol sulphate is a short-acting beta-2 adrenergic agonist used to treat asthma. It increases cyclic AMP, relaxes smooth muscles in the airways, and inhibits the production of mast cell mediators via activating beta-2 receptors. As the liver converts the medicine into an inactive form, innovative drug delivery methods aim to increase the drug's effectiveness while lowering its bioavailability [4]. The rapid oral dissolving of orodispersible tablets (ODTs) without the need for water improves patient adherence, especially for young, elderly, and dysphagic patients. When the tablets come into touch with saliva, they disintegrate quickly, allowing the drug to be released more quickly [5]. Stability, high drug loading, rapid breakdown, and the capacity to prevent the first-pass effect—which enhances bioavailability-are crucial features. The benefits include fewer adverse effects, enhanced safety because to lower asphyxiation risks, quicker drug absorption, higher bioavailability, and simplicity of usage for people who have trouble swallowing [6]. The initiative aims to develop salbutamol sulphate orodispersible pills to increase asthma therapy efficacy and patient adherence. The pills dissolve on the tongue without the need for water, which benefits patients of all ages. By employing super disintegrants, the formulation seeks to improve bioavailability and inhibit first-pass metabolism. Testing for thickness, hardness, dissolution, and dispersion time prior to and during compression will be part of the evaluation process [7].
Materials and Method
Salbutamol sulphate was obtained from IPS Academy College of Pharmacy, other chemicals like polyvinyl pyrrolidone k-30, talc, magnesium stearate, etc., are from Swarnaroop laboratories, and the natural ingredients like Jackfruit seed starch and Lepidium sativum are extracted in IPS Academy college of pharmacy Indore laboratories. All the chemicals are used of analytical grade.
Extraction of Jackfruit Seed Starch
The extraction of starch from the seeds of jackfruit
- The extraction of starch from jackfruit seeds can be done by using two different solvents, which are aqueous (distilled water) and alkali (sodium hydroxide) mediums.
- Extract the seeds from the jackfruit and make the powder of it.
- Weigh accurately about 5 g of jackfruit seed powder in two different beakers.
- Add the 100 ml of aqueous and alkali medium to the beakers separately.
- Put it at room temperature and stir constantly for 6-8 hrs.
- After 6-8 hrs. the slurry was found, and the slurry was passed through with the sieve number 212, and the sediment was washed with the distilled water consequently for three times.
- The collected filtrate was precipitated overnight with 10 ml acetone at 4°C.
- Then wash the obtained crude starch with water, and the supernatant was discarded.
- The obtained starch cake was dried for 24 hrs. at 40°C in the dryer.
- Then the obtained dry cake was ground in the pestle and mortar and then packed in an airtight container [8].
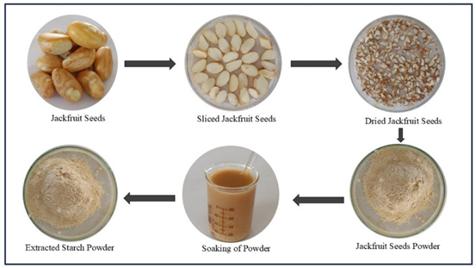
Figure 3: The extraction process of jackfruit seed starch.
Table 1: Organoleptic properties of jackfruit seed starch.
| S. No. | Evaluation Parameters | Results |
| 1 | Colour | Slightly Off-White |
| 2 | Odour | Neutral Odour |
| 3 | Taste | Mildly Starchy |
| 4 | Appearance | Fine |
| 5 | Nature | Hydrophilic |
| 6 | Melting Point | 69°C |
| 7 | pH | 6.9 |
| 8 | Swelling Index | 180 % |
| 9 | Water Absorption Ratio | 2.2 ml/g |
Extraction of Lepidium Sativum Seed Mucilage
The extraction of mucilage from the seeds of Lepidium sativum
- Weigh accurately about 50 g of Lepidium sativum seeds.
- Add the 400 ml of distilled water to the seeds and soak them for 12 hrs.
- Then the seeds (soaked seeds) were blended at 2000 rpm for 15-20 min.
- Then the obtained mix was filtered through the 8 folds of muslin cloth.
- Then again, blend the seeds by adding 100 ml of distilled water.
- They refilter it.
- The precipitation of the filtrate was done using 400 ml of acetone.
- Then filter out the precipitate, which gives the coagulant mass, using muslin cloth.
- Then the coagulant mass was dried in the dryer at 60°C for 16-18 hrs.
- Then spraying with the acetone to dry the mucilage to obtain the mucilage flakes from the petri dish.
- Then the obtained flakes were dried in a dryer at 60°C for 5 min.
- Then the obtained mass was ground in the pestle mortar and passed through the sieve number 80 and then packed in an airtight container [9].
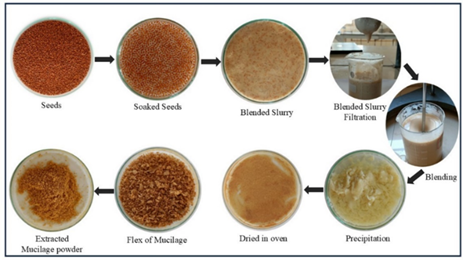
Figure 4: The extraction process of Lepidium sativum seeds mucilage.
Table 2: Organoleptic properties of lepidium sativum seed mucilage.
| S. No. | Evaluation Parameters | Results |
| 1 | Colour | Brown |
| 2 | Odour | Odourless |
| 3 | Taste | Tasteless |
| 4 | Appearance | Lustrous Amorphous |
| 5 | Nature | Hydrophilic |
| 6 | Melting point | 69°C |
| 7 | pH | 6.5 |
| 8 | Swelling Index | 351.5 |
| 9 | Water Absorption Ratio | 10.5 ml/gm |
Box-Behnken Design (BBD)
Box-Behnken design is the response surface methodology in which the three levels of a factor should be studied; that is, 1 (higher level), 0 (middle level), and -1 (lower level). BBD was used to make a polynomial model using design expert software by placing 3 dependent and 3 independent variables. The three independent variables, X1, X2, and X3, which are the concentration of jackfruit seed starch, concentration of lepidium sativum seed mucilage, and concentration of polyvinyl pyrrolidone K-30, were selected, respectively, as shown in the table.
Table 3: The table showing the independent variable and the levels that are selected.
| S. No. | Independent Variable | Levels | |
| 1(Higher Level) | -1(Lower Level) | ||
| 1 | Concentration of Jackfruit Seed Starch | 5 | 15 |
| 2 | Concentration of Lepidium Sativum Seed Mucilage | 2 | 8 |
| 3 | Concentration of Polyvinyl Pyrrolidone k-30 | 2 | 5 |
The response of the change of these three independent variables on three dependent variables, Y1, Y2, and Y3, which are disintegration time, in vitro drug release, and hardness of tablets, are studied as shown in the table.
Table 4: The table showing the dependent variable.
| S. No. | Dependent Variables | Units |
| 1 | Disintegration Time | Seconds |
| 2 | In-vitro Drug Release | Percent |
| 3 | Hardness | Kg/cm2 |
By selecting the three independent and three dependent variables, the design expert software gives the 15-formulation composition for these three independent variables, which was shown in the table. According to the design expert software, the composition for the formulation is provided, and according to this we can formulate the tablets by the direct compression method.
Table 5: The runs from the Box-Behnken design.
| Runs | Concentration of Jackfruit Seed Starch | Concentration of Lepidium Sativum Seed Mucilage | Concentration of Polyvinyl Pyrrolidone k-30 |
| 1 | 10 | 8 | 5 |
| 2 | 5 | 8 | 3.5 |
| 3 | 15 | 5 | 2 |
| 4 | 10 | 5 | 3.5 |
| 5 | 10 | 8 | 2 |
| 6 | 5 | 5 | 5 |
| 7 | 5 | 2 | 3.5 |
| 8 | 10 | 2 | 2 |
| 9 | 10 | 5 | 3.5 |
| 10 | 15 | 5 | 5 |
| 11 | 10 | 5 | 3.5 |
| 12 | 10 | 2 | 5 |
| 13 | 15 | 2 | 3.5 |
| 14 | 15 | 8 | 3.5 |
| 15 | 5 | 5 | 2 |
Formulation of Tablets
The formulation of orodispersible tablets of salbutamol sulphate is formulated using the direct compression method; the formula for making tablets is shown in the table. The procedure for formulating the orodispersible tablets of salbutamol sulphate by the direct compression method is given below.
- Weigh accurately the quantities of active pharmaceutical ingredient and the excipient according to the table.
- The weighed quantities of salbutamol sulphate, jackfruit seed starch, lepidium sativum seed mucilage, polyvinyl pyrrolidone k-30, and mannitol were ground in dry and clean mortar.
- Then all the ground ingredients are passed through sieve number 60.
- Then finally the talc and magnesium stearate were added and mixed for 5 minutes.
- Then the mixed ingredients of active pharmaceutical ingredients and excipients were compressed into tablets using a 6.5 mm punch in the Karnavati tablet compression machine.
- Then the evaluation was done of tablets.
Table 6: Formulation table for all 15 batches of salbutamol sulphate orodispersible tablets.
| Formulation | OT 1 | OT 2 | OT 3 | OT 4 | OT 5 | OT 6 | OT 7 | OT 8 | OT 9 | OT 10 | OT 11 | OT 12 | OT 13 | OT 14 | OT 15 |
| Salbutamol sulphate | 8 | 8 | 8 | 8 | 8 | 8 | 8 | 8 | 8 | 8 | 8 | 8 | 8 | 8 | 8 |
| Jackfruit seed starch | 10 | 5 | 15 | 10 | 10 | 5 | 5 | 10 | 10 | 15 | 10 | 10 | 15 | 15 | 5 |
| Lepidium sativum seed mucilage | 8 | 8 | 5 | 5 | 8 | 5 | 2 | 2 | 5 | 5 | 5 | 2 | 2 | 8 | 5 |
| Polyvinyl pyrrolidone k-30 | 5 | 3.5 | 2 | 3.5 | 2 | 5 | 3.5 | 2 | 3.5 | 5 | 3.5 | 5 | 3.5 | 3.5 | 2 |
| Mannitol | 66 | 72 | 67 | 70.5 | 69 | 74 | 78.5 | 75 | 70.5 | 64 | 70.5 | 72 | 68.5 | 62.5 | 77 |
| Magnesium stearate | 2 | 2 | 2 | 2 | 2 | 2 | 2 | 2 | 2 | 2 | 2 | 2 | 2 | 2 | 2 |
| Talc | 1 | 1 | 1 | 1 | 1 | 1 | 1 | 1 | 1 | 1 | 1 | 1 | 1 | 1 | 1 |
Pre-compressional Parameter
Organoleptic Properties
Firstly, the pre-compressional studies are a very important parameter, and the preformulation was started with the description of the drug substances. In the description of the drug substance, we observe the parameters like color, odor, taste, and nature. The terminology that we have to use for describing the color, odour, taste, and nature was shown in table.
Table 7: Terminology describing the organoleptic properties.
| Colour | Odour | Taste | Nature |
| Off-white | Aromatic | Bitter | Acidic |
| Cream yellow | Odourless | Sweet | Basic |
| Tan | Fruity | Tasteless | Lipophilic |
| Shiny | Pungent | Hydrophilic |
Particle Size Determination
The size determination is an important parameter in which the size of the particle present in a drug is determined. For the determination of particle size of the drug, there are different methods for determination, for example, microscopy, sieving, sedimentation technique, laser diffraction method, and permeametry technique.
Table 8: Techniques and particle size.
| S. No. | Techniques | Particle size (mm) |
| 1 | Microscopic | 1-100 |
| 2 | Sieve | >5 |
| 3 | Sedimentation | >1 |
| 4 | Elutriation | 1-50 |
| 5 | Centrifugal | lessthan 50 |
| 6 | Permeability | >1 |
| 7 | Light Scattering | 0.5-50 |
Melting Point
The melting point of a compound is a physical constant that is defined as the temperature at which the compound can change its state from its solid state to its liquid state. Melting point can be used to identify the compound. The melting point of salbutamol sulphate was determined using the melting point apparatus in which the capillary is used. Firstly, one end of the capillary was closed, and then the salbutamol sulphate was filled in the capillary tubes. Then the capillary tubes were placed in the melting point apparatus with the thermometer. And the temperature at which the salbutamol sulphate changes its state from solid to liquid state was noted. For the accuracy in the melting point, the three consecutive temperatures were noted, and the average value of the temperature was represented as the melting point of the salbutamol sulphate.
Solubility
Solubility is defined as the maximum amount of a solute that can be dissolved in the given amount of the solvent, making a saturated solution. Solubility can be determined by the shake flask method. According to this method, four different types of solvent were taken, and in four different vials, the maximum amount of solvent was poured in the vials individually, making a solution. And place aside for 24 hrs. After 24 hrs., if the solution was found to be in unsaturated form, then the heating was applied. After heating, the solution was filtered, and the solution was analyzed in UV spectrophotometry, and the solubility can be calculated.
Table 9: Description of solubility.
| Descriptive Term | Parts of Solvent Required for 1 Part of Solute | g/L in water | M=400 mol/L in Water | M=40000 mol/L in Water |
| Very Soluble | ≤1 | ≥1000 | ≥2,5 | ≥0,025 |
| Freely Soluble | 1 to 10 | 1000 to 100 | 2,5 to 0,25 | 0,025 to 0,0025 |
| Soluble | 10 to 30 | 100 to 33 | 0,25 to 0,08 | 0,0025 to 0,0008 |
| Sparingly Soluble | 30 to 100 | 33 to 10 | 0,08 to 0,025 | 0,0008 to 0,00025 |
| Slightly Soluble | 100 to 1000 | 10 to 1 | 0,025 to 0,0025 | 0,00025 to 0,0000025 |
| Very Slightly Soluble | 1000 to 10,000 | 1 to 0,1 | 0,0025 to 0,00025 | 0,000025 to 0,0000025 |
| Practically Insoluble | ≥10,000 | ≤0,1 | ≤0,00025 | ≤0,0000025 |
Bulk Characterization
A wide variety of pharmaceutical ingredients exist in multiphase forms called powders, which can be liquids as well as solids. One of the most important aspects of powder's physical characteristics is its individuality. For instance, a powder can be analyzed by its densities, flow properties, compressibility, etc.
Densities
Bulk Density
Bulk density of a powder or granules is the amount of powder weight that is present in a defined volume. The bulk density was determined by pouring the powder into the measuring cylinder, and the volume was noted. The bulk density was calculated using the formula

Tapped Density
Tapped density of a powder or granules is the amount of powder weight that is present in a defined volume after tapping or avoiding the voids present in it. The tapped density was determined by pouring the powder in the measuring cylinder, and the volume is noted after the 50 taps of the measuring cylinder. The tapped density is calculated using the formula

Powder Flow Properties
Compressibility Index
The compressibility is the ability to decrease the volume under the pressure. The compressibility is also known as the Carr’s index and is used to predict the flow property of powder, and it is predicted using the bulk and tapped density. The carr’s index is calculated using the formula

Table 10: Carr’s index and flowability.
| S. No. | Carr’s Index | Flowability |
| 1 | 5-15 | Excellent |
| 2 | 12-16 | Good |
| 3 | 18-21 | Fair possible |
| 4 | 23-35 | Poor |
| 5 | 33-38 | Very poor |
| 6 | >40 | Ver, very poor |
Hausner’s Ratio
Hausner’s ratio is used to determine the flow property of the powder or granules by the compressibility and compactibility. The compressibility can be defined as the ability to decrease the volume of powder under the pressure, and the compactibility can be defined as the ability of the powder to be compressed to a specific tensile strength into a tablet. The Hausner’s ratio can be determined using the bulk and tapped density. The Hausner’s ratio was calculated using formula

Table 11: Hausner’s ratio and flowability.
| S. No. | Hausner’ Ratio | Flowability |
| 1 | 1.05 - 1.18 | Excellent |
| 2 | 1.14 - 1.20 | Good |
| 3 | 1.22 - 1.26 | Fair possible |
| 4 | 1.30 – 1.54 | Poor |
| 5 | 1.50 – 1.61 | Very poor |
| 6 | >1.67 | Ver, very poor |
Angle of Repose
The angle of repose measures the resistance between the movement of particles, i.e., the frictional force within loose powder. The angle of repose (θ) was determined using the funnel method. The funnel was placed on the tripod stand at a fixed height above the graph paper. The funnel tip can be closed, and the powder is poured, and then the height of the pile and the diameter can be noted. The angle of repose can be calculated using formula

Table 12: Angle of repose and flow property.
| S. No. | Flow Property | Angle of Repose |
| 1 | Excellent | 25-30 |
| 2 | Good | 31-35 |
| 3 | Fair | 36-40 |
| 4 | Passable | 41-45 |
| 5 | Poor | 46-55 |
| 6 | Very poor | 56-65 |
| 7 | Very, very poor | >66 |
Calibration Curve
A calibration curve was used to determine the unknown sample’s concentration and to calculate the limit of detection and limit of quantitation. The standard curve was formulated using the set of standard samples at a range of concentrations from the responses found from the UV spectrophotometer. For preparing the calibration curve of salbutamol sulphate, firstly, prepare the stock solution (1000 µg) of the salbutamol sulphate using the phosphate buffer pH 6.8. Then the sub stock (100 µg) was prepared, and then the dilution was prepared using the sub stock solution of 10 to 50 µg/ml. The absorbance of all dilutions was observed using a UV-Visible spectrophotometer at a maximum wavelength of 272 nm [10-16].
Post-compressional Parameter
Organoleptic Properties
The organoleptic properties are simply the general appearance of the tablets in which the color, odor, and taste of the tablets are studied. Usually for the organoleptic properties, 10 tablets were studied.
Shape and Size
The shape and size are mainly the determination of the thickness and diameter of the tablets. The thickness and diameter are determined with the help of a vernier caliper or by the micrometer screw gauge. There are many automated machines in the market that measure the thickness and the diameter by only placing the tablets in the instrument, and the instrument gives the thickness and diameter of the tablet.
Weight Variation
The weight variation is an important parameter in the weight of a tablet. According to the IP, the weight variation is studied by taking 20 random tablets from the formulation batch and then weighing the individual and collective 20 tablets using a digital weighing balance. The average weight of one tablet was determined from the collective weight of the tablet. Then both the individual and average weight were compared.
Table 13: Weight variation and deviation.
| S. No. | USP | Max % difference allowed | IP / BP |
| 1 | 130mg > or less | ±10% | 80mg > or less |
| 2 | 130mg > 324 mg | ±7.5% | 80mg-250mg |
| 3 | 324 mg lessthan or more | ±5% | 250mg lessthan or more |
Hardness
The hardness of the tablets was determined using a Monsanto hardness tester. For the hardness of the tablets, three tablets from each formulation batch were randomly selected, and the individual tablet was placed in the Monsanto hardness tester, and after it, the pressure was applied to break the tablets, and the average reading was noted. The hardness of the tablet was measured in kg/cm². For the orodispersible tablets, the hardness was kept to be lower than the other tablets. The hardness for the orodispersible tablets should be in the range of 3-5 kg/cm².
Friability
The friability test of tablets was determined to assess the ability of the tablets to withstand the packaging, handling, and transportation of the tablets. Friability was the removal of the fine particles that were on the surface of the tablets in the container, due to which the weight of the tablets decreased. For testing the friability of the tablets, we use the Roche friabilator. The Roche friabilator consists of a plastic chamber that revolves at 25 rpm in which we place the tablets of 6.5 mg or nearer to it because the weight of the tablet is less than the 650 mg. The loss of the weight of tablets was measured and is expressed in percentage. The formulae for calculating the friability were

Wetting Time
Wetting time is the important parameter in the formulation of orodispersible tablets. Wetting time is the time taken for the tablets to disintegrate. Wetting time can indicate the inner structure of the tablets and the nature of excipient, i.e., hydrophilicity nature. The lower the value of the wetting time, the faster is the disintegration of tablets. The process to determine the wetting time was first to place a double-folded tissue paper in a small Petri dish and then pour 6 ml of phosphate buffer pH 6.8 into the Petri dish. Place the tablet on the tissue paper and note the time taken for the tablet for complete wetting. Three tablets were randomly selected for each formulation, and the average time was calculated.
Water Absorption Ratio
The water absorption ratio is the amount of water that is absorbed by the complete tablet. The process to measure the water absorption was taking a clean and dry Petri dish. Then place a twice- or thrice-folded tissue paper in the petridish and pour 6 ml of water in the petridish. Then put the weighed tablet on the tissue paper, and the time was measured to complete wetting. Then the wetted tablet was weighed. Three randomly selected tablets from each formulation were studied, and the average weight was taken. The formulae for calculating the water absorption ratio were

Where, Wa = the weight of tablet after water absorption; Wb = the weight of tablet before water absorption.
In-Vitro Disintegration Time
The disintegration test indicates how fast and efficiently a tablet breaks down into smaller particles in the liquid medium. The disintegration test is used to establish that the absorption of the drug by the body is not as had envisioned. The procedure to determine the disintegration time of tablets. First, the disintegration apparatus was maintained at 37°C ± 2°C, and the apparatus was filled with distilled water. Then randomly select the six tablets from each formulation and place them individually in the six cylinders of a disintegration test apparatus. Then the apparatus was operated, causing the up-and-down movement of the basket in the apparatus. Then the time is noted for the complete disintegration of each tablet. The average time was taken for the disintegration of the tablets.
In-Vitro Dissolution Test
The in vitro dissolution test is an important test in the post-compressional parameter. The in vitro dissolution test is used to determine the drug release profile. Here is the procedure to perform an in vitro dissolution test for the orodispersible tablets. For the orodispersible tablets, the in vitro dissolution test was performed by USP type II apparatus that is paddle type. The temperature of the water bath is maintained at 37°C ± 0.5°C, and the speed of the paddle was set at 50 rpm. The 500 ml of phosphate buffer pH 6.8 is poured in the vessel, which acts as a dissolution medium. A randomly selected tablet is placed in the vessel of the dissolution test apparatus. The 5 ml sample was withdrawn from the vessel at every 5-minute interval up to 30 minutes, and the sink condition should be maintained. The samples were filtered, and then the sample was analyzed in the UV-Visible spectrophotometer at 272 nm, and the absorbance is noted, and the percent drug release and the percent cumulative drug release are calculated.
Stability Studies
Stability studies are an important measure of evaluation for figuring out a product's shelf life or how weather-related elements can impact a final product's quality over time. Every salbutamol sulphate tablet formulation was subjected to a month-long stability test utilizing the Institute of Medicine's rapid study guidelines. In sealed glass containers, each sample was safely wrapped in aluminum foil. We subjected these tablets to three distinct temperature conditions. During 10-, 20-, and 30-day intervals, tablets were taken out of storage to be examined, with an emphasis on physical characteristics, drug concentration, and segregation patterns [17-22].
Result and Discussion
Organoleptic Properties
All the organoleptic properties, like color, odor, taste, etc., are studied of the drug, and those are mentioned in Table 14.
Table 14: Organoleptic properties of salbutamol sulphate.
| S. No. | Organoleptic Parameters | Results |
| 1 | Colour | A white to off-white |
| 2 | Odour | Odourless |
| 3 | Taste | Bitter taste |
| 4 | Crystallinity | Fine powder |
| 5 | Nature | Hydrophilic |
Shape and Size
On the evaluation of the salbutamol sulphate-formulated tablets, they were found to be circular in shape, and the size of the tablets was found to be 0.65 ± 0.05 cm.
Melting Points
While a study was done on the salbutamol sulphate, the melting point was determined using a melting point apparatus and was found to be 148.2 ± 0.5°C.
Solubility
The solubility of the salbutamol sulphate was determined in water, ethanol, and dichloromethane and mentioned in Table 15.
Table 15: Solubility of salbutamol sulphate.
| S. No. | Solvents | Solubility Range |
| 1 | Water | From 1 to 10 |
| 2 | Ethanol | From 100 to 1000 |
| 3 | Dichloromethane | From 1000 to 10,000 |
Calibration Curve
The calibration curve of the salbutamol sulphate was studied using the standard sample and the prepared dilutions in the phosphate buffer pH 6.8 as a solvent at 272 nm, and the results are shown in table 16, and the graph is shown in Figure 5.
Table 16: Calibration curve of salbutamol sulphate in phosphate buffer pH 6.8.
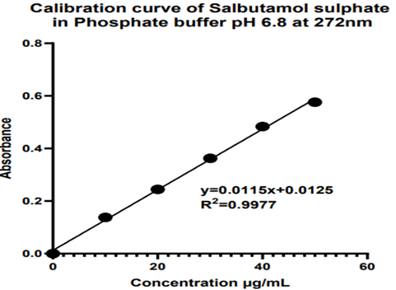
Figure 5: The calibration curve of Salbutamol sulphate at 272 nm.
Pre-compressional Evaluation
All the pre-compressional parameters, like bulk density, tapped density, Hausner’s ratio, Carr’s index, and angle of repose, are studied for all the 15 batches, and the results for all the 15 batches are shown in Table 17.
Table 17: Pre-compressional data of the formulation batches.
| Formulation Batch | Bulk Density (gm/ cm3) | Tapped Density (gm/ cm3) | Hausner’s Ratio (HR) | Carr’s Index (CI) | Angle of Repose(θ) |
| OT1 | 0.452 | 0.538 | 1.179 | 6.328 | 28 |
| OT 2 | 0.458 | 0.532 | 1.161 | 6.832 | 27 |
| OT 3 | 0.462 | 0.536 | 1.160 | 7.123 | 30 |
| OT 4 | 0.448 | 0.539 | 1.123 | 9.758 | 33 |
| OT 5 | 0.455 | 0.530 | 1.164 | 8.243 | 27 |
| OT 6 | 0.464 | 0.537 | 1.157 | 8.695 | 32 |
| OT 7 | 0.469 | 0.538 | 1.125 | 10.564 | 30 |
| OT 8 | 0.454 | 0.531 | 1.169 | 6.983 | 29 |
| OT 9 | 0.459 | 0.540 | 1.176 | 7.920 | 27 |
| OT 10 | 0.461 | 0.537 | 1.164 | 6.795 | 31 |
| OT 11 | 0.467 | 0.544 | 1.164 | 10.198 | 27 |
| OT 12 | 0.460 | 0.542 | 1.178 | 5.978 | 29 |
| OT 13 | 0.457 | 0.535 | 1.170 | 8.491 | 33 |
| OT 14 | 0.463 | 0.529 | 1.142 | 9.762 | 30 |
| OT 15 | 0.467 | 0.533 | 1.141 | 10.221 | 28 |
Post-Compressional Evaluation
All the post-compressional parameters like weight variation, thickness, hardness, wetting time, disintegration time, and friability were studied for all the 15 batches, and the results of all the 15 batches are shown in Table 18.
Table 18: Post-compressional data of the formulation batches.
| Formulation Batch | Weight Variation(mg) | Thickness (mm) | Hardness (kg/cm2) | Wetting Time (Sec) | Disintegration Time (sec) | Friability (%) |
| OT 1 | 100 | 6.2 | 3.4 | 6 | 49 | 0.15 |
| OT 2 | 101 | 6.2 | 4 | 4 | 51 | 0.17 |
| OT 3 | 104 | 6.2 | 3.1 | 7 | 44 | 0.13 |
| OT 4 | 101 | 6.2 | 3.8 | 5 | 42 | 0.25 |
| OT 5 | 98 | 6.2 | 3 | 6 | 45 | 0.26 |
| OT 6 | 97 | 6.2 | 4.2 | 4 | 47 | 0.12 |
| OT 7 | 100 | 6.2 | 3.5 | 5 | 42 | 0.16 |
| OT 8 | 100 | 6.2 | 2.9 | 3 | 44 | 0.19 |
| OT 9 | 95 | 6.2 | 3.9 | 7 | 40 | 0.23 |
| OT 10 | 100 | 6.2 | 4.3 | 6 | 48 | 0.24 |
| OT 11 | 105 | 6.2 | 3.8 | 6 | 38 | 0.22 |
| OT 12 | 100 | 6.2 | 4.4 | 7 | 37 | 0.13 |
| OT 13 | 103 | 6.2 | 3.6 | 5 | 45 | 0.15 |
| OT 14 | 100 | 6.2 | 3.2 | 5 | 50 | 0.21 |
| OT 15 | 99 | 6.2 | 3.4 | 4 | 43 | 0.14 |
In-Vitro Dissolution Studies
The in vitro dissolution studies are studied using electro lab dissolution apparatus in which we used the USP apparatus II (paddle type) at 50 rpm and the temperature was maintained at 37°C ± 2°C, and the absorbance was observed at every 5 min interval of time, and the sink condition was maintained. And the absorbance was observed using a UV spectrophotometer at 272 nm for all the 15 batches, and the results of all the 15 batches are shown in Table 19, and the figure shows the dissolution graph for drug release at the specified interval of time.
Table 19: In vitro dissolution test data of the salbutamol sulphate orodispersible tablets.
| Formulation Batch | 0 min | 5 min | 10 min | 15 min | 20 min | 25 min | 30 min |
| OT 1 | 0 | 23.412 | 39.216 | 47.412 | 58.53 | 81.942 | 95.425 |
| OT 2 | 0 | 22.942 | 38.237 | 45.885 | 57.355 | 80.297 | 91.77 |
| OT 3 | 0 | 23.377 | 38.962 | 46.755 | 58.442 | 81.819 | 93.501 |
| OT 4 | 0 | 22.667 | 37.778 | 45.334 | 56.667 | 79.334 | 90.668 |
| OT 5 | 0 | 21.889 | 36.214 | 42.977 | 54.723 | 76.661 | 85.955 |
| OT 6 | 0 | 21.969 | 36.614 | 43.937 | 54.922 | 76.891 | 87.874 |
| OT 7 | 0 | 21.224 | 35.373 | 42.447 | 53.06 | 74.284 | 84.894 |
| OT 8 | 0 | 22.487 | 37.478 | 44.975 | 56.217 | 78.704 | 89.955 |
| OT 9 | 0 | 21.585 | 35.974 | 43.169 | 53.962 | 75.547 | 86.339 |
| OT 10 | 0 | 24.046 | 40.075 | 48.091 | 60.115 | 84.161 | 96.183 |
| OT 11 | 0 | 22.249 | 37.082 | 44.499 | 55.623 | 77.872 | 88.998 |
| OT 12 | 0 | 23.185 | 38.641 | 46.37 | 57.963 | 81.147 | 92.74 |
| OT 13 | 0 | 23.733 | 39.555 | 47.467 | 59.332 | 83.065 | 94.934 |
| OT 14 | 0 | 24.418 | 40.696 | 48.836 | 61.045 | 85.463 | 97.672 |
| OT 15 | 0 | 22.118 | 36.863 | 44.236 | 55.295 | 77.413 | 88.473 |
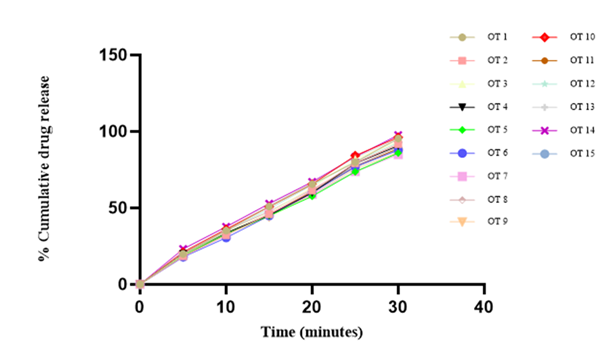
Figure 6: Percent cumulative drug release of Salbutamol sulphate of all the 15 Batches.
Preparation of salbutamol sulphate orodispersible tablets with responses
Table 20: The BBD composition of salbutamol sulphate orodispersible tablets formulations and their measured responses.
| Formulation Batch | Independent Variables | Dependent Variables | ||||
| Jackfruit Seed Starch | Lepidium Sativum Seed Mucilage | Polyvinyl Pyrrolidone K-30 | Disintegration Time (Minute) | In-Vitro Dissolution Time (%) | Hardness (kg/cm2) | |
| OT 1 | 10 | 8 | 5 | 49 | 95.425 | 3.4 |
| OT 2 | 5 | 8 | 3.5 | 51 | 91.77 | 4 |
| OT 3 | 15 | 5 | 2 | 44 | 93.501 | 3.1 |
| OT 4 | 10 | 5 | 3.5 | 42 | 90.668 | 3.8 |
| OT 5 | 10 | 8 | 2 | 45 | 85.955 | 3 |
| OT 6 | 5 | 5 | 5 | 47 | 87.874 | 4.2 |
| OT 7 | 5 | 2 | 3.5 | 42 | 84.894 | 3.5 |
| OT 8 | 10 | 2 | 2 | 44 | 89.955 | 2.9 |
| OT 9 | 10 | 5 | 3.5 | 40 | 86.339 | 3.9 |
| OT 10 | 15 | 5 | 5 | 48 | 96.183 | 4.3 |
| OT 11 | 10 | 5 | 3.5 | 38 | 88.998 | 3.8 |
| OT 12 | 10 | 2 | 5 | 37 | 92.74 | 4.4 |
| OT 13 | 15 | 2 | 3.5 | 45 | 94.934 | 3.6 |
| OT 14 | 15 | 8 | 3.5 | 50 | 97.672 | 3.2 |
| OT 15 | 5 | 5 | 2 | 43 | 88.473 | 3.4 |
Response Data Analysed for all 15 Batches Using Box-Behnken Design
All the responses are analyzed for all the 15-formulation batches using Box-Behnken Design by design expert software, and the results of the analysis of all three responses-disintegration time, in vitro dissolution test, and hardness—are in the ANOVA table and model graph provided below.
Response 1: Disintegration Time
ANOVA for Quadratic model
The suggested model of response 1 is a quadratic model for which ANOVA was studied, and in this model, an F-value of 5.31 implies the model is significant. There is only a 4.04% chance that an F-value this large could occur due to noise. P-values less than 0.0500 indicate model terms are significant. In this case, B and A² are significant model terms. Values greater than 0.1000 indicate the model terms are not significant.
Table 21: The analysis table of ANOVA for disintegration time.
| Source | Sum of Squares | df | Mean Square | F-Value | p-Value | |
| Model | 222.08 | 9 | 24.68 | 5.31 | 0.0404 | Significant |
| A-amount of jackfruit seed starch | 2.00 | 1 | 2.00 | 0.4301 | 0.5409 | |
| B-amount of Lepidium sativum seed mucilage | 91.12 | 1 | 91.12 | 19.60 | 0.0068 | |
| C-amount of polyvinyl pyrolidone K-30 | 3.13 | 1 | 3.13 | 0.6720 | 0.4496 | |
| AB | 4.00 | 1 | 4.00 | 0.8602 | 0.3962 | |
| AC | 0.0000 | 1 | 0.0000 | 0.0000 | 1.0000 | |
| BC | 30.25 | 1 | 30.25 | 6.51 | 0.0512 | |
| A² | 70.67 | 1 | 70.67 | 15.20 | 0.0114 | |
| B² | 25.44 | 1 | 25.44 | 5.47 | 0.0665 | |
| C² | 4.67 | 1 | 4.67 | 1.00 | 0.3621 | |
| Residual | 23.25 | 5 | 4.65 | |||
| Lack of Fit | 15.25 | 3 | 5.08 | 1.27 | 0.4688 | Not Significant |
| Pure Error | 8.00 | 2 | 4.00 | |||
| Cor Total | 245.33 | 14 |
Model Graph for the Response 1
2D and 3D surface plots show that factor B (amount of Lepidium sativum seed mucilage) has a significant effect on the response of one of the formulations, while the factor A (amount of jackfruit seed starch) has an optimum effect on disintegration time. An increase or decrease in the factor B significantly affects the disintegration time here; the optimum amount of factor B shows the desired disintegration time. While factor C has a non-significant effect.
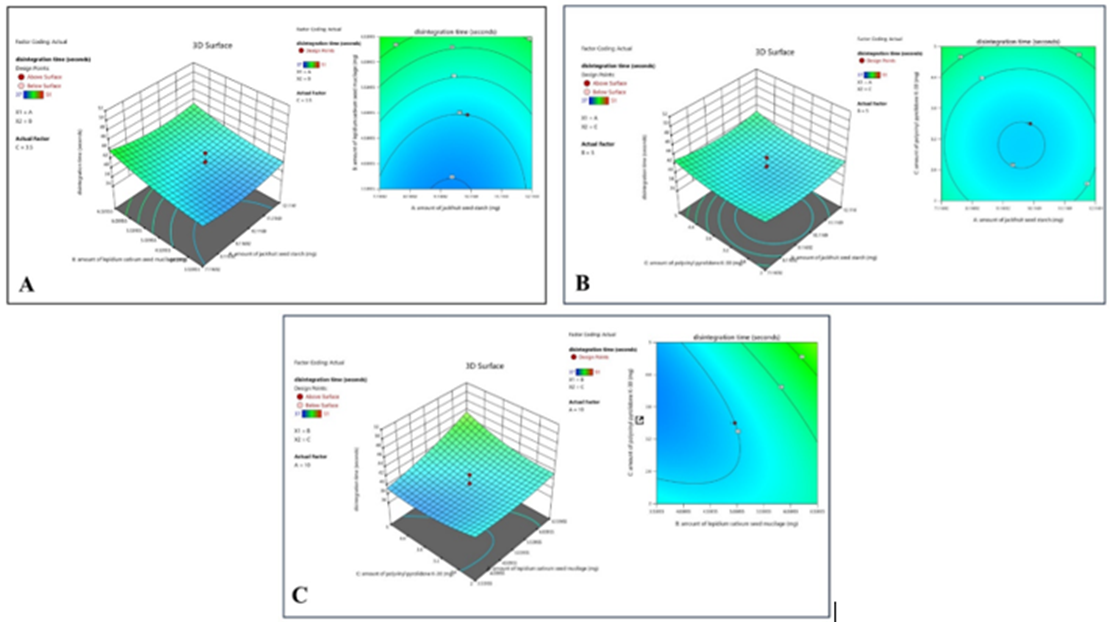
Figure 7: The 2-D contour map and 3D surface graph shows how the total amount of jackfruit seed starch (X1), lepidium sativum seed mucilage(X2) and polyvinyl pyrrolidone K-30 (X3) affects the disintegration time.
Response 2: Percent Drug Release
ANOVA for Linear Model
The suggested model for response 2 is a linear model for which ANOVA was studied. According to the model, an F-value of 6.43 implies the model is significant. There is only a 0.89% chance that an F-value this large could occur due to noise. P-values less than 0.0500 indicate model terms are significant. In this case, A is a significant model term. Values greater than 0.1000 indicate the model terms are not significant.
Table 22: The analysis table of ANOVA for percent drug release.
| Source | Sum of Squares | df | Mean Square | F-Value | p-Value | |
| Model | 141.46 | 3 | 47.15 | 6.43 | 0.0089 | Significant |
| A-amount of jackfruit seed starch | 107.16 | 1 | 107.16 | 14.61 | 0.0028 | |
| B-amount of lepidium sativum seed mucilage | 8.61 | 1 | 8.61 | 1.17 | 0.3018 | |
| C-amount of polyvinyl pyrolidone K-30 | 25.70 | 1 | 25.70 | 3.50 | 0.0880 | |
| Residual | 80.67 | 11 | 7.33 | |||
| Lack of Fit | 71.13 | 9 | 7.90 | 1.66 | 0.4322 | Not Significant |
| Pure Error | 9.53 | 2 | 4.77 | |||
| Cor Total | 222.13 | 14 |
Model Graph for Response 2
The represented 3D and 2D contour plots suggest that there is a significant effect of factor A (amount of jackfruit seed starch) on the percent drug release, while factor B and factor C have no or negligible effect on the desired response. The green color represents the optimum response, while increasing the factor A, the response also increases, shown in the reddish region.
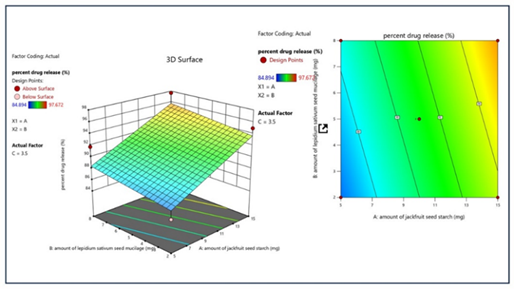
Figure 8: The 2-D contour map and 3D surface graph shows how the total amount of jackfruit seed starch (X1), lepidium sativum seed mucilage(X2) and polyvinyl pyrrolidone K-30 (X3) affects the percent drug release.
Response 3: Hardness
ANOVA for Quadratic Model
The suggested model for response 2 is a quadratic model for which ANOVA was studied. According to the model, an F-value of 10.12 implies the model is significant. There is only a 1.01% chance that an F-value this large could occur due to noise. P-values less than 0.0500 indicate model terms are significant. In this case, C, BC, and B² are significant model terms. Values greater than 0.1000 indicate the model terms are not significant.
Table 23: The analysis table of ANOVA for hardness.
| Source | Sum of Squares | df | Mean Square | F-Value | p-Value | |
| Model | 2.99 | 9 | 0.3321 | 10.12 | 0.0101 | Significant |
| A-amount of jackfruit seed starch | 0.1013 | 1 | 0.1013 | 3.08 | 0.1394 | |
| B-amount of lepidium sativum seed mucilage | 0.0800 | 1 | 0.0800 | 2.44 | 0.1793 | |
| C-amount of polyvinyl pyrolidone K-30 | 1.90 | 1 | 1.90 | 57.91 | 0.0006 | |
| AB | 0.2025 | 1 | 0.2025 | 6.17 | 0.0556 | |
| AC | 0.0400 | 1 | 0.0400 | 1.22 | 0.3200 | |
| BC | 0.3025 | 1 | 0.3025 | 9.21 | 0.0289 | |
| A² | 0.0041 | 1 | 0.0041 | 0.1250 | 0.7381 | |
| B² | 0.3141 | 1 | 0.3141 | 9.57 | 0.0271 | |
| C² | 0.0503 | 1 | 0.0503 | 1.53 | 0.2709 | |
| Residual | 0.1642 | 5 | 0.0328 | |||
| Lack of Fit | 0.1575 | 3 | 0.0525 | 15.75 | 0.0603 | Not Significant |
| Pure Error | 0.0067 | 2 | 0.0033 | |||
| Cor Total | 3.15 | 14 |
Model Graph Response 3
The given contour plot shows that the factor C (amount of polyvinyl pyrolidone K-30) has a significant effect on the response three; an increase in the amount of factor C leads to an increase in the hardness of the tablet. The factor B (amount of lepidium sativum seed mucilage) also has a significant effect on the hardness. The optimum interaction between factor C and factor B gives the desired response. The factor A has a non-significant effect on this response.
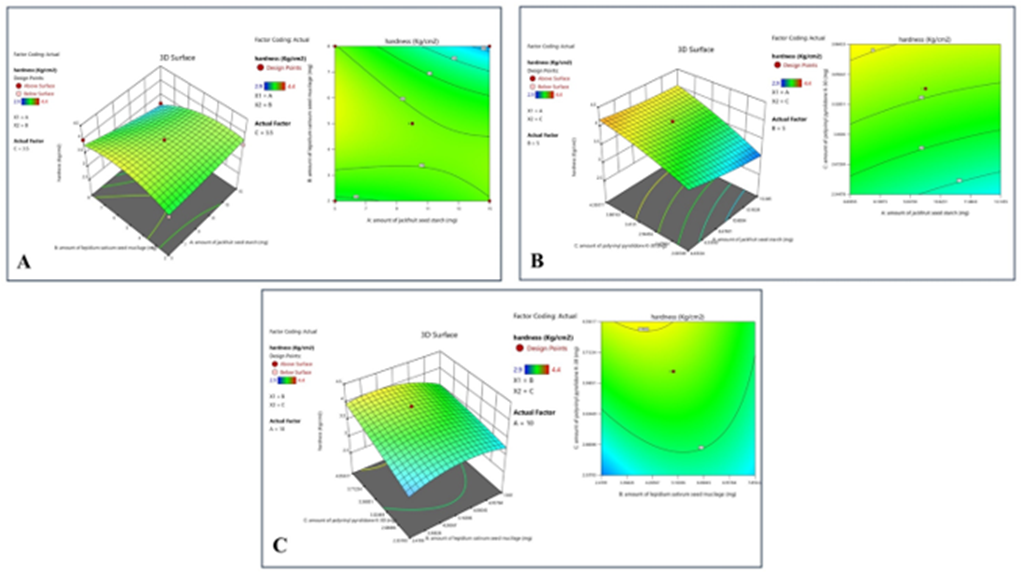
Figure 9: The 2-D contour map and 3D surface graph shows how the total amount of jackfruit seed starch (X1), lepidium sativum seed mucilage(X2) and polyvinyl pyrrolidone K-30 (X3) affects the hardness.
Optimized Batch
As we studied the Box-Behnken design, we put the responses that we analyzed from the evaluation studies as shown in the table. Then the Box-Behnken design optimized the responses and gave the optimized batch of formulation and the optimized batch responses, and the formulation is shown in the table.
Table 24: Formulation of optimized batch from bbd.
| S. No. | Ingredient | Quantities (In mg) |
| 1 | Salbutamol Sulphate | 8 |
| 2 | Jackfruit Seed Starch | 10.838 |
| 3 | Lepidium Sativum Seed Mucilage | 6.460 |
| 4 | Polyvinyl Pyrrolidone K-30 | 2.432 |
| 5 | Mannitol | 69.27 |
| 6 | Magnesium Stearate | 2 |
| 7 | Talc | 1 |
Table 25: Pre- compressional data of optimized batch.
| S. No. | Pre-compressional Evaluation Parameter | Results |
| 1 | Bulk Density | 0.469 |
| 2 | Tapped Density | 0.538 |
| 3 | Hausner’s Ratio | 1.172 |
| 4 | Carss Index | 6.875 |
| 5 | Angle of Repose | 27 |
Table 26: Post-compressional data of optimized batch.
| S. No. | Post-compression Evaluation Parameter | Results |
| 1 | Weight Variation | 103 |
| 2 | Thickness | 6.2 |
| 3 | Hardness | 3.357 |
| 4 | Wetting Time | 6±0.5 seconds |
| 5 | Disintegration Time | 41.562 |
| 6 | Friability | 0.16 |
| 7 | % Drug Release | 90.868 |
Table 27: The percent drug release of the optimised tablet.
| Formulation Batch | 0 min | 5 min | 10 min | 15 min | 20 min | 25 min | 30 min |
| Optimised Batch | 0 | 22.717 | 34.075 | 45.434 | 58.53 | 81.942 | 90.868 |
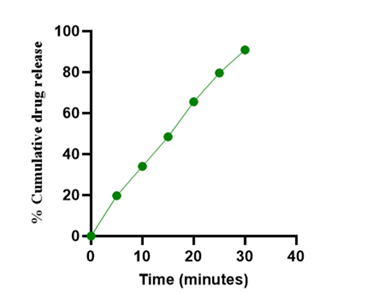
Figure 7: Percent cumulative drug release of Salbutamol sulphate of optimised batch.
Conclusion
The Box-Behnken design was used in the study to successfully develop and optimize salbutamol sulfate orodispersible tablets. The drug's solubility, crystallinity, and acceptable organoleptic qualities confirmed that it was a good fit for tablet formulation. Both pre- and post-compressional tests showed satisfactory hardness (3.357 kg/cm2), consistent weight variation, and good flow characteristics.
In order to ensure prompt therapeutic action, the optimized batch, which contained Lepidium sativum seed mucilage (6.460 mg) and jackfruit seed starch (10.838 mg) as natural superdisintegrants, demonstrated high drug release (90.86% in 30 min), fast wetting (6 sec), and rapid disintegration (41.56 sec). ANOVA revealed that jackfruit seed starch improved drug release, but Lepidium sativum mucilage had a significant impact on disintegration time. Polyvinyl pyrrolidone K-30 was essential for preserving the hardness of the tablets.
When everything was taken into account, the specially designed salbutamol sulfate orodispersible tablet formulation had sufficient mechanical strength, quick disintegration, and efficient drug release, which made it a strong contender to increase patient compliance, particularly for patients with respiratory disorders. In pharmaceutical applications, the formulation's durability, safety, and effectiveness are further improved by the use of natural superdisintegrants.
Declarations
Conflict of Interest
The authors declare that they do not have any financial or personal relationship with other people or any other organization that could inappropriately influence this research work.
Acknowledgements
I am grateful to the IPS Academy College of Pharmacy, Indore, for offering facilities and resources for this project. Their support facilitated the smooth execution of the research.
References
- Ali M, Choudhary R, Rabyang S, Thinlas T, Mishra A. (2023). Harsh Environmental Stressors of High Altitude on Pathogens Susceptibility. Genomic Surveillance and Pandemic Preparedness. 357-373.
Publisher | Google Scholor - Ourania S. Kotsiou. (2022). Asthma and Autoimmunity. Translational Autoimmunity. 261-289.
Publisher | Google Scholor - Ayakannu, R., Abdullah, N. A., Radhakrishnan, A. K., Raj, V. L., Liam, C. K. (2019). Relationship Between Various Cytokines Implicated in Asthma. Human Immunology, 80(9):755-763.
Publisher | Google Scholor - Marques, L., Vale, N. (2022). Salbutamol in the Management of Asthma: A Review. International Journal of Molecular Sciences, 23(22):14207.
Publisher | Google Scholor - Kumar, N., Pahuja, S. (2019). Dispersible Tablets: An Overview. J Med Pharm Allied Sci, 8(3):2183-2199.
Publisher | Google Scholor - Haddad, R., Gardouh, A. R. (2024). Development and Evaluation of An Orodispersible Tablet Formation for The Delivery of a Hydrophobic Drug. Advances in Pharmacological and Pharmaceutical Sciences, 2024(1):7914860.
Publisher | Google Scholor - Ejeta, F., Gabriel, T., Joseph, N. M., Belete, A. (2022). Formulation, Optimization and In Vitro Evaluation of Fast Disintegrating Tablets of Salbutamol Sulphate Using a Combination of Superdisintegrant and Subliming Agent. Current Drug Delivery, 19(1):129-141.
Publisher | Google Scholor - Zhang, Y., Li, B., Xu, F., He, S., Zhang, Y., et al. (2021). Jackfruit Starch: Composition, Structure, Functional Properties, Modifications and Applications. Trends in Food Science & Technology, 107:268-283.
Publisher | Google Scholor - Kilor V., Bramhe N.N. (2014). Development of Effective Extraction Method for Lepidium Sativum Seed Mucilage with Higher Yield. Journal of Advanced Pharmacy Education and Research. 4(3);354-360.
Publisher | Google Scholor - Pharmacopoeia, I. (2010). Government of India, Ministry of Health and Family Welfare, the Indian Pharmacopeia Commission. Ghaziabad, India: Indian Pharmacopoeia, 187-193.
Publisher | Google Scholor - Srinivasan, S., Elumalai, K., Cherian, B. V., Ramanujam, S. K. (2023). Formulation and Characterization of Metformin Hydrochloride Orodispersible Tablets with Super Disintegrants. Intelligent Pharmacy, 1(3):162-166.
Publisher | Google Scholor - Su, J., Zhang, K., Qi, F., Cao, J., Miao, Y., et al. (2023). A Tablet Ability Change Classification System in Supporting the Tablet Formulation Design Via the Roll Compaction and Dry Granulation Process. International Journal of Pharmaceutics: X, 6:100204.
Publisher | Google Scholor - Islam, M. R., Hasan, S. K. (2024). Bael (Aegle Marmelos) Fruit-Based Effervescent Tablet Formulations: Impact on Physicochemical Properties, Bioactive Compounds, And Sensory Attributes. Heliyon, 10(23).
Publisher | Google Scholor - Polak, P., Sinka, I. C., Reynolds, G. K., Roberts, R. J. (2024). Successful Formulation Window for The Design of Pharmaceutical Tablets with Required Mechanical Properties. International Journal of Pharmaceutics, 650:123705.
Publisher | Google Scholor - Belayneh, A., Molla, F., Kahsay, G. (2020). Formulation and Optimization of Monolithic Fixed‐Dose Combination of Metformin HCl and Glibenclamide Orodispersible Tablets. Advances in Pharmacological and Pharmaceutical Sciences, 1:3546597.
Publisher | Google Scholor - Alhabardi, S., Mahrous, G., Alshahrani, A., Taha, E. (2024). Pharmaceutical Quality of Dispersible Diclofenac Tablets in The Saudi Market. Saudi Pharmaceutical Journal, 32(12):102206.
Publisher | Google Scholor - Koirala, S., Nepal, P., Ghimire, G., Basnet, R., Rawat, I., et al. (2021). Formulation and Evaluation of Mucoadhesive Buccal Tablets of Aceclofenac. Heliyon, 7(3).
Publisher | Google Scholor - Hadinugroho, W., Tjahjono, Y., Foe, K., Esar, S. Y., Caroline, C., et al. (2024). Characterization of 2-((4-(Chloromethyl) Benzoyl) Oxy) Benzoate Acid for Analgesic Tablet Dosage Form Formulation. Current Research in Pharmacology and Drug Discovery, 7:100200.
Publisher | Google Scholor - Laovachirasuwan, P., Chainom, N., Kaengin, S., Nualkaew, S. (2024). Tablet Formulation for Ophthalmic Disease Prevention Using a Combination of Lutein and Naringin Extracted from The Flower of Tagetes Erecta L. And Fruit Membrane of Citrus Maxima (Burm. F.) Merr. Extract. Heliyon, 10(23).
Publisher | Google Scholor - Eisa, A. M., El-Megrab, N. A., El-Nahas, H. M. (2022). Formulation and Evaluation of Fast Dissolving Tablets of Haloperidol Solid Dispersion. Saudi Pharmaceutical Journal, 30(11):1589-1602.
Publisher | Google Scholor - Sabbatini, B., Perinelli, D. R., Palmieri, G. F., Cespi, M., Bonacucina, G. (2023). Sodium Lauryl Sulfate as Lubricant in Tablets Formulations: Is It Worth? International Journal of Pharmaceutics, 643:123265.
Publisher | Google Scholor - Patil, P. S., Suryawanshi, S. J., Patil, S. S., Pawar, A. P. (2024). HME-Assisted Formulation of Taste-Masked Dispersible Tablets of Cefpodoxime Proxetil and Roxithromycin. Journal of Taibah University Medical Sciences, 19(2):252-262.
Publisher | Google Scholor