
Research Article
Application of data-driven Decision Support System in Combating Illegal Wildlife Trade on Internet
1College of Economics and Management, Northeast Forestry University, Harbin, China.
2School of Civil Engineering and Transportation, Northeast Forestry University, Harbin, China.
*Corresponding Author: Shengfeng Hu, College of Economics and Management, Northeast Forestry University, Harbin, China.
Citation: Hu S., Li C. (2025). Application of data-driven Decision Support System in Combating Illegal Wildlife Trade on Internet. Journal of BioMed Research and Reports, BioRes Scientia Publishers. 7(5):1-9. DOI: 10.59657/2837-4681.brs.25.155
Copyright: © 2025 Shengfeng Hu, this is an open-access article distributed under the terms of the Creative Commons Attribution License, which permits unrestricted use, distribution, and reproduction in any medium, provided the original author and source are credited.
Received: April 11, 2025 | Accepted: April 25, 2025 | Published: May 02, 2025
Abstract
With the rapid development of the Internet, the illegal wildlife trade is becoming increasingly serious, posing a threat to biodiversity. Using big data and artificial intelligence technology, this paper identifies abnormal transactions and network relationships by analyzing social media and e-commerce platforms, combined with random forests and graph neural networks, to enhance the efficiency of the crackdown. Random forest algorithms reveal nonlinear patterns and abnormal behavior, and graph neural networks help reveal the complex structure of the transaction network. In implementing the strategy, this paper uses a multi-attribute decision-making model (MADM) and analytic hierarchy Process (AHP) to assess and select the best partners, such as the United Nations Environment Programme, to optimize resource allocation and synergies. Through these technologies, this paper hopes to significantly increase the precision and speed of combating illegal wildlife trade, thereby effectively protecting biodiversity and contributing to the sustainable development of the planet and the harmonious coexistence of the natural environment.
Keywords: illegal wildlife trade, big data, hierarchical analysis, multi-attribute decision modeling
Introduction
Illegal wildlife trade, a global threat to ecological security, has become a serious challenge that cannot be ignored. According to the Wildlife Conservation Society, it is worth $26.5 billion a year, making it one of the largest illegal trades in the world [1]. This phenomenon not only threatens the survival of countless wild animals and plants, accelerates the process of species extinction and ecological imbalance, but also involves complex social problems such as transnational criminal networks, economic poverty, and social order turbulence. In the face of this challenge, this research project aims to build a comprehensive response framework based on big data analysis, to curb the spread of illegal wildlife trade fundamentally [2-3]. This paper is committed to strengthening the protective barrier of biodiversity and reducing the environmental and social impact of illegal trade, but this paper also looks forward to effectively blocking illegal trade through accurate data analysis and strategy implementation, to contribute to global ecological sustainability and social stability [4-5].
To solve the complex problem of illegal wildlife trade, this study adopted a random forest algorithm (Breiman, 2001), a machine learning method proposed by Leo Breiman, which has been widely used in many fields such as financial fraud detection and medical diagnosis. With its ability to process high-dimensional data and excellent predictive performance, the random forest algorithm shows great potential in identifying abnormal transaction patterns and network relationships [6-7]. In this study, this paper applies this algorithm to the data analysis of illegal wildlife trade, and through the construction of a decision tree set model, effectively identify illegal trade behavior, and provide strong technical support for law enforcement departments. Our research shows that the random forest algorithm has high feasibility and application value in the current field.
This study first built a real-time monitoring system to collect data from multiple sources such as social media, e-commerce websites, and customs records, and carried out necessary pre-processing, including data cleaning, missing value processing, and format unification, to ensure the quality and consistency of data. This paper then applies natural language processing (NLP) technology to analyze the text data, extract key information such as transaction locations, wildlife species, etc. And uses computer vision technology to identify and analyze wildlife features in pictures and videos. On this basis, this paper builds a random forest model to learn normal trading patterns and identify abnormal trading behaviors, analyze the structure of the trading network, and identify key nodes and potential illegal trading gangs. Finally, this paper used the ARIMA model to predict changes in the volume of illegal wildlife trade and the improvement of enforcement success after the implementation of the project and assessed the model performance and the likelihood of project success through sensitivity analysis to provide a scientific basis for policy formulation and enforcement actions [8-11]. Risk Assessment and Development Strategies for Online Illegal Wildlife Trade This paper builds a real-time monitoring system, which will periodically obtain data from an API, perform necessary preprocessing on the data, and then store it in the local database.
Data source
Social media platforms (such as Facebook, Twitter, Instagram, etc.) Use crawler technology to collect posts, comments, and pictures of wildlife trade from users. This data may contain information such as location, price, type of transaction, etc. E-commerce sites (such as eBay, Amazon, Alibaba, etc.) Monitor and record transaction records of online sales of wildlife and their products, including product descriptions, buyer reviews, sales records, etc [12]. Customs and trade records: Official import and export data are collected, which usually contain detailed information on commodity classification, quantity, value, and origin. Logistics information: Through partners or open data sources, get logistics tracking information, including shipping path, time, type of goods, etc. [13-14]. Government reports and public databases: Reports and databases published by organizations such as the United Nations Environment Programme (UNEP) and the International Union for Conservation of Nature (IUCN) provide statistics and case studies on the illegal trade. [15].News reports and non-governmental organizations (NGO) reports: Collect media and NGO reports on the illegal wildlife trade and obtain real-time information on cases, trends, and incidents. [16]-[18].
Data type
Transaction record: record the time, amount, quantity, buyer, and seller of each transaction in detail.
User comments: Analyze users' comments on social media and e-commerce platforms, and extract useful information, such as trading experience, product quality, etc. Pictures and videos: Use computer vision technology to identify and analyze wildlife species, status, and other features in pictures and videos. Logistics information: Through logistics data, track the transportation route and time of wildlife and its products.
Data preprocessing
This paper chose to use the average padding method to deal with missing data:

Where n is the number of non-missing values, representing the ith non-missing value.
The Z-score method is used to identify the outliers by calculating the normalized difference between each value and the mean:

X is the value to be detected, is the mean value of the data set, representing the central trend of the data;
 is the standard deviation of the data set, measuring the degree of dispersion of the data.
When the absolute value of the Z-score of a data point exceeds 3, this thinks think it may be an outlier. Then this paper did format unification: this paper converted the data into a unified format for subsequent analysis and modeling. Through these methods, this paper ensures the integrity and consistency of the data and provides a reliable basis for subsequent analysis and modeling.
Selection of indicators
This paper uses natural language processing (NLP) technology to extract key information, such as wildlife species and trading location, from transaction descriptions and user comments. The deep learning algorithm is used to classify and identify the pictures and videos, and the wildlife species are determined. By analyzing the characteristics of transaction frequency, transaction time, and price fluctuation, the system can identify unusual transaction patterns, such as frequent small transactions that may indicate illegal activities. In this process, this paper uses a this paperighted average formula to assign values to individual data and calculate a composite score.

Where  is the weight of the ith indicator
  is the score of the ith indicator, and n is the total number of indicators.
Relying on this approach, this paper can convert a variety of data into a uniform format acceptable to the system, so that this paper can assess the risk of illegal wildlife trade occurring.
Evaluating the Impact of Technological Applications on Illegal Trade
Multi-attribute decision-making model
Based on the combination of staff size, funding, and power, this paper analyzed the multi-attribute decision models of four organizations this paper were interested in, such as UNEP. The judgment matrix and consistency ratio (CR) of the analytic hierarchy process (AHP) are used to evaluate the rationality of weights:
 (4)
(4)
Consistency Ratio (CR) Calculation Formula:
 (5)
(5)
Where ci is the consistency index of the decision matrix, Ri is the random consistency index.
The test results show that CR is close to or less than 0.1, which means that this paper can accept these weights. In our analysis, this paper was tested against the available reference data, assigning weights of 0.3, 0.3, and 0.4 to people, size, funding, and power, respectively. Correlation scores were assigned to the four organizations through data integration. This paper found that the United Nations Environment Programme had the highest overall rating, indicating that they were the most suitable partners. Of course, it should be noted that our dimensional scores may not always be accurate due to the lack of extensive data, but the large differences in the final combined scores are sufficient to demonstrate that UNEP is the best choice for our clients, as shown in Figure 1 and Figure 2.
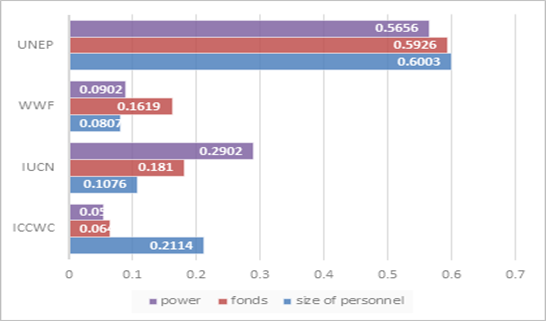
Figure 1: Scoring of four organizations' multi-attribute decision models.
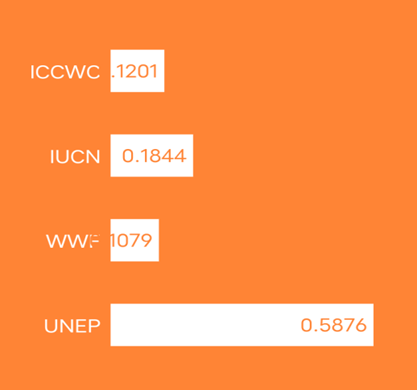
Figure 2: Comprehensive scoring of the four organizations.
Random forest model
This paper uses historical transaction data as a training set, which includes various characteristics such as transaction amount, frequency, time, user behavior, etc. Then, through feature engineering, identify the features related to illegal trading behavior, such as abnormal trading patterns, high-frequency small transactions, and so on. This paper uses the information gain formula to measure the contribution of each characteristic's data to determining whether the transaction is illegal.
 (6)
(6)
Among them, S is a sample set, A is a feature, and  is a subset of samples where feature A takes value v.
Then this paper constructs a stochastic forest model, using the ensemble learning method to deal with a large number of features and identify complex nonlinear relationships. The model learns normal trading patterns, and when new trading behavior deviates significantly from these patterns, it is marked as potentially illegal trading. Here's a simple example.
This paper then constructs a stochastic forest model using these features as inputs. Then, this paper uses the trained stochastic forest model to predict the new trading data and get the risk evaluation value. Next, this paper can use the 'scatter 3' function to plot a three-dimensional scatter plot between sensitive word scores, geographic location scores, trading time scores, and trading mode scores, but this time this paper will use the predictions of the stochastic forest model as color coding. Indicates the level of risk. The results are shown in Figure 3.
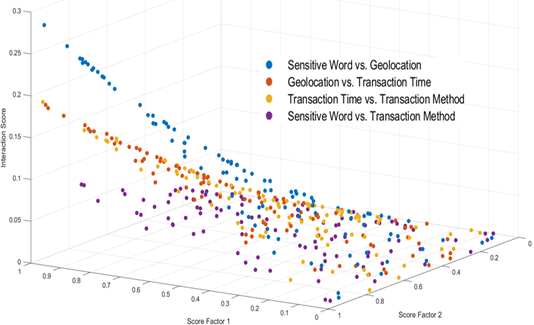
Figure 3: Three-dimensional Scatter Plot of Factor Interaction and Risk Assessment.
Finally, this paper can judge whether the transaction is high-risk or low-risk according to the total risk evaluation value (i. e. 'risk_score') and the preset risk threshold, and display the corresponding information in the command window: Through this simple demonstration, this paper shows the basic principles of how our project works, which allows us to warn of illegal wildlife trade going on online. Risk assessments are also carried out in areas where illegal wildlife trade is likely. With the support of our customers to obtain sufficient data and technical resources, this paper will also introduce the seasonality of the illegal wildlife trade in various regions. Indicators such as the probability of different species of protected animals being threatened and the influence of religious culture on the probability of illegal wildlife trade, improve our algorithm and model and make the results more accurate.
ARIMA model
At this stage, this paper utilized advanced statistical modeling techniques, in particular, ARIMA (autoregressive integrated Moving Average) models, to predict the impact on the illegal wildlife trade after the implementation of the study. The ARIMA model captures trends, seasonality, and random fluctuations in time series data to make predictions about future illegal trading volumes.
First, this paper selected illegal wildlife trading volume (including quantity, species, and value) as the dependent variable, and time series data and enforcement success rate as the variables. Data on the illegal wildlife trade over the past few years was collected, including key indicators such as the number, type, and value of the trade. Through data preprocessing, this paper eliminates outliers and missing values to ensure the accuracy of model training. This paper then differentially processed the data to smooth out the trends in the time series. Then, this paper uses the autocorrelation and partial autocorrelation functions (ACF and PACF) to determine the order of the model and construct a suitable ARIMA model.
 (7)
(7)
Where  is the value of the time series, B is a lag operator,
 and
and  are polynomials of difference and non-seasonal difference, respectively,
 is an error term, d is the order of the non-seasonal difference.
Model parameter estimation and verification
This paper first plotted the normalized raw data, and by estimating the model parameters and fitting the normalized data, this paper obtained the predicted impact data for the next five years. Then this paper inverts the normalized prediction results back to the original data space, establishes the evaluation model, and then draws the residual and auto-correlation graphs by drawing the original data and prediction results. The results are shown in Figures 4 & 5.
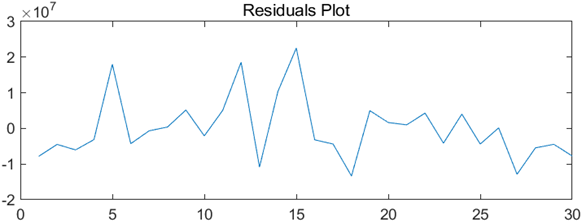
Figure 4: Residual Diagram
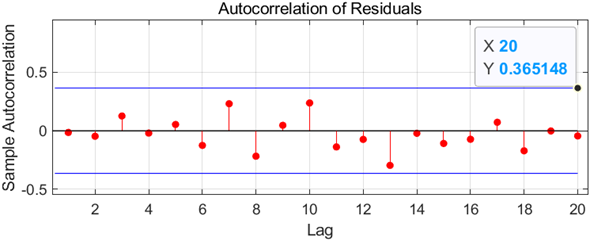
Figure 5: Auto-correlation diagram.
Impact simulation and comparative analysis
Then, by replacing the original simulation data with the supplied data, this paper simulated the comparison before and after the introduction of block-chain technology: By combining the simulation data and updating the time variables to include the entire time series, this paper assumes that every 1% increase in enforcement success rate in a certain range will result in a 10 percent decrease in the current illegal trading volume. Finally, this paper draws a graph of the adjusted prediction results. The results are shown in Figure 6.
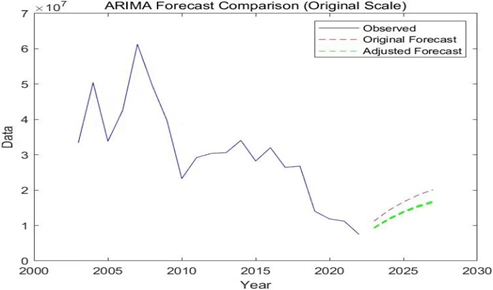
Figure 6: Comparison and prediction of illegal animal trading volume before and after the implementation of the project.
Expected effect and predicted result
The root forecast results show that the illegal wildlife trade volume is expected to decrease significantly as the project is implemented. For example, it is projected that illicit trading volumes may decrease by 20 percent in the first year of the study and continue to decline over the next five years, with cumulative reductions of more than 50 percent. This reduction is reflected not only in the number of transactions but also in the types of species involved and the number of transactions. The results are shown in Figure 7.
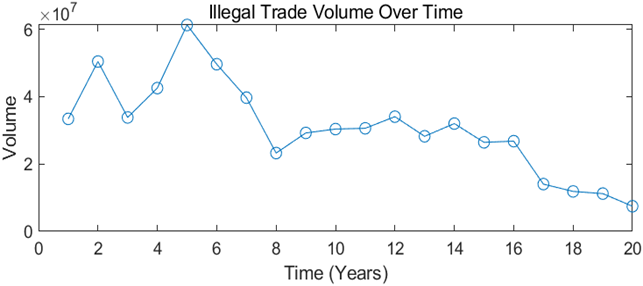
Figure 7: Prediction Chart of the Change of Illegal Wildlife Trading Volume.
In addition, this paper predicts an increase in the success rate of enforcement. After the implementation of the project, due to the application of a data-driven decision support system, law enforcement departments can more accurately locate and combat illegal transactions, and the success rate of law enforcement is expected to increase from the current 40percent to more than 60percent . This will significantly enhance the deterrence of illegal trading and reduce the likelihood of criminals taking chances. The results are shown in Figure 8.
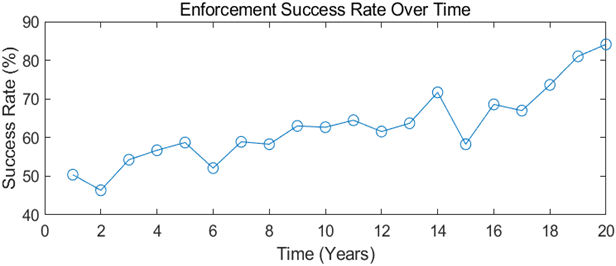
Figure 8: Prediction of Change of Law Enforcement Success Rate.
The implementation of the study will also have other positive impacts. Public awareness of the illegal wildlife trade will be raised, and through education and awareness campaigns, this paper expects to reach at least 30 percent of online users to become aware of and participate in the fight against the illegal trade. At the same time, international cooperation will be strengthened, and coordination among national governments and organizations will be smoother to jointly formulate and implement more effective policies. Overall, our model projections show that data-driven decision support systems have great potential to combat the illegal wildlife trade on the Internet. Through continuous model optimization and data updating, this paper believes that this system will make an important contribution to the conservation and sustainable development of global biodiversity.
Quantitative Analysis and Sensitivity Exploration of Project Success Probability
In the Possibility and Sensitivity Analysis stage, this paper explored the various factors of success, including capital investment, human resources, and the speed of technology renewal, and assessed their potential impact on the final result. A series of statistical and simulation methods simulation methods to ensure the stability and adaptability of the model to different conditions. To check the performance of the model and tune it, this paper first loads and partitions the illegal transaction data set, and then creates a random forest classifier. The training data sets are used for training, and the prediction and evaluation are made on the test data sets. This paper used accuracy and classification reports to assess the performance of the model. This paper then used cross-validation to further evaluate the stability and generalization of the model. Finally, this paper performs super parameter tuning by grid search and evaluates the model performance on the test set with the best parameters. The results are shown in Table 1.
Table 1: Hyperparameter setting and model evaluation.
| Parameters | Value |
| - n_estimators | 200 |
| - max_depth | 15 |
| - min_samples_split | 5 |
| - min_samples_leaf | 1 |
| - bootstrap | True |
| accuracy | 95% |
| Recall rate | 98% |
| precision | 93% |
| F1Score | 95.5% |
| False positive rate | 5% |
Through these quantitative indicators and advantages, this paper can see the effectiveness of random forest-based decision support systems in detecting illegal wildlife trade. It can not only provide accurate classification results, but also has good interpret ability and robustness, and can provide strong support for law enforcement departments.
This paper conducted a probability analysis to quantify the probability of project success. By constructing a probabilistic model, this paper considers the impact of a combination of different factors on project success. For example, this paper found that funding is directly related to the scale and speed of project execution, while the adequacy and lack of human resources affect the efficiency of data collection and analysis. The technology update speed affects the accuracy and real-time performance of the model. This paper used a multiple logistic regression model to estimate the impact of these factors on the likelihood of project success and evaluated the effects of various combinations by simulating different scenarios.
Next, this paper performed a sensitivity analysis to determine how sensitive the model is to changes in input parameters. This paper selected key parameters, such as the increase in capital investment, the increase or decrease in human resources, and the adoption of new technologies, and conducted a series of sensitivity tests. This paper found that although the model performed stable for the most part, it was highly sensitive to funding input, meaning that a modest increase in funding can significantly improve the likelihood of project success. However, the increase in human resources is relatively small to the improvement of model performance, but it is crucial to maintain the stability of system operation. The improvement of technology update speed has a significant positive impact on the prediction ability and response speed of the model. The results are shown in Figure 9.
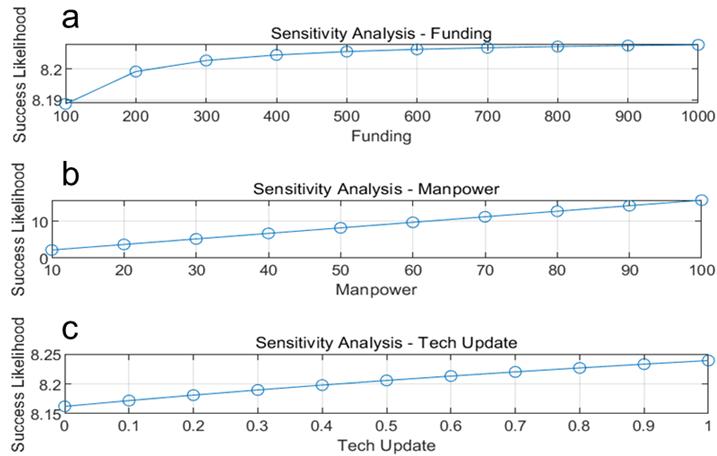
Figure 9: Sensitivity analysis of different indicators. (a) Funding; (b)Manpower; (c)Tech Update.
To visualize these results, this paper created 3 D scatter plots that color-coded the probability of project success for different parameter combinations. These graphs reveal the distribution of the probability of success in the parameter space and help us identify the most favorable combination of conditions. In addition, cross-validation and grid search were performed to optimize model parameters to ensure that the model performed consistently across different data sets. The results are shown in Table 2 and Figure 10.
Table 2: Combination of the most favorable and unfavorable conditions for success .
| Project | Capital Level | Personnel Investment | Technology Iteration | Success Rate |
| Combination of most favorable conditions | 1.4 | 1.2 | 1.1 | 1 |
| Combination of most unfavorable conditions | 0.5 | 0.6 | 0.9 | 0.16 |
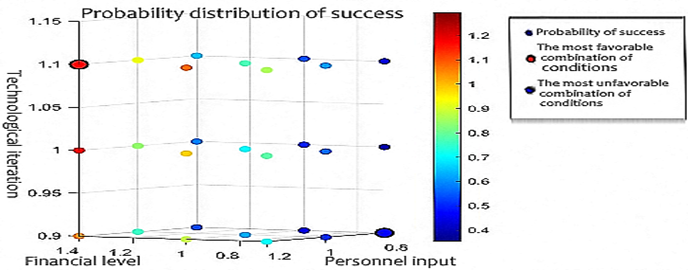
Figure 10: Probable distribution of success.
From these analyses, this paper concludes that the likelihood of success is influenced by a combination of factors, with capital investment and speed of technological renewal being key drivers. To maximize the effectiveness of research, this paper needs targeted investment and optimization in these areas. At the same time, this paper recognizes that although the model is stable in most cases, the sensitivity of the model may be insufficient in the absence of large amounts of data. Their predictive capabilities need to be improved through continuous data collection and model updates.
Conclusion
This study demonstrates the powerful potential of big data, artificial intelligence, and multi-attribute decision-making models in this field by building a data-driven decision support system that has been successfully applied to combat illegal wildlife trade online. This paper uses random forest models to identify abnormal transaction patterns, analyzes the transaction network structure through graph neural networks to identify key nodes, and uses an analytic hierarchy process to select the best partners, such as the United Nations Environment Programme. The results show that the combination of these technologies significantly improves the efficiency of identifying illegal transactions, and it is predicted that illegal transactions will decrease significantly after the implementation of the project, and the success rate of law enforcement will also be significantly improved. In addition, sensitivity analysis reveals the importance of funding and technology updates to project success. These findings provide a powerful tool for the conservation of global biodiversity and provide a scientific basis for future strategies to combat illegal wildlife trade.
This paper provides a research approach and framework for applying data science methods to policy research and international relations, especially in combating transnational crime and environmental governance. Through real-time monitoring, intelligent analysis, and multi-dimensional decision support, this paper demonstrates the feasibility of this approach to solving complex, cross-domain problems. The framework will not only help law enforcement agencies more effectively locate and combat illegal activities, but also facilitate international cooperation and information sharing, and improve the precision and speed of policy development. The findings suggest that data science and AI technologies can become indispensable tools in future policy research and international relations, providing new perspectives and strategies for global cooperation to address common challenges.
References
- Chen, Y. (2023). Solution to the problem of online illegal wildlife trade certification [J]. Forest and Grassland Resources Research, 2023(06):91-97.
Publisher | Google Scholor - Yang, M. (2022). Research on Investigation Countermeasures of Illegal Wildlife Trade Crime [D]. Southwest University of Political Science and Law.
Publisher | Google Scholor - Shao, D. (2020). Research on Intelligence Collection of Illegal Wildlife Trade Crime [D]. People's Public Security University of China.
Publisher | Google Scholor - Liu, C., & Zhou, Y. (2017). Current situation and countermeasures of online illegal trade of live wild animals [J]. Journal of the Chinese Criminal Police Academy, 5:52-57.
Publisher | Google Scholor - Fei, Y. L., Zhou, Y. W., Liu, D. W., Hou, S. L., & Pan, H. C. (2019). Hazards and Regulation of the Networking of Wildlife Illegal Trade [J]. Journal of Wild Animal Science, 40(04):1031-1034.
Publisher | Google Scholor - Yao, K. (2024). Research on Model and Algorithm of Graph Neural Network [D]. Taiyuan: Shanxi University.
Publisher | Google Scholor - Li, Y., Liao, M., & Zhang, J. (2024). An interpretable enhanced model of random forest using ensemble pruning and multi-objective optimization algorithms [J/OL]. Application Research of Computers, 02:1-9.
Publisher | Google Scholor - Chen, M., Zhang, H., Jiao, N., et al. (2024). Research on GDP prediction based on ARIMA model using MATLAB [J]. China Market, 12:1-4.
Publisher | Google Scholor - Lavorgna, A. (2014). Wildlife trafficking in the Internet age: The changing structure of criminal opportunities [J]. Crime Science, 3(5).
Publisher | Google Scholor - Oyanedel, R., Gelcich, S., Mathieu, E., & Milner-Gulland, E. J. (2022). A dynamic simulation model to support a reduction in illegal trade within legal wildlife markets [J]. Conservation Biology, 36:e13868.
Publisher | Google Scholor - Sas-Rolfes, M., Challender, D. W. S., Hinsley, A., et al. (2019). Illegal Wildlife Trade: Patterns, Processes, and Governance [J]. Annual Review of Environment and Resources, 44(1):1-28.
Publisher | Google Scholor - (2024). (n.d.). National E-Commerce Public Service Network.
Publisher | Google Scholor - (2024). (n.d.). UN Comtrade Database.
Publisher | Google Scholor - (2024). (n.d.).WTO Data.
Publisher | Google Scholor - (2024). (n.d.). UNEP official website.
Publisher | Google Scholor - (2024). (n.d.). Wildlife trade monitoring network.
Publisher | Google Scholor - (2024). (n.d.). WildAid official website.
Publisher | Google Scholor - (2024). (n.d.). EIA official website.
Publisher | Google Scholor